Group candlestick patterns are more creative but take time to form. Generally, these are believed to be more effective signals when they occur on the longer-term time frames.
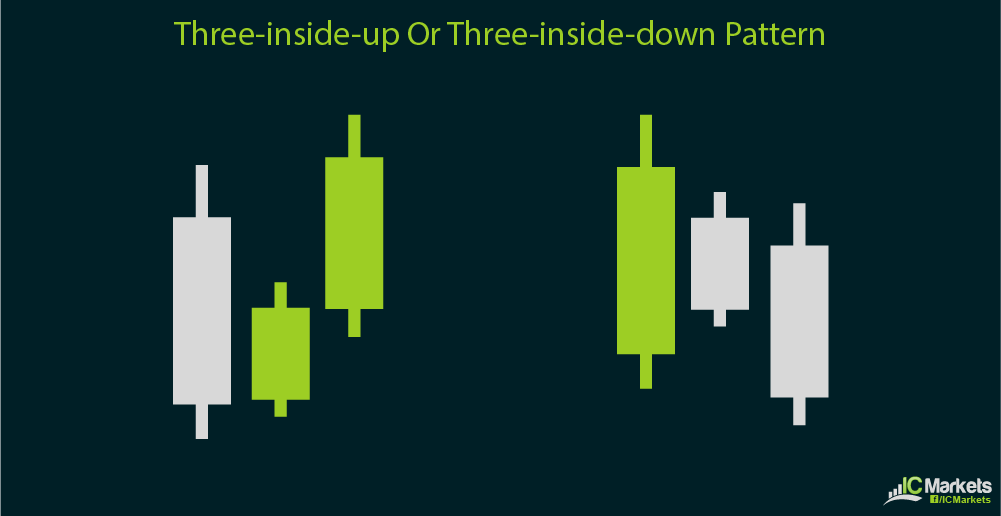
First is the three-inside-up or three-inside-down pattern, which is basically indicative of a possible reversal. It can be considered a harami double candlestick pattern plus an additional confirmation candle.
The first candle is a long one in the direction of the previous trend, with the second candle as an inside day pattern. The third or confirmation candle is another long one in the direction of the reversal trend, closing higher than the first candle for a bullish signal or lower than the first candle for a bearish signal.
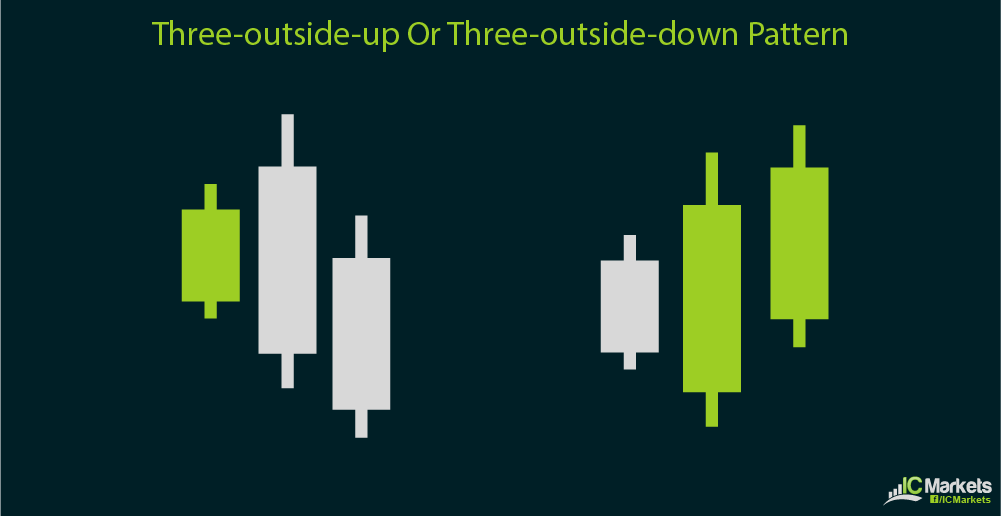
Next is the three-outside-up or three-outside-down pattern, which basically looks just as it sounds. This can also be considered an engulfing double candlestick pattern with an additional confirmation candle.
The difference is that the first candle is a short one in the opposite direction of the previous trend. The second candle should engulf the first one and should be in the direction of the reversal. The third or confirmation candle should also be in the direction of the new trend and must close higher than the second candle for a bullish signal or close lower than the second candle for a bearish signal.
Another interesting and reliable triple candlestick formation is the three white soldiers. This is a bullish signal simply comprised of three long white or green candles, hinting at further gains for the forex pair.
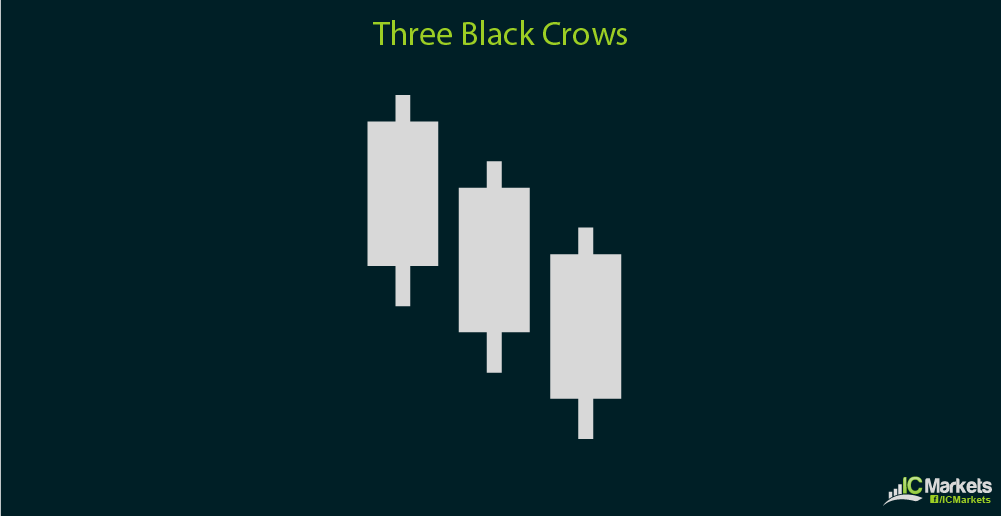
The bearish counterpart of the three white soldiers is the three black crows. This is comprised of three long black or red candlesticks, indicating that a deeper selloff is in the cards for the pair.
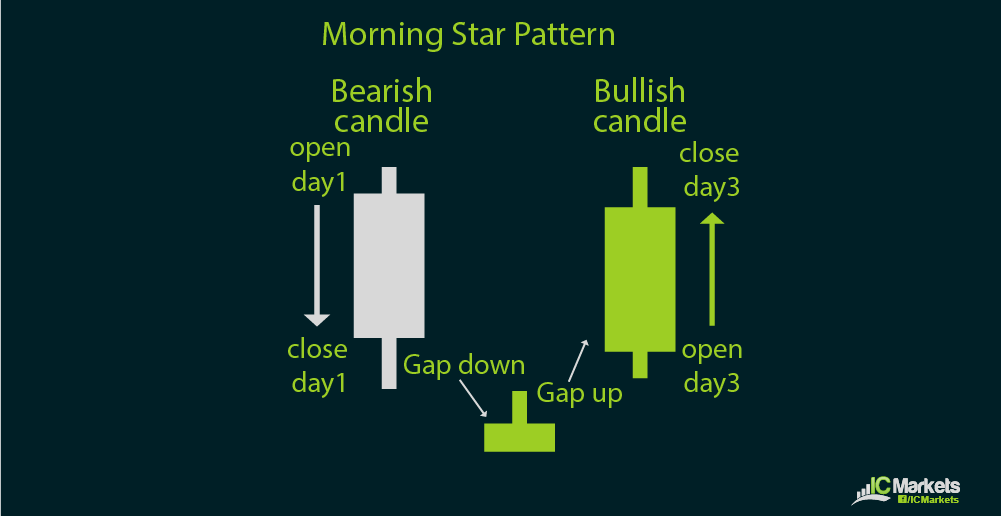
The morning star, which is a bullish signal, occurs at the end of a downtrend and signals the start of an uptrend. The first candle is a bearish one while the second candle gaps down for the open but closes higher. The third candle is a bullish one, covering most of the first candle’s body.
The second candle could also be a doji, which would make the pattern a bullish doji star formation.
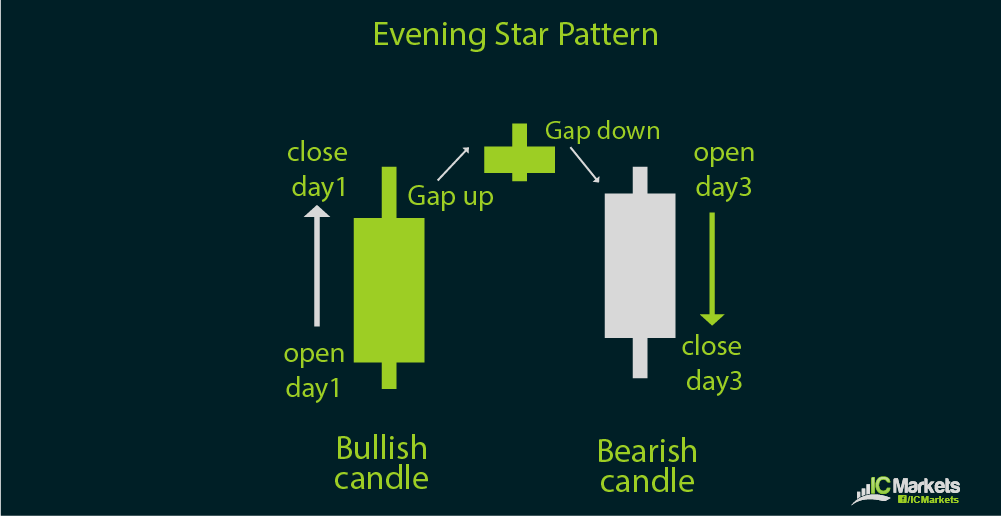
The evening star, which is the bearish counterpart of the morning star, occurs at the end of an uptrend and signals a potential downtrend. The first candle is a bullish one while the second candle gaps higher for the open then closes lower. The third candle is a bearish one, covering most of the first candle’s body.
As with the morning star formation, the second candle can also be a doji, making tis a bearish doji star pattern.
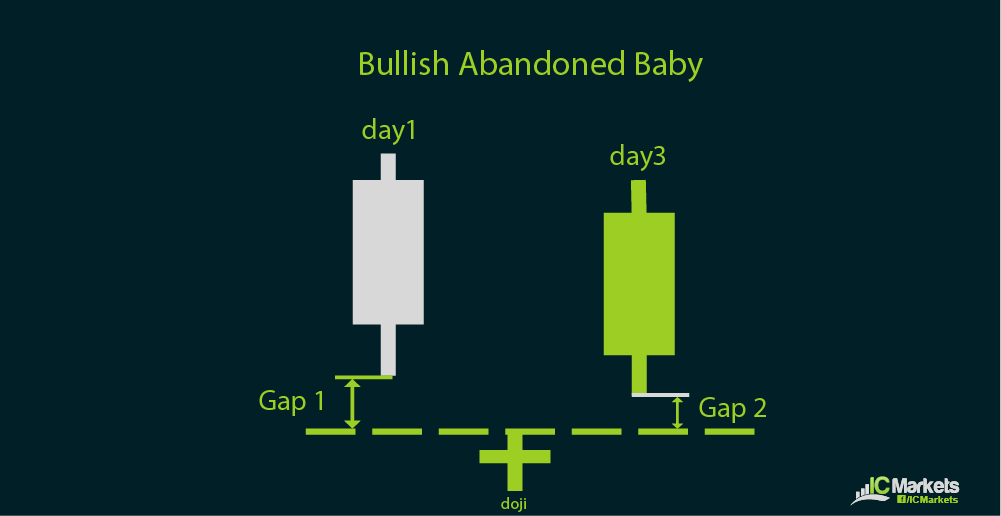
A triple candlestick pattern similar to the morning and evening star patterns is the abandoned baby. This is also suggestive of a price reversal.
A bullish abandoned baby pattern has a first candle that is bearish, followed by a gap down and a doji for the next candle. This is then succeeded by a bullish candle gapping higher and closing inside the first candle.
Conversely, a bearish abandoned baby pattern has a first candle that is bullish, followed by a gap higher and a doji for the second candle. This is then followed by a bearish candle gapping lower and closing inside the first candle.

