Lower timeframe confirmation: is something we use a lot in our analysis. All it simply means is waiting for price action on the lower timeframes to confirm direction within a higher timeframe area. For example, some traders will not enter a trade until an opposing supply or demand area has been consumed, while on the other hand, another group of traders may only need a trendline break to confirm direction. As you can probably imagine, the list is endless. We, however, personally prefer to use the two methods of confirmation mentioned above in our trading.
EURUSD:
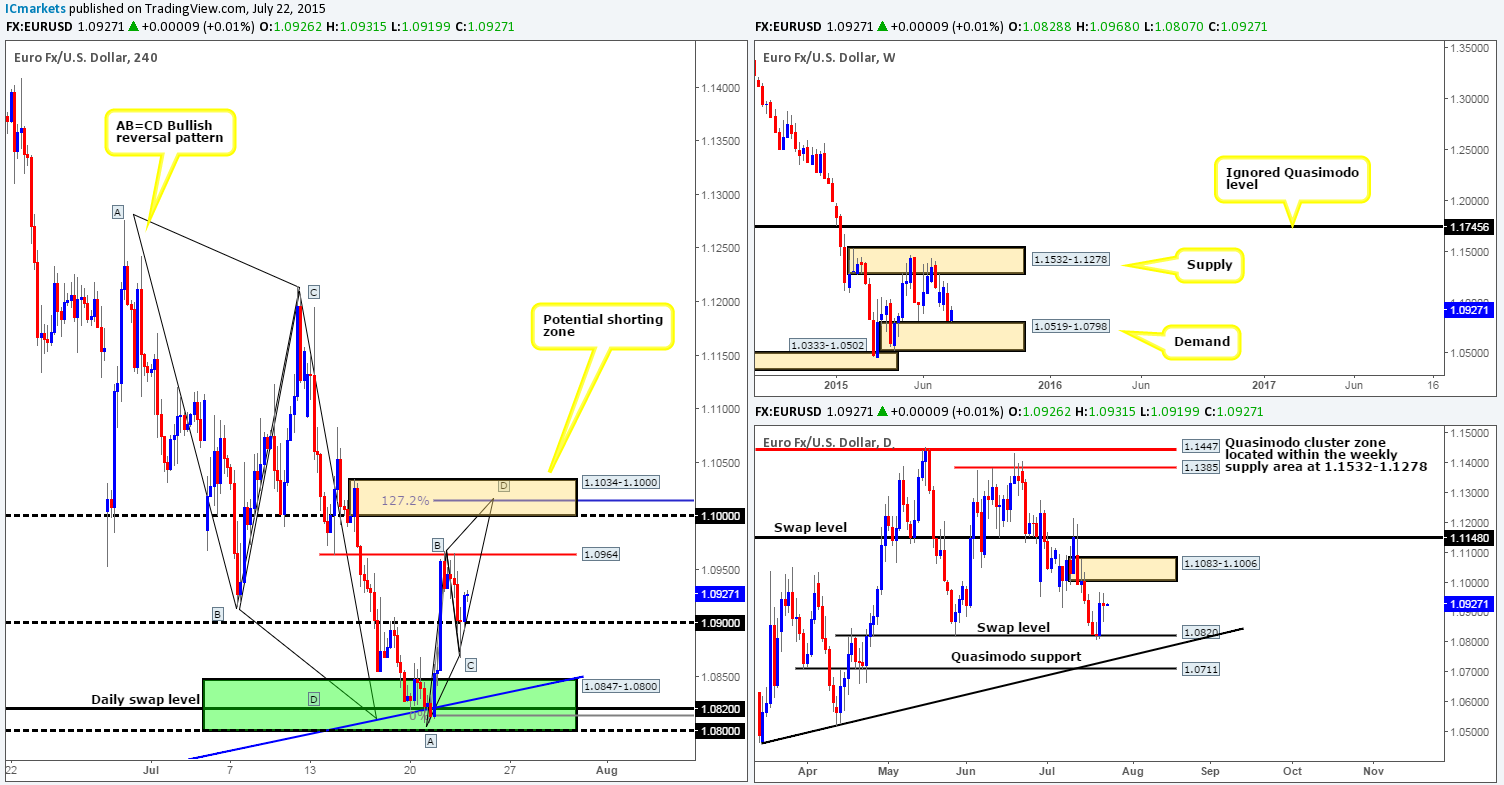
After price rubbed shoulders with the 4hr swap level at 1.0854 yesterday, we can see that price eventually declined in value down to 1.0900, which did, after a deep fake lower mind you, act as support. For those who read our previous report (http://www.icmarkets.com/blog/wednesday-22nd-july-daily-technical-outlook-and-review/) on the Euro, you may recall that we took a long position from 1.0858 early on Tuesday just above the heavily confluent 4hr Harmonic AB=CD zone at 1.0847-1.0800, with the hope of price reaching the 1.1000 region – our take-profit area.
With the Euro now seen driving higher from 1.0900, we do believe price has formed a C-leg to a minor 4hr Harmonic AB=CD bearish pattern which completes nicely around the 1.272% Fibonacci extension, just above 1.1000. This – coupled with the fact that price is still trading from higher timeframe demand at the moment (Weekly demand1.0519-1.0798/Daily swap level 1.0820) could see the D-leg to this pattern form later on today, thus hitting out take-profit level at 1.0995.
Once, or indeed if price does connect with 1.1000 area, this could also make for a nice base to sell at, since it is not only a humongous round number that converges with a 4hr Harmonic AB=CD completion point (mentioned above), it also has the backing of a 4hr supply zone seen at 1.1034-1.1000 positioned within a daily supply area coming in at 1.1083-1.1006. Waiting for lower timeframe selling confirmation at this sell zone is advised here, however, since we must remember that by shorting here, we’re potentially going up against weekly buyers from demand at 1.0519-1.0798.
Levels to watch/live orders:
- Buys: 1.0858 [Live] (Stop loss: Breakeven).
- Sells: 1.1000 region [Tentative – confirmation required] (Stop loss: dependent on where one confirms this level).
GBP/USD:
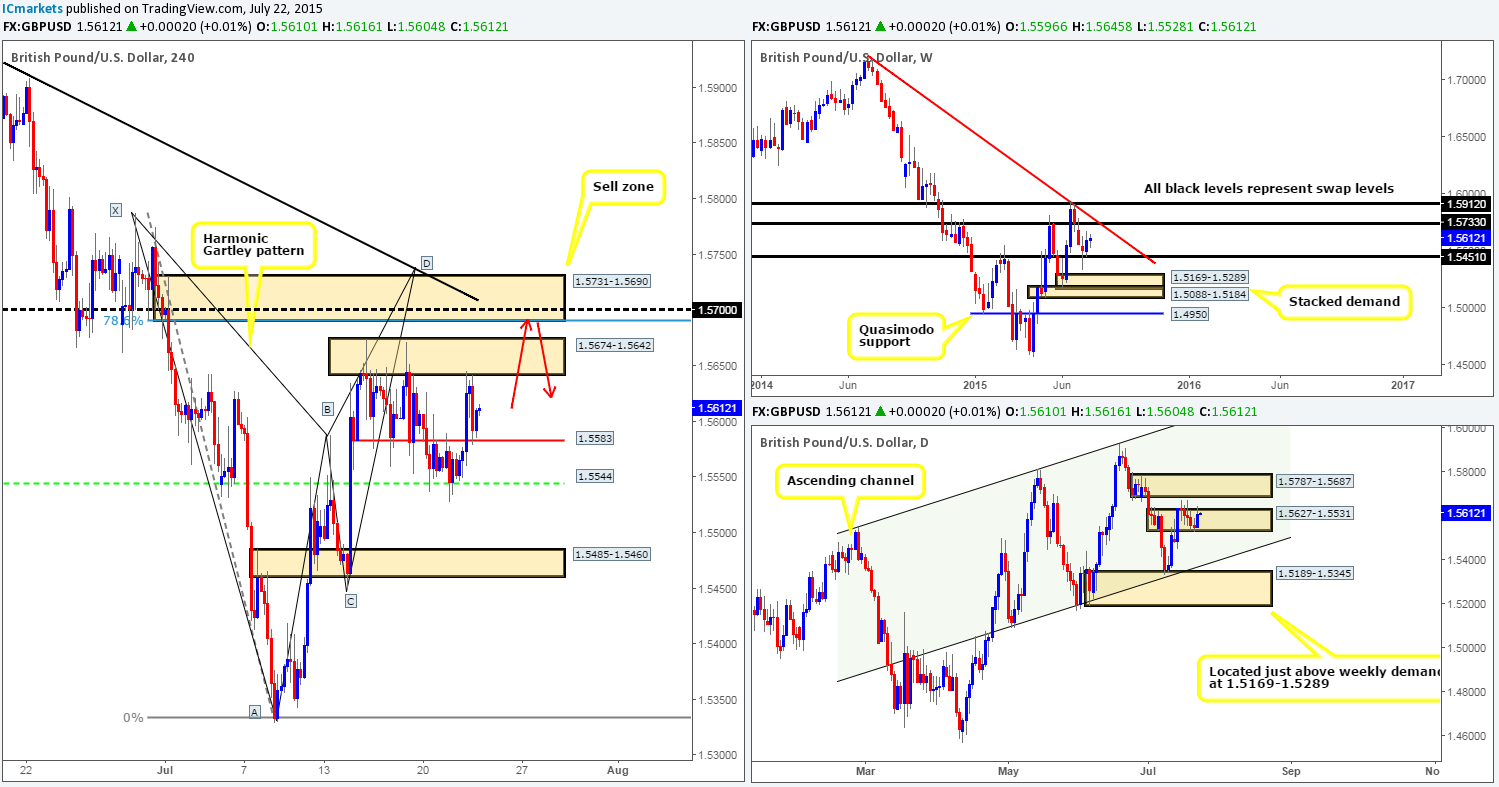
The GBP/USD pair, as you can see, did eventually rally from the 4hr swap level at 1.5544 during yesterday’s sessions. This saw price connect up with the 4hr supply zone at 1.5674-1.5642 and send the market lower to test a minor 4hr swap level at 1.5583 into the close 1.5610.
With there being little resistance seen on the weekly timeframe at the moment until we reach the weekly swap level 1.5733, and the fact that price has reacted positively from a daily supply (now acting demand in our opinion) area at 1.5627-1.5531, we believe that price is going to fake above the 4hr supply at 1.5674-1.5642 today and shake hands with a 4hr supply coming in at 1.5731-1.5690.
For those who read our previous report on Cable, you may recall that we already have a pending sell order set just below 1.5731-1.5690 at 1.5686 in an attempt to catch this fakeout, since it converges beautifully with the following structures:
- Bearish Harmonic Gartley pattern which completes just above this 4hr supply area at 1.5739.
- The weekly swap level at 1.5733 is seen two pips above this area of 4hr supply.
- Positioned nicely within daily supply coming in at 1.5787-1.5687.
- Round number resistance seen at 1.5700.
- 4hr downtrend line from the high 1.5928.
Levels to watch/ live orders:
- Buys: Flat (Stop loss: N/A).
- Sells: 1.5686 (Stop loss: 1.5778).
AUD/USD:
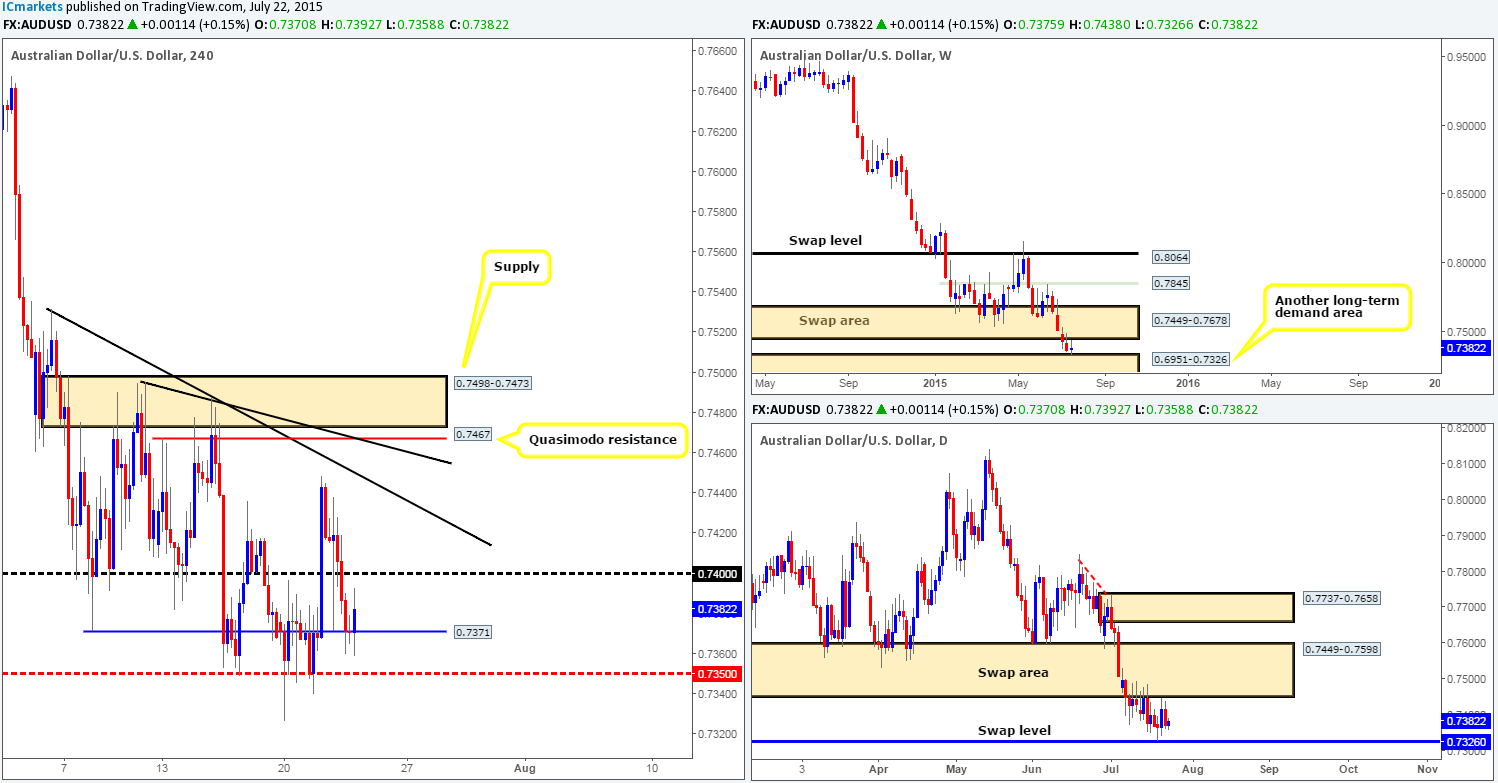
Recent events on the Aussie pair show things took a turn for the worst yesterday as the market cascaded lower, taking out bids sitting at the round number 0.7400, which ended with price action drawing support from a 4hr swap level at 0.7371 going into the close 0.7370.
Focusing only on the daily timeframe (as the weekly timeframe shows pretty much the same as the daily) at this time, we can see price is currently sandwiched in between a daily swap area at 0.7449-0.7598 and a daily swap level coming in at 0.7326. This, as you can probably imagine, makes it very difficult to judge medium/long-term direction.
As such, until the higher timeframes produce clearer price action, we’re going to stick with just playing for short confirmed intraday bounces off of areas of interest on the 4hr timeframe:
Buy zones come in at:
- 0.7371. This 4hr swap level has around 25 pips of room to move north until it reaches resistance at 0.7400.
- If price should break above 0.7400, then one could potentially look to trade any retest seen, targeting the 4hr downtrend line extended from the high 0.7531.
Sell zones come in at:
- The round number 0.7400. Similar to above, there is only around 25 or pips of room below this number until price reaches support at 0.7371.
- One could, if 0.7400 is broken, look to trade any bounce seen off of the aforementioned 4hr downtrend line back down to 0.7400.
Levels to watch/ live orders:
- Buys: 0.7371 [Tentative – confirmation required] (Stop loss: dependent on where one confirms this level).
- Sells: 0.7400 [Tentative – confirmation required] (Stop loss: dependent on where one confirms this level).
USD/JPY:
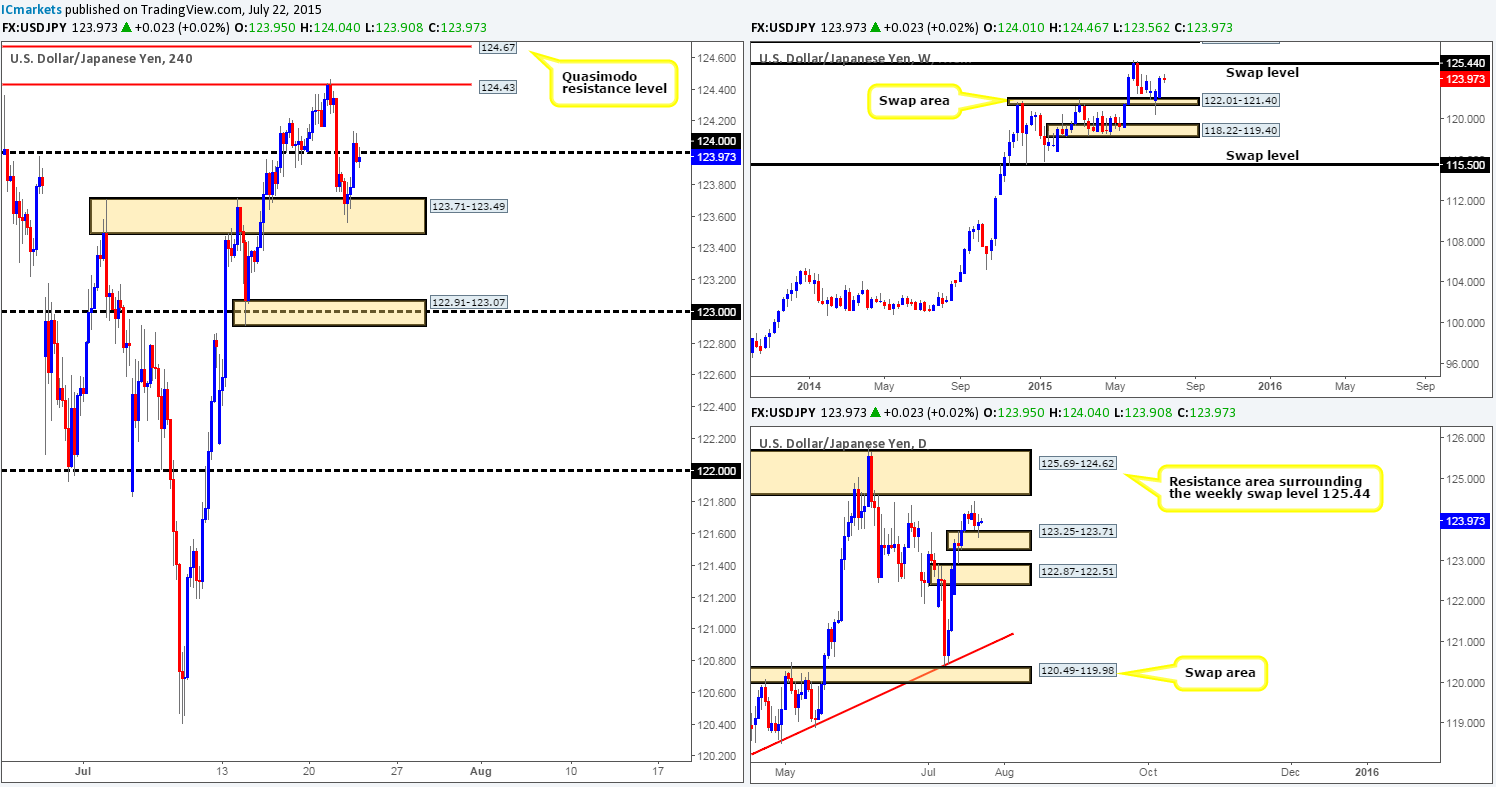
During the course of yesterday’s sessions, price was bid from the 4hr swap area coming in at 123.71-123.49, which as a result pushed the Dollar up to the 124.00 region. Selling from 124.00 today is considered a risky trade in our book due to where price is currently positioned on the higher timeframes. The weekly chart shows price is ‘resistance free’ so to speak up to a weekly swap level coming in at 125.44, while the daily timeframe shows price is currently trading off of a small daily demand area at 123.25-123.71, which also shows room for price to move higher until we reach a daily resistance area at 125.69-124.62.
Therefore, with the above points taken into consideration, we’re expecting to see 124.00 consumed today, which will likely spring board price higher to connect with either the 4hr resistance level 124.43, or the 4hr Quasimodo resistance level at 124.67. In our opinion, both of these levels are viable shorting zones, but seeing as it is nearly impossible to tell which one will see the sweetest reaction, we’re going to wait for the lower timeframes to confirm strength is present before considering a short trade in this market.
Levels to watch/ live orders:
- Buys: Flat (Stop loss: N/A).
- Sells: 124.43 [Tentative – confirmation required] (Stop loss: dependent on where one confirms this level) 124.67 [Tentative – confirmation required] (Stop loss: dependent on where one confirms this level).
USD/CAD:
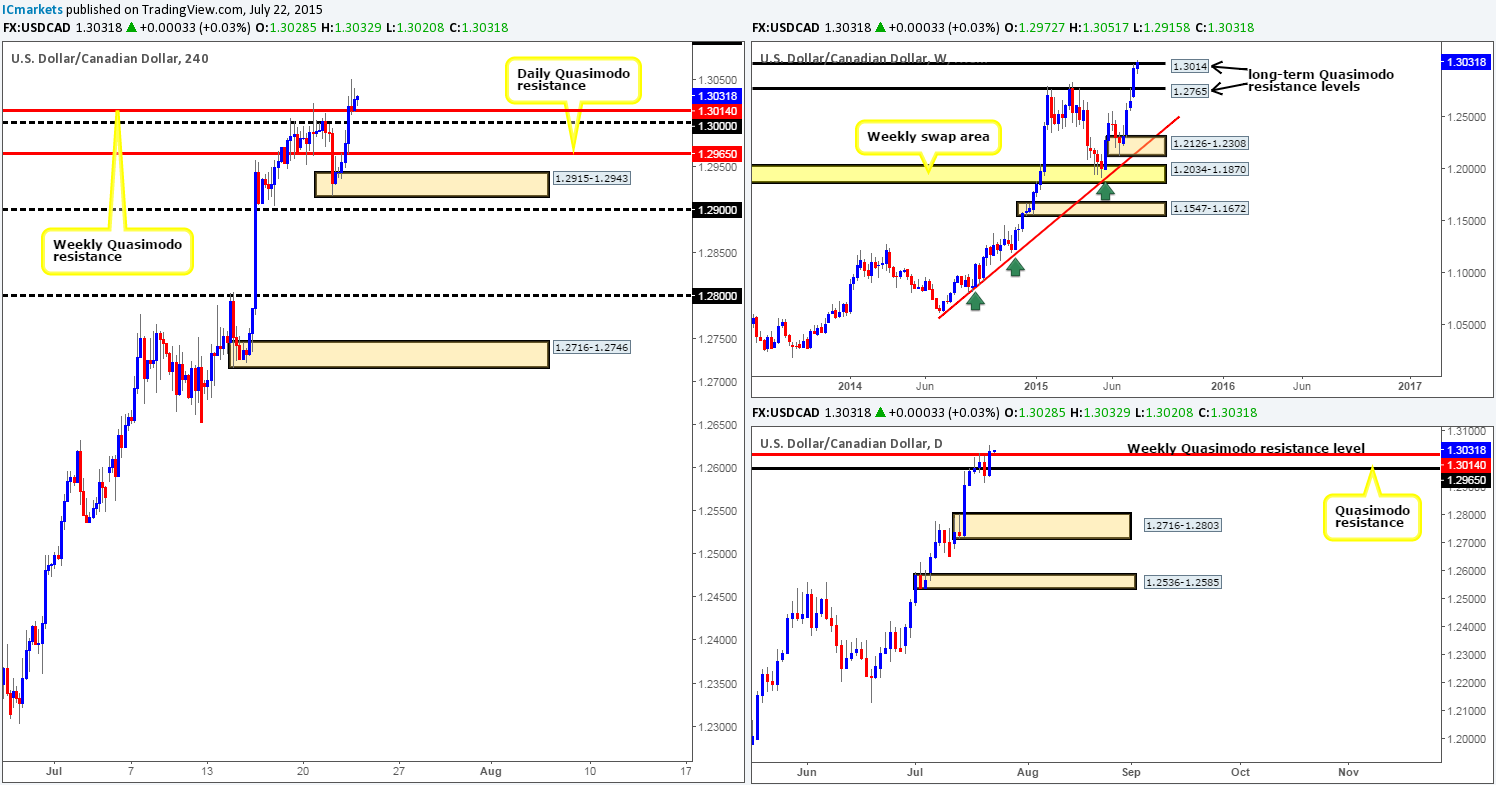
Beginning from the weekly timeframe this morning, we can see that price is currently trading above the long-term weekly Quasimodo resistance level at 1.3014. However, it is very difficult (especially from this timeframe alone) to discount this level until the weekly candle closes. Moving down to its younger brother, the daily timeframe, price action shows a clean close above the aforementioned long-term weekly Quasimodo resistance level was printed yesterday, which if holds as support could be an early indication that this level is failing.
From the 4hr timeframe, however, the recent surge of buying took out the big-figure number 1.3000 and, like we mentioned above, is currently seen sitting on top of the aforementioned long-term weekly Quasimodo resistance level.
Nonetheless, however much we want to enter long on this pair right now, our team has come to a general consensus that waiting to see if price retests the weekly Quasimodo level as support on the daily timeframe today is the best, and most likely safest way to approach this market before considering longs.
Levels to watch/ live orders:
- Buys: Flat (Stop loss: N/A).
- Sells: Flat (Stop loss: N/A).
USD/CHF:
The USD/CHF pair saw a conservative wave of bids come into this market yesterday from within the confines of a 4hr demand area at 0.9556-0.9575. This move obliterated 0.9600 and connected with a 4hr supply area seen just above it at 0.9647-0.9628, which ended up sending price back below 0.9600 into the daily close 0.9597.
The higher timeframe picture, however, has not seen much change. We still believe the weekly timeframe may be setting itself up for a retest of the recently broken weekly swap level at 0.9512 (as per the red arrows). Meanwhile, on the daily timeframe, the buyers and sellers are still seen slugging it out within a daily swap (demand) area coming in at 0.9597-0.9502.
Despite this recent surge of buying on this pair, we cannot help but feel that price is heading lower to test the 0.9500 region, since this would not only see price retest the weekly swap level 0.9512, but also drive prices very deep within the aforementioned daily swap (demand) area – a beautiful place to be looking to get long. This, of course, would mean that the 4hr demand at 0.9556-0.9575 and the 4hr ignored Quasimodo level would be consumed.
Therefore, similar to yesterday’s approach, unless price manages to reach the 0.9500 region today, we intend to take the safest position of them all, flat.
Levels to watch/ live orders:
- Buys: 0.9500 [Tentative – confirmation required] (Stop loss: dependent on where one confirms this level).
- Sells: Flat (Stop loss: N/A).
DOW 30:
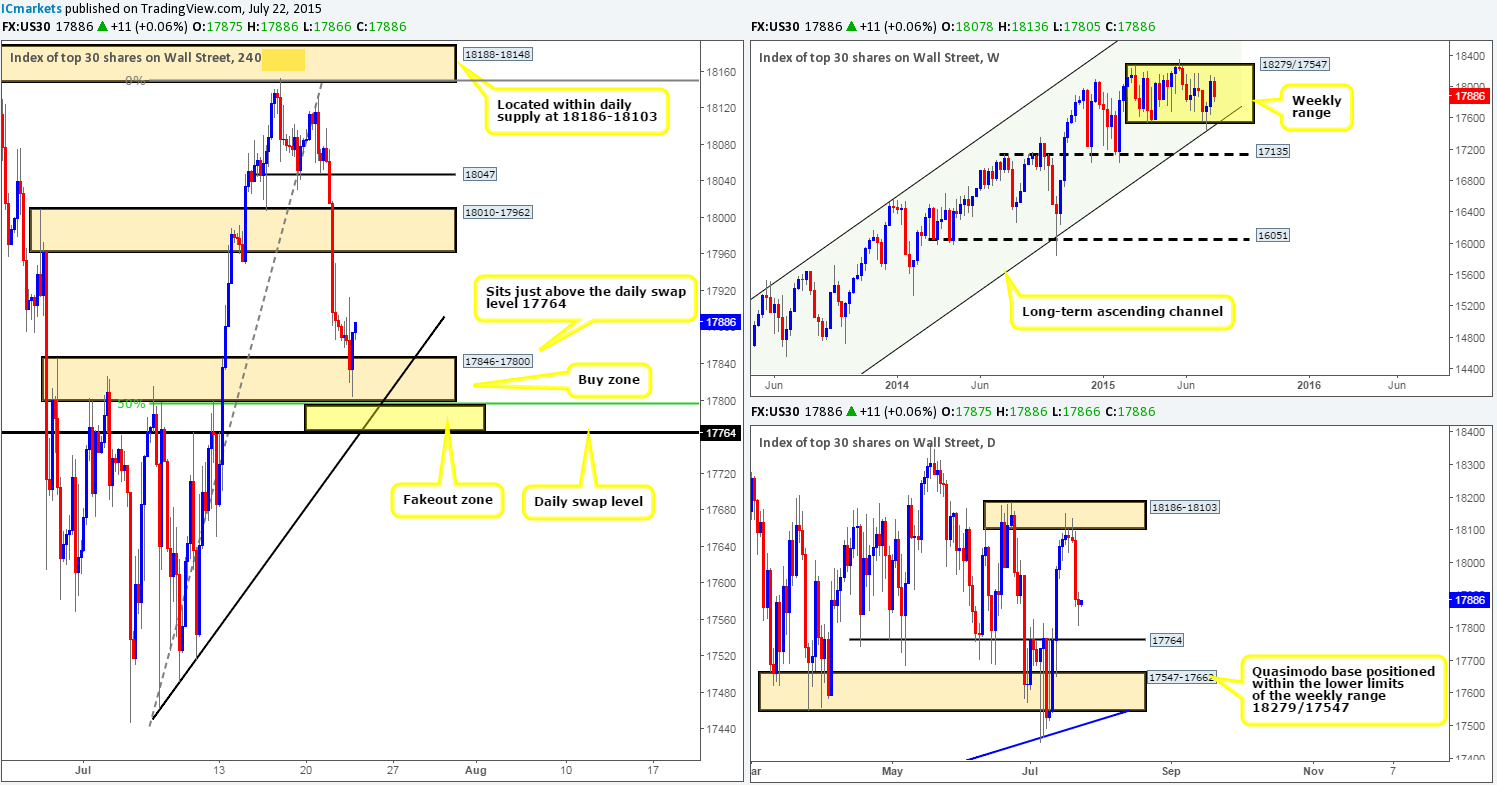
Going into the U.S. session yesterday, we can see price action came alive. A heavy current of offers come into the market from the 17900 region, forcing price to cross paths with a 4hr swap area at 17846-17800. For those who read our previous report regarding this index, you may recall that we highlighted this 4hr swap zone as an area of interest for potential buying opportunities, which, as you can see, has indeed held as support.
Unfortunately, we were unable to find suitable lower timeframe confirmation within this zone – well done to anyone who did! However, all is not lost we feel. Should price retrace today to retest this current 4hr swap area, we’d most certainly consider entering long into this market if the lower timeframes are also agreeable. With regards to targets from this area, we’d be looking at riding this train all the way up to 17950, just below the 4hr swap zone coming in at 18010-17962. The reason for requiring lower timeframe confirmation at this area is simply because price could fake lower to connect with the daily swap level seen just below it at 17764.
Levels to watch/ live orders:
- Buys: 17846-17800 [Tentative – confirmation required] (Stop loss: 17753).
- Sells: Flat (Stop loss: N/A).
XAU/USD: (Gold)
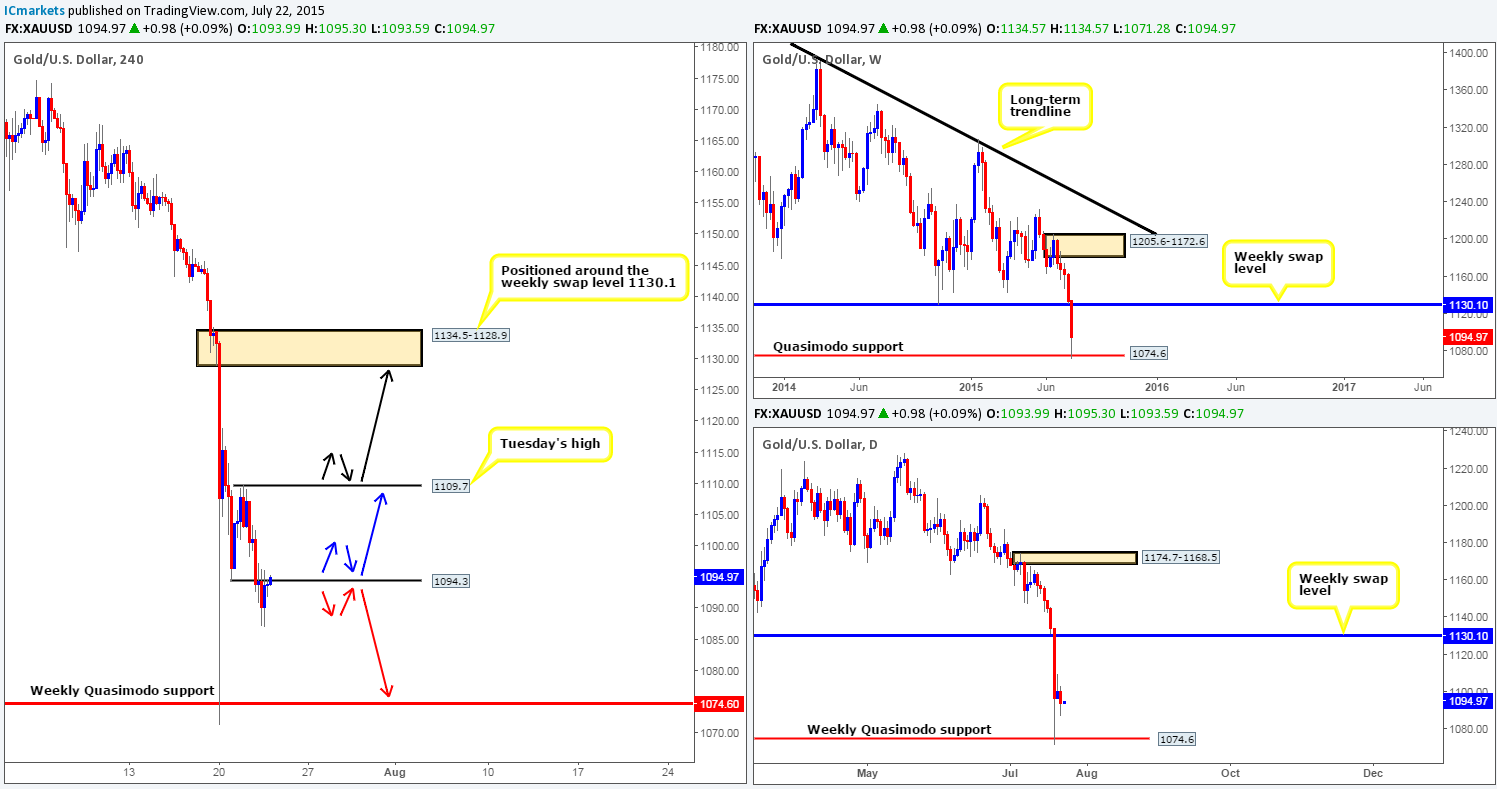
Going into the early hours of yesterday’s sessions the Gold market declined in value, consequently closing below the low 1094.3, which as you can see held as resistance throughout both the London and New York sessions. Assuming that offers remain strong at the underside of 1094.3 today, we may see price drop south to reconnect up with the weekly Quasimodo support level sitting below current prices at 1074.6 (as per the red arrows). To trade this move from here, however, we would need to see lower timeframe sellers coming into the market (selling tails/singular pin-bar candle etc…)
Conversely, in the event that price bounces back above 1094.3, this could open the gates for price to challenge Tuesday’s high 1109.7 (this would make for a nice intraday take-profit target). For us to be given the ‘green light’ to enter long here, nonetheless, we’d require a retest of 1094.3 as support (as per the blue arrows) along with corresponding lower timeframe confirmation.
Levels to watch/ live orders:
- Buys: Watch for 1094.3 to be consumed, and then look to buy any retest seen with lower timeframe confirmation.
- Sells: 1094.3 [Tentative – confirmation required] (Stop loss: dependent on where one confirms this level).

