A note on lower timeframe confirming price action…
Waiting for lower timeframe confirmation is our main tool to confirm strength within higher timeframe zones, and has really been the key to our trading success. It takes a little time to understand the subtle nuances, however, as each trade is never the same, but once you master the rhythm so to speak, you will be saved from countless unnecessary losing trades. The following is a list of what we look for:
- A break/retest of supply or demand dependent on which way you’re trading.
- A trendline break/retest.
- Buying/selling tails – essentially we look for a cluster of very obvious spikes off of lower timeframe support and resistance levels within the higher timeframe zone.
- Candlestick patterns. We tend to only stick with pin bars and engulfing bars as these have proven to be the most effective.
EUR/USD:
Well, where do we start on the EUR/USD? The first thing that sprung to mind upon opening the charts this morning was simply, ‘wow’. Fundamentally, we believe the reason behind yesterday’s rally comes from the recent decline in the stock market. With the ECB’s interest rates close to zero, stock market investors have been buying up Euros to invest in U.S. dollars. Consequent to what some analysts are now labeling ‘Black Monday’, investors are now selling U.S dollars to pay back the Euros they bought, thus pushing the EUR currency higher.
From a technical standpoint, however, the weekly timeframe shows that the market surged close to a whopping 300 pips yesterday! This saw the EUR currency breach weekly supply at 1.1532-1.1278, and just miss connecting with an ignored weekly Quasimodo level at 1.1745. Moving down to the daily timeframe, we can see that this recent buying has broken above two major daily Quasimodo resistance levels (1.1385/1.1447), which hit and extended past a daily supply zone at 1.1678-1.1606.
Slipping down to the 4hr timeframe, it is clear to see that price has, dare we say it, begun to stabilize at the psychological resistance 1.1700, and is now trading below 1.1600 as we write. With regards to trading this pair today, we feel that this market will likely correct itself. However, is this feeling strong enough to place a trade? The short answer to this is, no. It is very difficult to say how this market will react today to yesterday’s volatility. That is why, especially in times of economic uncertainty, it pays to act in your own best interest by staying on the sidelines!
Levels to watch/live orders:
- Buys: Flat (Stop loss: N/A).
- Sells: Flat (Stop loss: N/A).
GBP/USD:
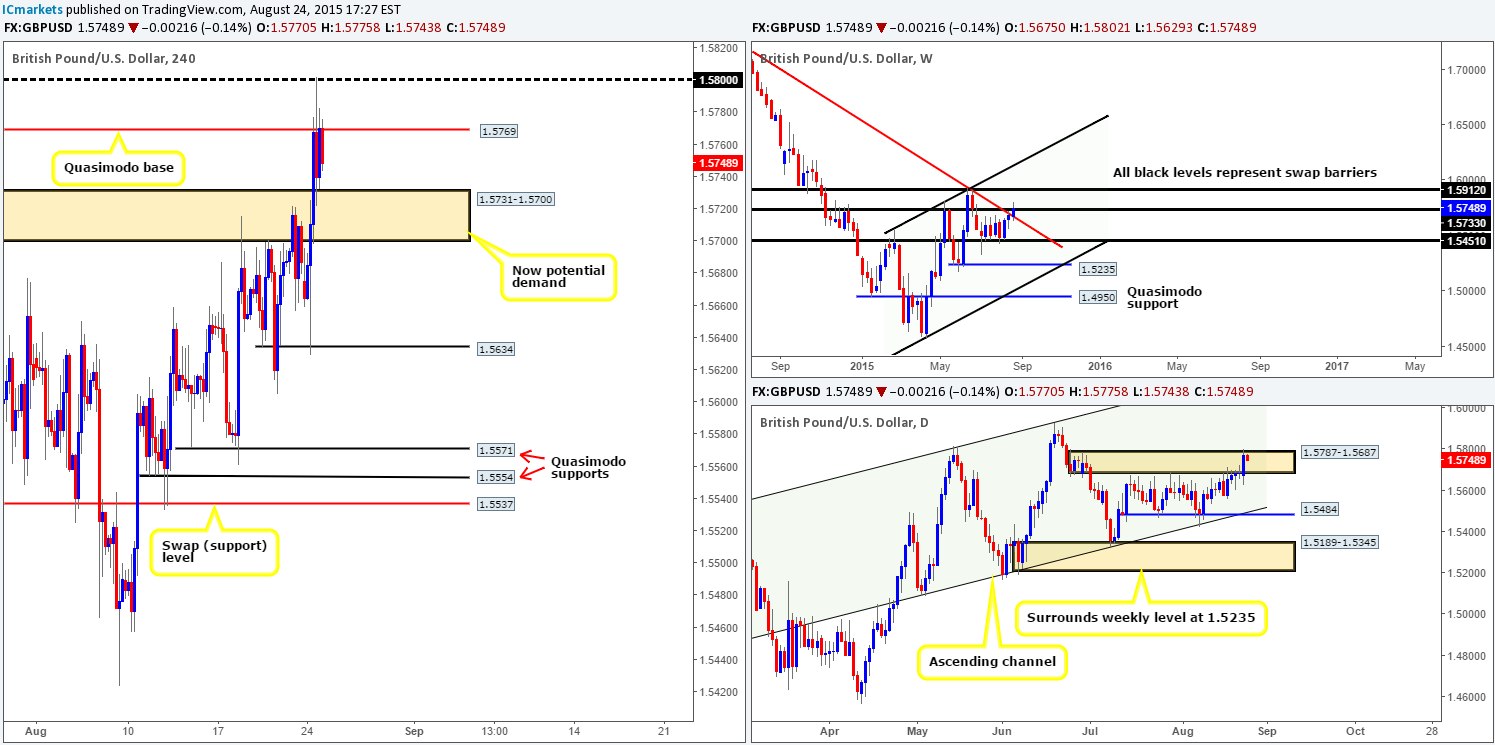
During the early hours of European trade, price beautifully spiked lower to fill bids sitting around the 4hr Quasimodo support level at 1.5634, which saw Cable rally a little over 170 pips. Consequent to this, the 4hr supply at 1.5731-1.5700 was taken out, resulting in price hitting and extending through a 4hr Quasimodo resistance level at 1.5769 to as high as 1.5802 on the day.
Considering that the GBP is currently lodged below 1.5769, where do we stand in the bigger picture? Well, the weekly timeframe shows price is trading firmly above both the weekly downtrend line (1.7166) and also the weekly swap (resistance) level at 1.5733. The daily timeframe on the other hand, shows price faked above daily supply at 1.5787-1.5687 yesterday, and is currently being held lower within this structure.
Taking into account the points made above, and the fact that 1.5769 shows very little room to move above or below this number (1.5800/1.5731-1.5700), we’ve decided to remain flat for the time being.
Levels to watch/ live orders:
- Buys: Flat (Stop loss: N/A).
- Sells: Flat (Stop loss: N/A).
AUD/USD:
Well, looking at the AUD/USD market this morning certainly woke us up! No need for a morning coffee here!
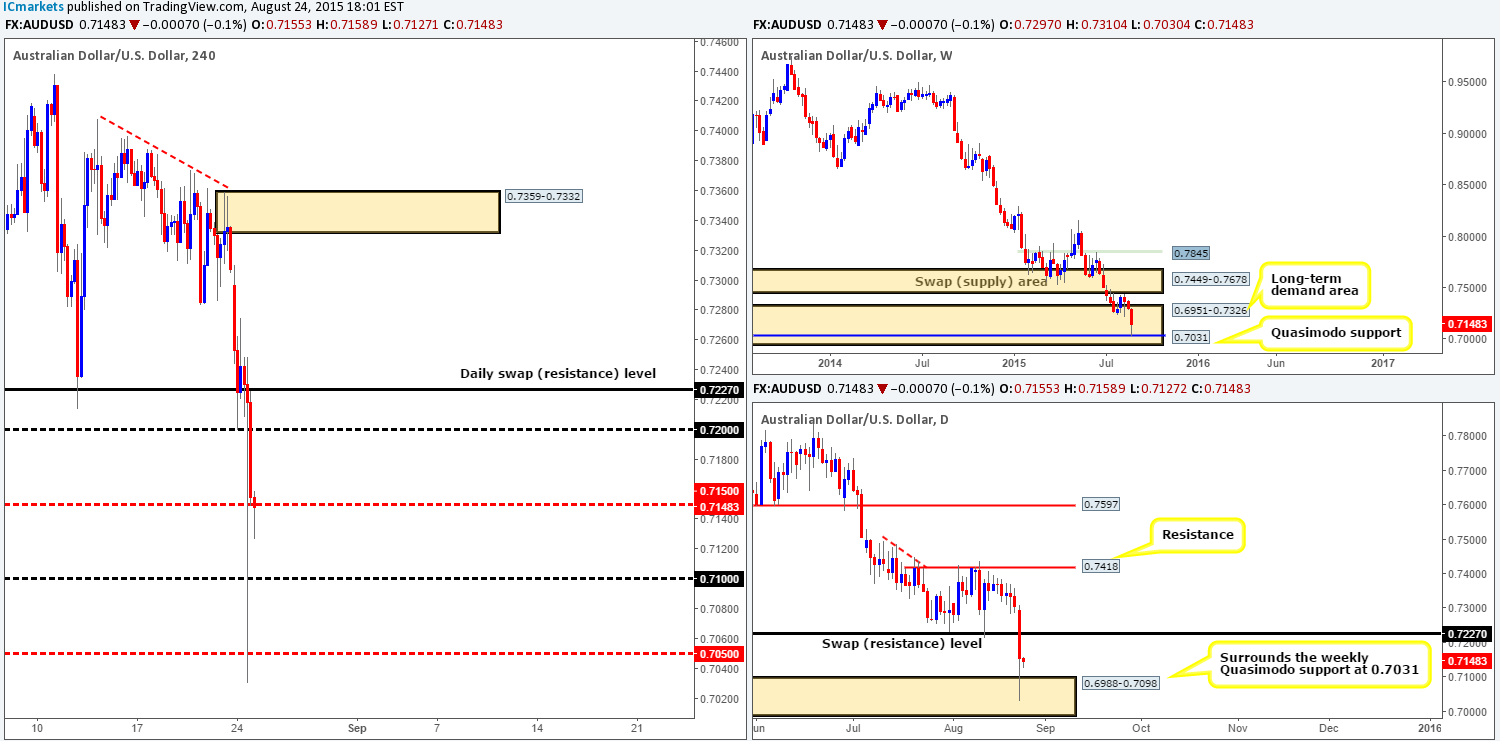
The AUD/USD, as most are already aware, is extremely sensitive to the recent Chinese turmoil, and with commodities still under pressure, this only added weight to the sell-off seen during yesterday’s trade.
Using a top-down approach this morning, the weekly chart shows price drove 280 pips into a long-term weekly demand zone at 0.6951-0.7326 yesterday. Nevertheless, at the time of writing, price seems to have drawn support from a weekly Quasimodo hurdle coming in at 0.7031. Turning our attention to the daily timeframe, reveals price rebounded from a daily demand zone coming in at 0.6988-0.7098, which surrounds the aforementioned weekly Quasimodo support. Upside targets from this demand barrier comes in around a daily swap (resistance) level at 0.7227.
As we move onto the 4hr timeframe, we can see just how volatile the AUD/USD market was yesterday! Supportive pressure came in around the mid-level hurdle 0.7050, which rebounded price a whopping 190 pips in one 4hr candle! As of now though, current action is seen teasing the mid-level number 0.7150. Granted, there could be a potential intraday trade around this barrier today, as there is clear space for price to move above to 0.7200 and below to 0.7100. However, due to the present uncertainty surrounding China at the moment, our team is reluctant to risk trading this market today. As such like the Euro and Cable, remaining flat is, in our opinion, the best path to take.
Levels to watch/ live orders:
- Buys: Flat (Stop loss: N/A).
- Sells: Flat (Stop loss: N/A).
USD/JPY:
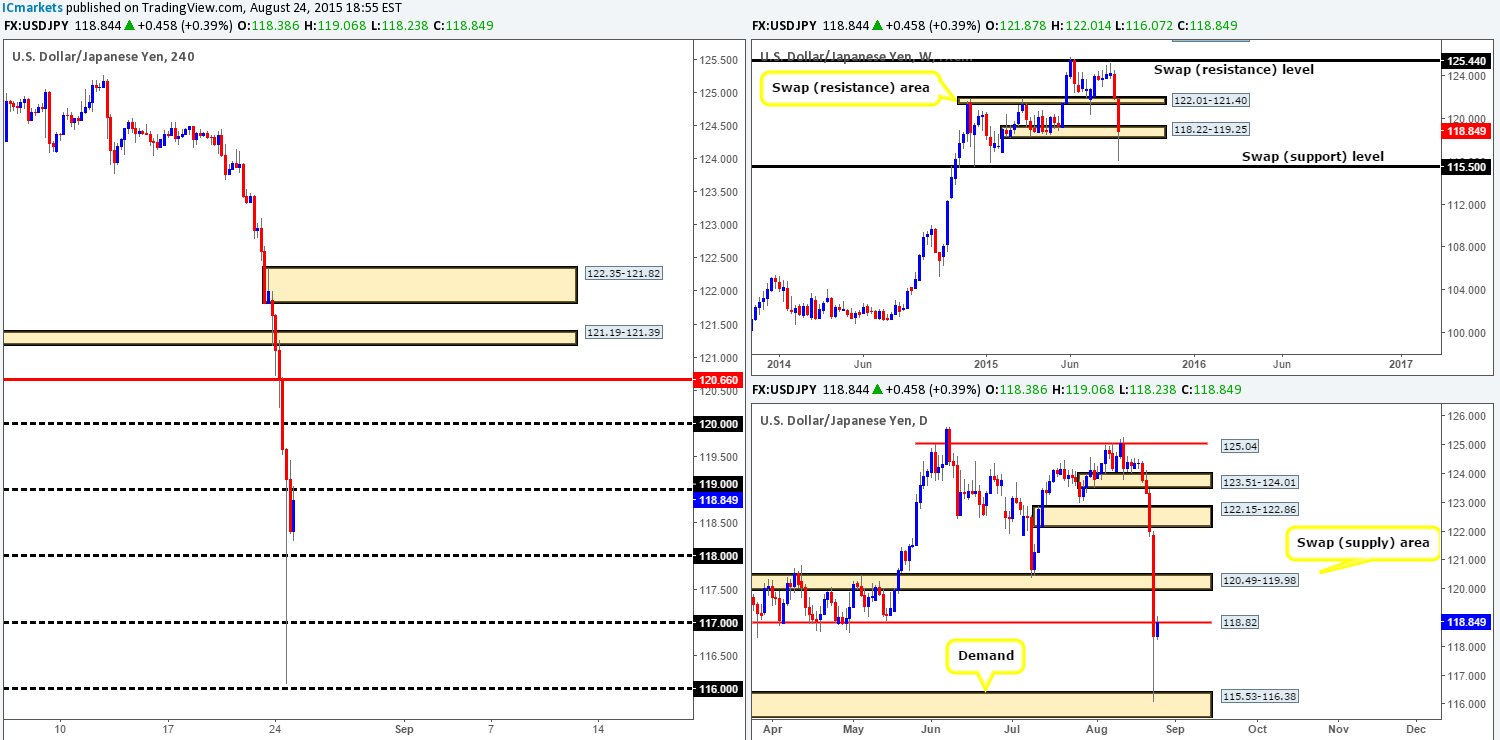
Looking at the USD/JPY charts this morning, one can see why economists are calling yesterday’s market action ‘Black Monday’. This pair was the biggest mover of the day, dropping a humongous 580 pips reaching lows of 116.07 into the close. Yesterday’s free-fall saw price take out the weekly swap (support) area at 122.01-121.40, and violently stab below a weekly support area at 118.22-119.25, which is currently holding firm. On the daily chart, we can see price consumed 120.49-119.98 and 118.82, resulting in price aggressively attacking and rebounding from a daily demand zone coming in at 115.53-116.38. As a result, price is now nibbling at offers sitting around the recently broken daily support (now acting resistance) at 118.82.
As we move down to 4hr timeframe, It is clear to see price is now trading above the 119.00, which could, if price closed above this number, pave the way north for a potential buy trade today up to 120.00. We would certainly advise caution trading this market today since it is very difficult to tell how price will respond to yesterday’s crash. Personally, we are going to remain on the sidelines today, but if you really must trade this market, one could look for a confirmed retest at 119.00 as support. Failing this, if price rejects 119.00, one could look to short with lower timeframe confirmation down to 118.00.
Be careful out there today traders!
Levels to watch/ live orders:
- Buys: Flat (Stop loss: N/A).
- Sells: Flat (Stop loss: N/A).
USD/CAD:
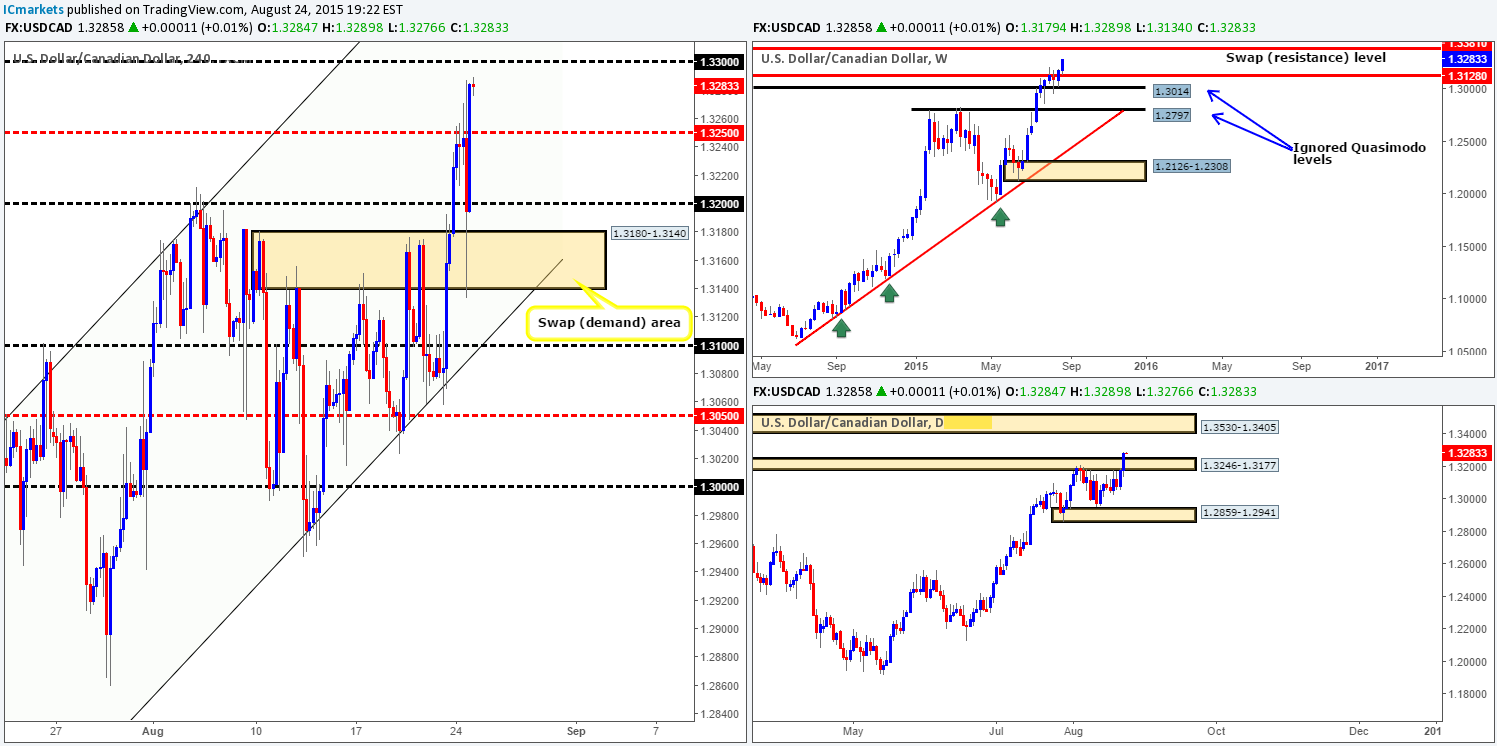
Early on in U.S. trade, we saw price drive lower to collect unfilled bids sitting within the 4hr swap (demand) area at 1.3180-1.3140. This, as you can see, spring boarded the USD/CAD north, taking out the mid-level hurdle 1.3250 reaching highs of 1.3289 on the day.
With little resistance seen on the weekly chart until the weekly swap (resistance) level at 1.3381, it is very likely price will continue to advance. Furthermore, the daily timeframe shows price has recently closed above daily supply at 1.3246-1.3177, which, as far as we can see, has cleared the path up to another daily supply at 1.3530-1.3405. Therefore, our team favors longs over shorts at this time.
In light of the above, our approach to this market today will be centered on 1.3300. Once, or indeed if, price closes above this number, we’ll then watch for price to retest this barrier as support. Should this occur and 1.3300 holds firm, lower timeframe buying confirmation will need to be seen for us to pull the trigger here. We have only one target in mind for this trade, and that falls in at 1.3381 – the weekly swap (resistance) level mentioned above.
Levels to watch/ live orders:
- Buys: Watch for 1.3300 to be consumed and then look to trade any retest seen at this number (confirmation required).
- Sells: Flat (Stop loss: N/A).
USD/CHF
Like most of the major markets yesterday, the USD/CHF also saw its fair share of losses.
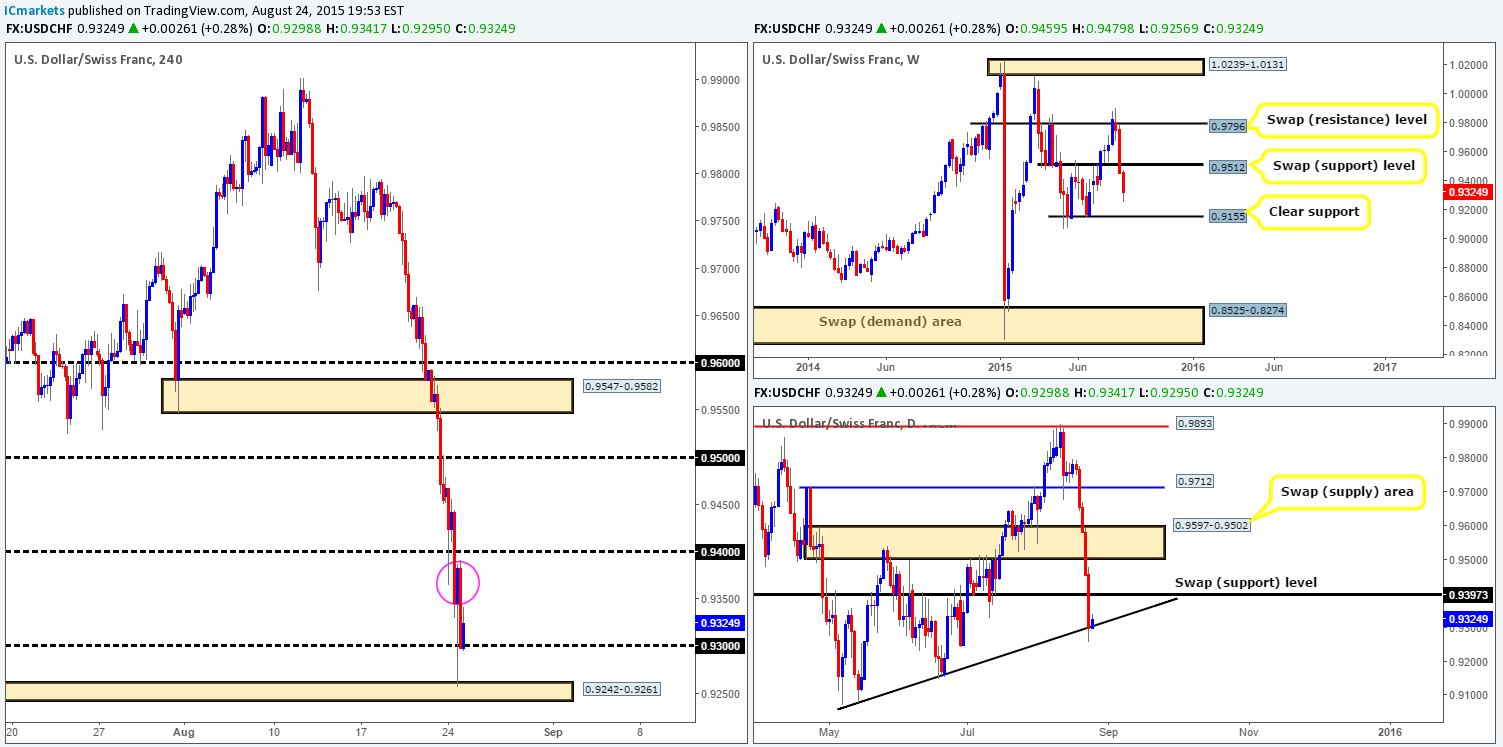
Shortly after the pair opened at 0.9459 a heavy round of offers hit the line, consequently dragging price down to test the 0.9400 psychological support, which held for a few hours before giving way. Once 0.9400 was out of the picture, price was free to drive lower and fake below 0.9300 to connect with bids around 4hr demand coming in at 0.9242-0.9261.
In that price is now showing support off of 0.9300, where do we stand in the bigger picture? The weekly chart shows price is still potentially free to continue lower this week down to clear weekly support at 0.9155. Meanwhile, on the daily chart, the market is currently holding above a daily ascending trendline taken from the low 0.9077.
Therefore, with all of the above taken into consideration, here is what we have noted so far…
Trading long from 0.9300 could be a possibility today with lower timeframe confirmation. However, one must take into account that there is potentially problematic supply looming overhead around the mid-level number 0.9350 (pink circle). This – coupled with the fact that there’s still room to move lower on the weekly timeframe, remaining on the sidelines may be the best position to take today.
Levels to watch/ live orders:
- Buys: Flat (Stop loss: N/A).
- Sells: Flat (Stop loss: N/A).
DOW 30:
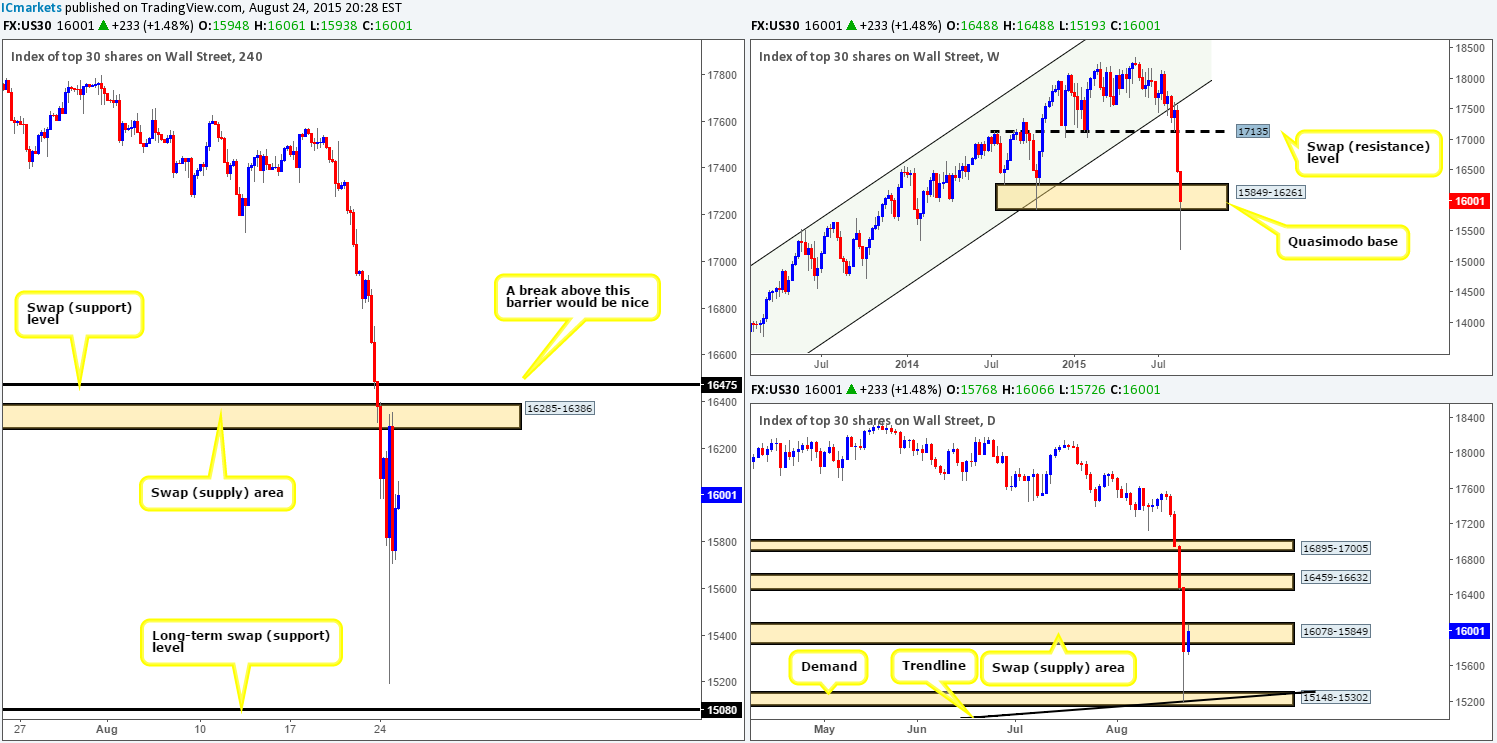
Beginning with the weekly timeframe this morning, we can see the DOW 30 dropped a whopping 955 points in one day’s trade yesterday (figure includes pre/after-market hours). In consequence, price violently stabbed below a weekly Quasimodo base coming in at 15849-16261. Despite this vicious attack, nonetheless, bids are currently holding firm within this area. Daily action on the other hand, reveals price rebounded from a small, yet clearly resilient daily demand zone at 15148-15302, which converges nicely with a daily ascending trendline extended from the low 11997. However, at the time of writing, price is seen chewing on offers sitting within a daily swap (supply) area at 16078-15849.
Looking at the 4hr chart shows that yesterday’s free-fall reached lows of 15193 on the day, and just missed connecting with a long-term 4hr swap (support) level at 15080. Purely from a technical standpoint, our team has no interest in buying this market until 16475 is taken out as there is clear space above this barrier for price to move. With regards to shorting this market, one could look to sell at the 4hr swap (supply) area at 16285-16386 today. Nevertheless, we are hesitant to support a short trade from here due to that large buying tail currently painting on the weekly timeframe.
Due to uncertainty still surrounding the financial markets at this time, we are going to play on the side of caution here and remain flat during today’s trade.
Levels to watch/ live orders:
- Buys: Flat (Stop loss: N/A).
- Sells: Flat (Stop loss: N/A).
XAU/USD: (Gold)
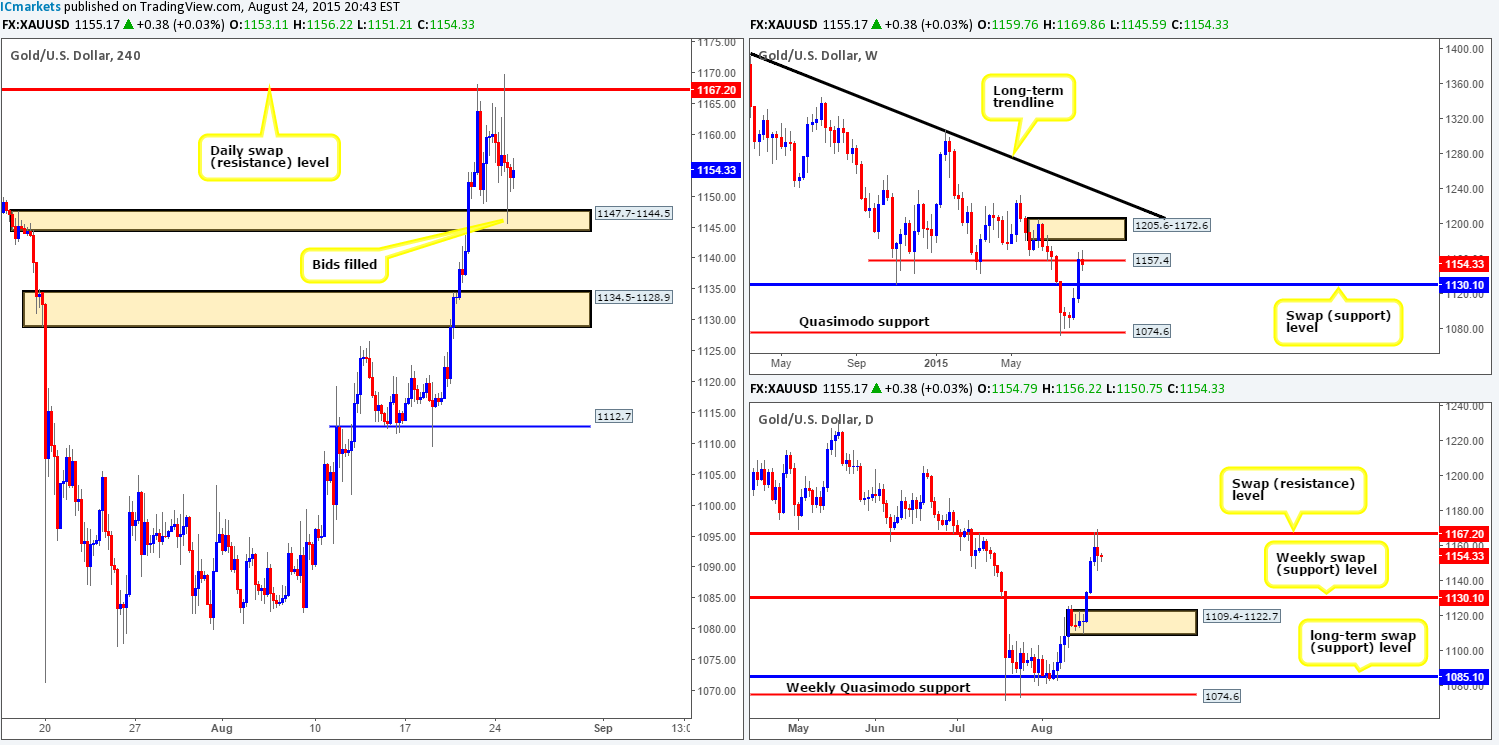
The Gold market was relatively quiet during yesterday’s chaos. The 4hr timeframe shows price currently being held lower by a daily swap (resistance) level coming in at 1167.2. This is also backed by the weekly swap (resistance) level seen just below it at 1157.4.
Therefore, should we be looking to sell this market today? Not so fast cowboy! See how on the 4hr timeframe, price recently stabbed into bids sitting within a 4hr swap (demand) area at 1147.7-1144.5. This zone could potentially be troublesome if this region remains well-bid. For this reason, we are going to wait and see how price action reacts today to these consumed bids. Should we see a bearish engulfing candle form, then we’re likely heading lower and it could be a good time to place a small position short in the market. Should we manage to sell this market today, we’ll be looking to close out the position going into the 4hr swap (demand) area at 1134.5-1128.9, which if you look across to the weekly chart, you’ll see it surrounds the aforementioned weekly swap (support) level.
Levels to watch/ live orders:
- Buys: Flat (Stop loss: N/A).
- Sells: Watch how price reacts from bids filled at 1147.7-1144.5. Should price action resemble selling strength, look to short down to 1134.5-1128.9.


