A note on lower timeframe confirming price action…
Waiting for lower timeframe confirmation is our main tool to confirm strength within higher timeframe zones, and has really been the key to our trading success. It takes a little time to understand the subtle nuances, however, as each trade is never the same, but once you master the rhythm so to speak, you will be saved from countless unnecessary losing trades. The following is a list of what we look for:
- A break/retest of supply or demand dependent on which way you’re trading.
- A trendline break/retest.
- Buying/selling tails – essentially we look for a cluster of very obvious spikes off of lower timeframe support and resistance levels within the higher timeframe zone.
- Candlestick patterns. We tend to only stick with pin bars and engulfing bars as these have proven to be the most effective.
EUR/USD:
During the course of yesterday’s sessions, the EUR continued to advance from Friday’s initial rebound off of psychological support 1.1200. Price managed to reach highs of 1.1289 before aggressively plummeting over 100 pips lower, surpassing 1.1200 and printing a session low of 1.1173 on the day.
Consequent to this recent movement, a beautifully symmetrical AB=CD bullish pattern completed at the above said session low, which, at the time of writing, seems to be holding price higher. However, before we all go looking to buy into this pattern, how do things stand on the higher timeframes? Over on the weekly chart, we can see that, for five weeks now, this market been consolidating around the underside of supply at 1.1532-1.1278. Meanwhile, down on the daily timeframe, price formed yet another selling wick off the back of supply drawn from 1.1329-1.1269, which, as far as we see, shows room to continue selling off towards support at 1.1122.
Given the above, we would not feel comfortable buying into the 4hr AB=CD pattern today, since price will likely struggle at the underside of 1.1200. That being the case, as we mentioned in Monday’s report, we still have our eye on NFP-formed demand sitting at 1.1150-1.1163 for a possible intraday bounce. Moreover, directly below this buy zone sits another demand at 1.1105-1.1131, which is certainly an interesting area since it ties in nicely with daily support mentioned above at 1.1122.
As a final point, seeing as price is loitering around weekly supply (see above), and we’re effectively looking to buy this market, lower timeframe confirmation is paramount at each of the two zones voiced above.
Levels to watch/live orders:
- Buys: 1.1150-1.1163 [Tentative- confirmation required] (Stop loss: dependent on where one confirms this area) 1.1105-1.1131 [Tentative- confirmation required] (Stop loss: dependent on where one confirms this area).
- Sells: Flat (Stop loss: N/A).
GBP/USD:
Early on during yesterday’s trade a steady ripple of bids floated into this market, consequently pushing price above psychological resistance 1.5200, and once again into the jaws of supply at 1.5259-1.5228. It was at this point, the opening of the London session, did we see the mood turn sour. Cable fell sharply from here, taking out 1.5200 and driving lower into a small demand formed from Friday’s NFP at 1.5126-1.5142.
In regard to price trading at a particularly promising demand zone right now, where does our team stand in the bigger picture? The weekly chart shows candle action once again flirting with the top-side of channel support (1.4564), while the daily chart shows the buyers and sellers continue to battle for position between demand at 1.5088-1.5173 and the underside of a channel support-turned resistance (1.5329).
Therefore, our team has come to a general consensus that buying from the 4hr current demand is still possible thanks to weekly structure. Nonetheless, caution is warranted trading blindly (entering at market here without lower timeframe confirmation). Reason being comes from not only the bearish pressure being seen on the daily timeframe, but also the possibility that price could fake back down to retest the origin of the recent up move – the swap support at 1.5114.
Levels to watch/ live orders:
- Buys: 1.5126-1.5142 [Tentative – confirmation required] (Stop loss: dependent on where one confirms this area) 1.5114 region [Tentative – confirmation required] (Stop loss: dependent on where one confirms this level).
- Sells: Flat (Stop loss: N/A).
AUD/USD:
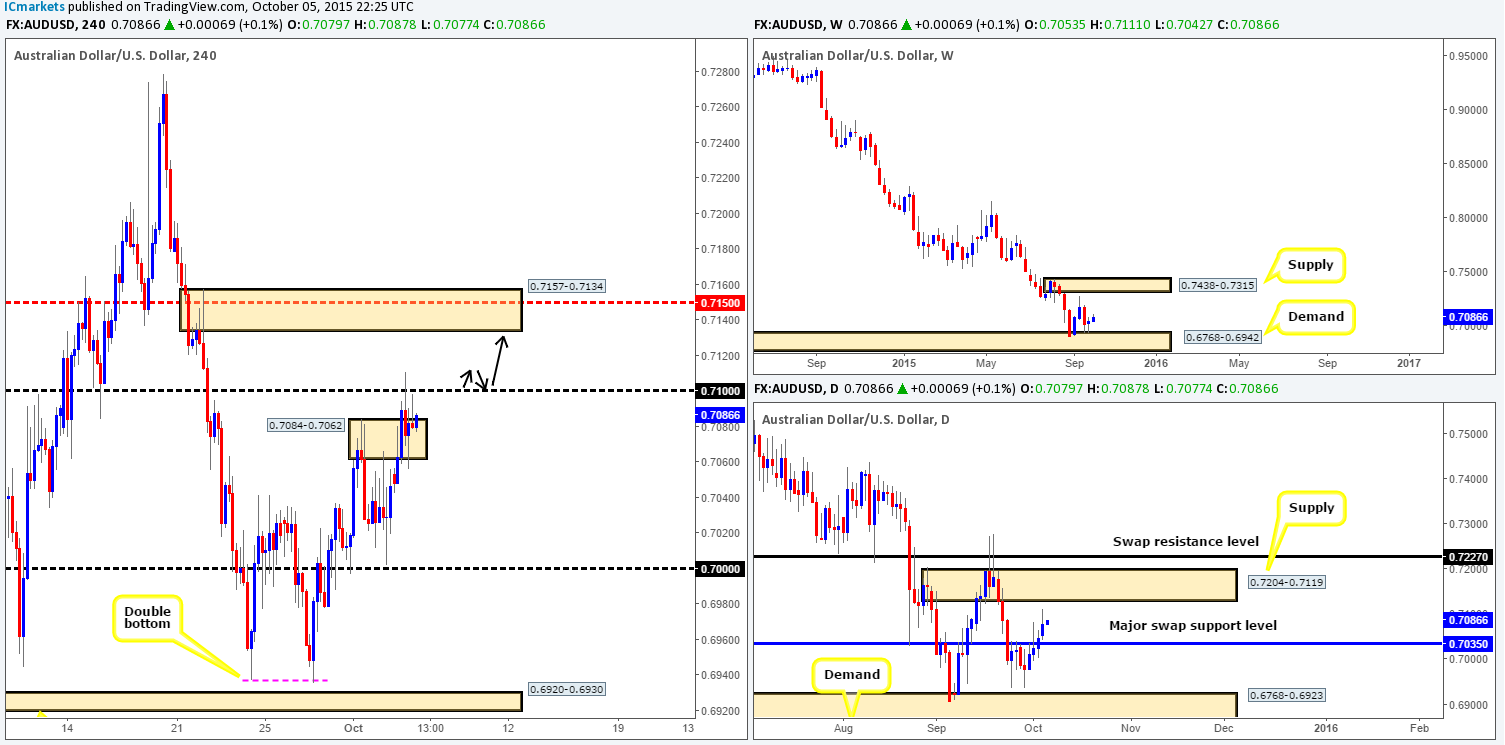
Not too long after Sunday’s open 0.7035, a conservative wave of bids flowed into this market. This, as you can see, forced price above supply at 0.7084-0.7062 and into the grips of psychological resistance 0.7100, which held the trade lower for the remainder of yesterday’s sessions.
In that the bears seem to be controlling the overall flow on the 4hr scale, the higher timeframe picture, however, tells a slightly different story. Weekly demand at 0.6768-0.6942 continues to hold firm despite being entrenched within a humongous downtrend at present. Down on the daily timeframe, nonetheless, we can see that price respected 0.7035 as support yesterday following Friday’s close above this hurdle. From here, as far as we can see, there’s room to advance up to at least supply at 0.7204-0.7119, followed closely by 0.7227 – a swap resistance level.
With the above taken into account, here is our two pips’ worth on where price is likely heading today…
- 0.7100 will eventually be taken out due to buying pressure from the higher timeframes.
- This could provide traders a long opportunity if a retest (with confirmation) is seen.
- Immediate take-profit area falls in around supply at 0.7157-0.7134. Granted, this is not much room to profit, so should you trade long from 0.7100, a tight stop is required to achieve reasonable risk/reward here.
Levels to watch/ live orders:
- Buys: Watch for offers at 0.7100 to be consumed and then look to enter on any retest seen at this number (confirmation required).
- Sells: Flat (Stop loss: N/A).
USD/JPY:
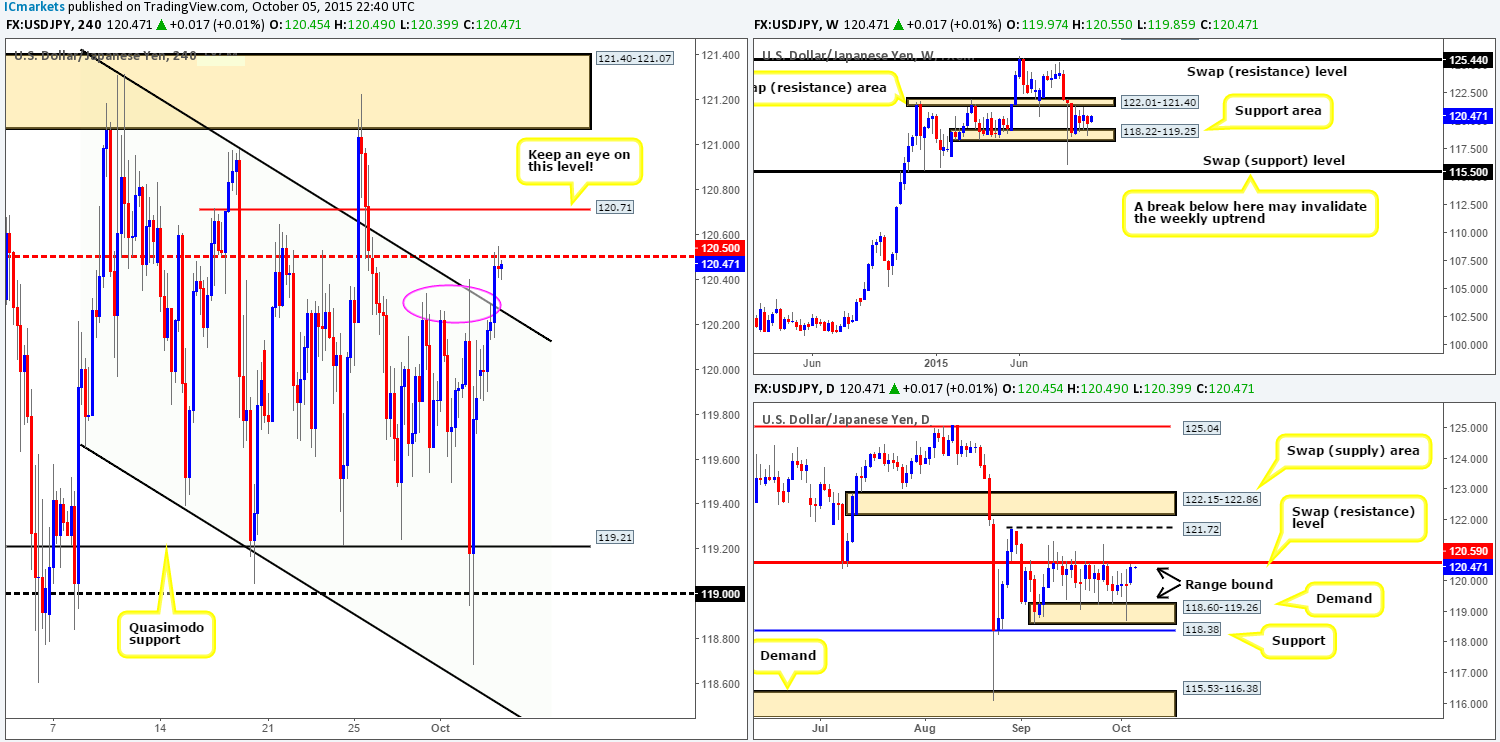
For those who read Monday’s report on this pair: http://www.icmarkets.com/blog/monday-5th-october-weekly-technical-outlook-and-review-australianchinese-bank-holidays-today/ you may recall us mentioning to remain vigilant to the fact that selling from the underside of the 4hr channel resistance (121.31) could fail. In this case, we happened to be right. Yesterday’s action saw price break above this barrier and hit the mid-level number 120.50, which, if you remember, was somewhere we highlighted to look for a bounce lower due to the following:
- 120.50 lines up beautifully with the upper limit of the daily range, 120.59 (see daily chart).
- The highs just below 120.50 circled in pink (120.34/120.40) which line up perfectly with the aforementioned downward channel is somewhere a lot of traders likely got burnt trying to fade. The buy stops above these highs provided a beautiful pool of liquidity for daily sellers to short into!
However, as of yet, our team has yet to place a sell in the market here, since there’s been very little confirming price action seen on the lower timeframes. Should this level give way, all eyes will be on 120.71 for a bounce back down to 120.50 today. It will be interesting to see how this plays out.
Levels to watch/ live orders:
- Buys: Flat (Stop loss: N/A).
- Sells: 120.50 [Tentative – confirmation required] (Stop loss: dependent on where one confirms this level) 120.71 [Tentative – confirmation required] (Stop loss: dependent on where one confirms this level).
USD/CAD:
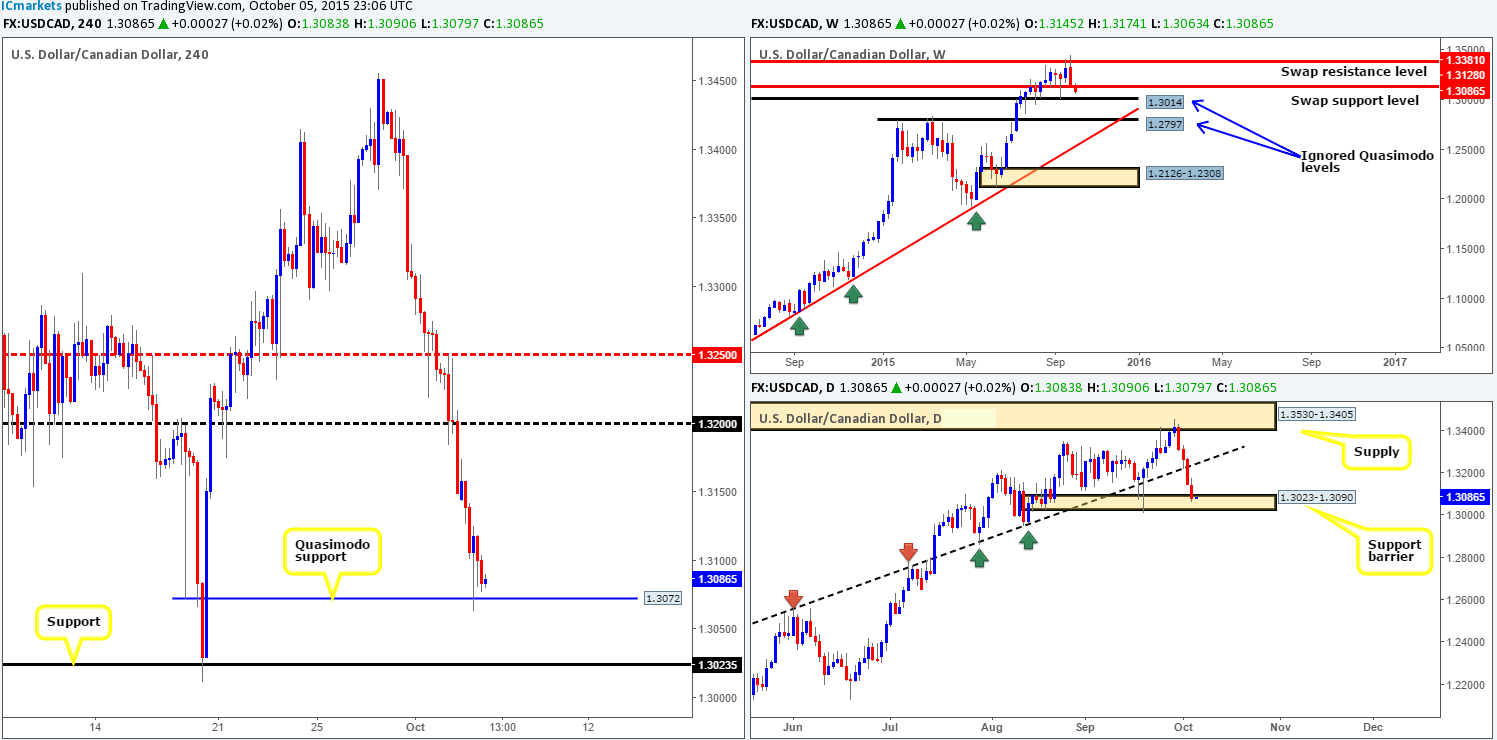
Kicking off this morning’s analysis with a look at the weekly timeframe shows that price has now broken below swap support at 1.3128, and is within shouting distance of hitting an ignored Quasimodo level at 1.3014. At the same time, daily action is seen trading within a support barrier drawn from 1.3023-1.3090.
Turning our attention to the 4hr timeframe reveals that price printed a beautiful-looking pin tail off the back of a Quasimodo support at 1.3072. A lot of traders likely entered at this level, and why not, price is trading within a daily support area (see above)! The only reason we would not consider this a viable buy zone simply comes from seeing room to continue lower on the weekly scale down to the aforementioned ignored Quasimodo level. In addition to this, if you look below on the 4hr scale this weekly level lines up quite close with a very distinct support at 1.3023, which also forms the lower limit of the daily support barrier mentioned above.
Levels to watch/ live orders:
- Buys: 1.3023 [Tentative – confirmation required since a fakeout here is likely] (Stop loss: dependent on where one confirms this level).
- Sells: Flat (Stop loss: N/A).
USD/CHF:
After price shook hands with psychological support 0.9700 yesterday, the Swiss pair eventually saw a sharp increase in value, consequently breaking above mid-level resistance 0.9750 which, at the time of writing, is seen holding as support.
Directly above current price there sits a beautiful-looking supply seen at 0.9794-0.9778, formed as a result of Friday’s NFP sell-off. Not only is there likely some unfilled sell orders still lurking around this zone from the recent drive lower, there is also trendline confluence from the high 0.9815, and weekly convergence from a swap resistance level at 0.9796.
Given the above, does this mean we can place a pending sell order at this supply? Of course you could. However, this is not something we’d be comfortable with. The reasons for why we’d prefer to wait for lower timeframe confirmation here are as follows:
- The aforementioned weekly swap (resistance) level sits just above the current 4hr supply, hence a fakeout is likely.
- In addition, a 4hr supply lurks just above current supply at 0.9815-0.9793, thus resembling stacked supply and like above, indicating a fakeout could take place!
Levels to watch/ live orders:
- Buys: Flat (Stop loss: N/A).
- Sells: 0.9794-0.9778 [Tentative – confirmation required] (Stop loss: dependent on where one confirms this area).
DOW 30:
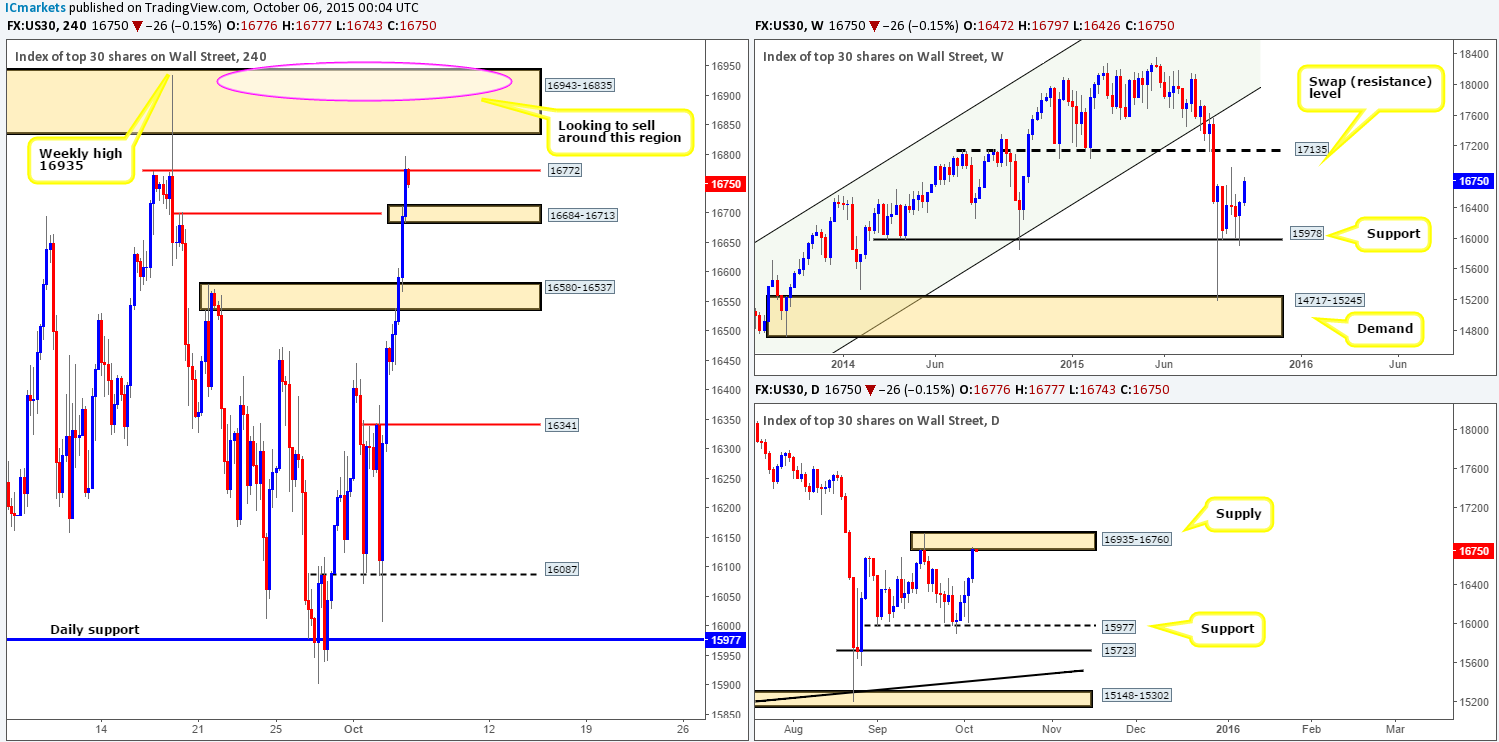
Following yesterday’s open 16472, the DOW soared a little over 300 points during trade. This, as shown on the 4hr chart, took out supply at 16580-16537 with relative ease and headed up to Quasimodo resistance at 16772 by the days end.
Considering that this Quasimodo resistance is positioned at the underside of daily supply at 16935-16760, could we see a sell-off from this level today? From our perspective, a bounce from here down to demand at 16684-16713 is very possible, but is not really something that interests us to be honest. The reason? Well, check out the supply above the Quasimodo at 16943-16835. This zone not only surrounds a weekly high at 16935, but is also located very deep within the aforementioned daily supply. From our experience pro money love to get the best prices and that is usually deep within zones of interest that require small stops. Should price rally today and connect with this 4hr supply area, we’d ideally like to get in short as close as possible to the weekly high, that way we’ll be able to place our stop quite a bit above the 4hr zone, protecting us from any small fakeouts that may take place.
Levels to watch/ live orders:
- Buys: Flat (Stop loss: N/A).
- Sells: 16943-16835 [Tentative – confirmation required] (Stop loss: dependent on where one confirms this area).
XAU/USD: (Gold)
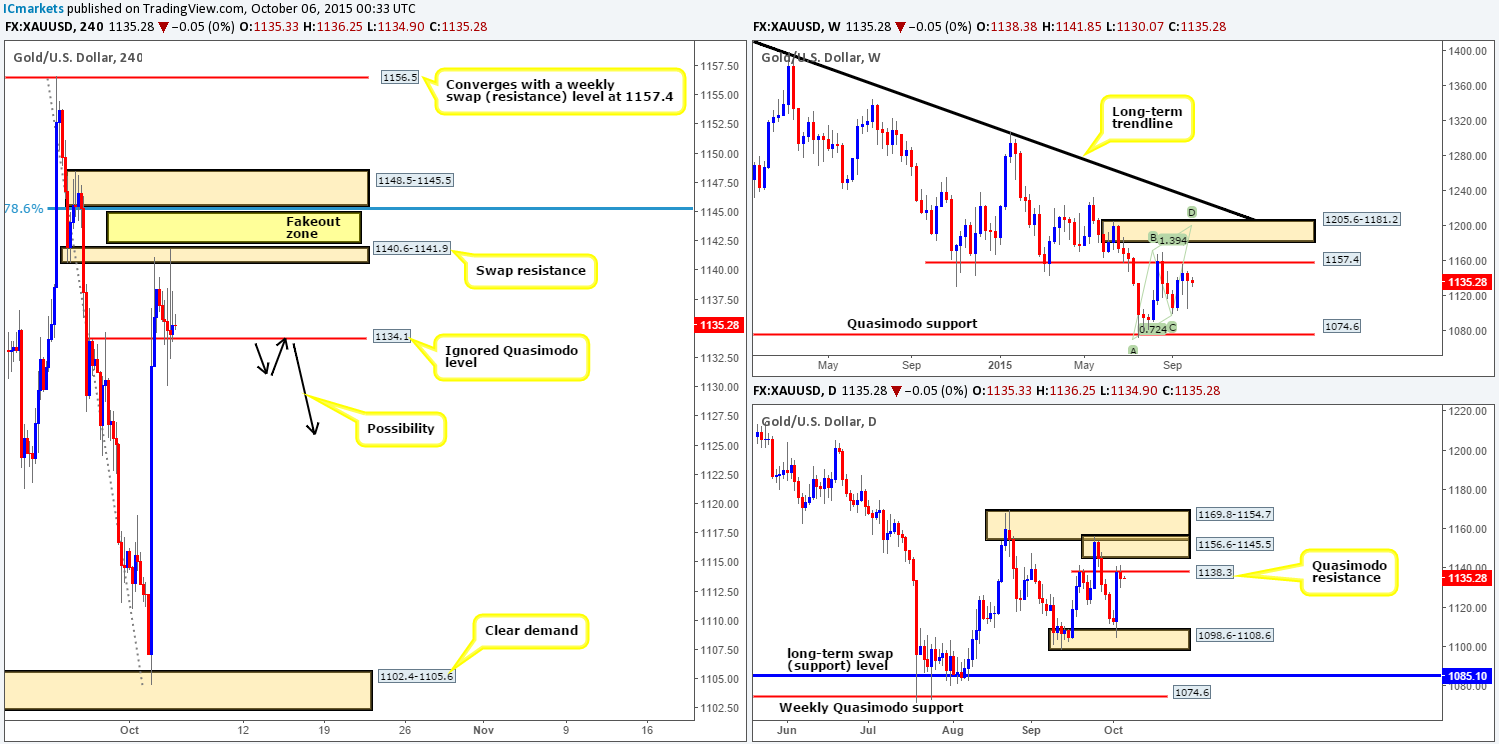
For those who read our previous report on Gold: http://www.icmarkets.com/blog/monday-5th-october-weekly-technical-outlook-and-review-australianchinese-bank-holidays-today/ you may recall us mentioning to keep an eye on both the ignored Quasimodo level at 1134.1 and the swap resistance area at 1140.6-1141.9 for confirmed trades yesterday. As you can see, both zones were indeed respected. However, there was very little confirming action seen from the lower timeframes to permit a trade unfortunately. Well done to any of our readers who managed to lock in some intraday pips from these levels!
Consequent to how deep price cut through the ignored Quasimodo level yesterday and that fact that price is currently holding firm just below a daily Quasimodo barrier at 1138.3 right now, Gold may breakout lower today. Should this come to fruition and price retests the underside of this number as resistance, we may consider shorting this market and trailing our stop behind lower timeframe resistances until stopped out.
In the event that supportive pressure comes into this market on the other hand, we may see price fake above the swap resistance area this time to connect with supply at 1148.5-1145.5. This is certainly a zone of interest to us, since it ties in nicely with the 78.6% Fib resistance and also sits just within daily supply at 1156.6-1145.5.
Levels to watch/ live orders:
- Buys: Flat (Stop loss: N/A).
- Sells: Watch for bids at 1134.1 to be consumed and then look to enter on any retest seen at this number (confirmation required) 1148.5-1145.5 [Tentative – confirmation required] (Stop loss: dependent on where one confirms this area).


