When it comes to using leading indicators, a good way of remembering how they work is to understand that they “oscillate” between two points, hence the name oscillator. This means that they bounce back and forth from point A to point B, which is another way of saying that what goes around comes around.
When an oscillator reaches the overbought zone or gives a sell signal, it eventually goes down along with price action. When an oscillator reaches the oversold zone or gives a buy signal, it then moves up along with price action.
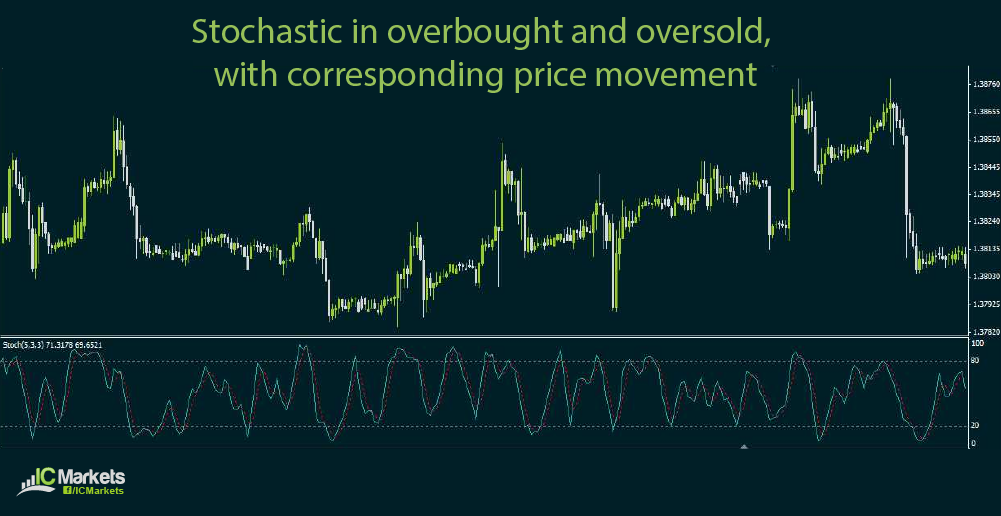
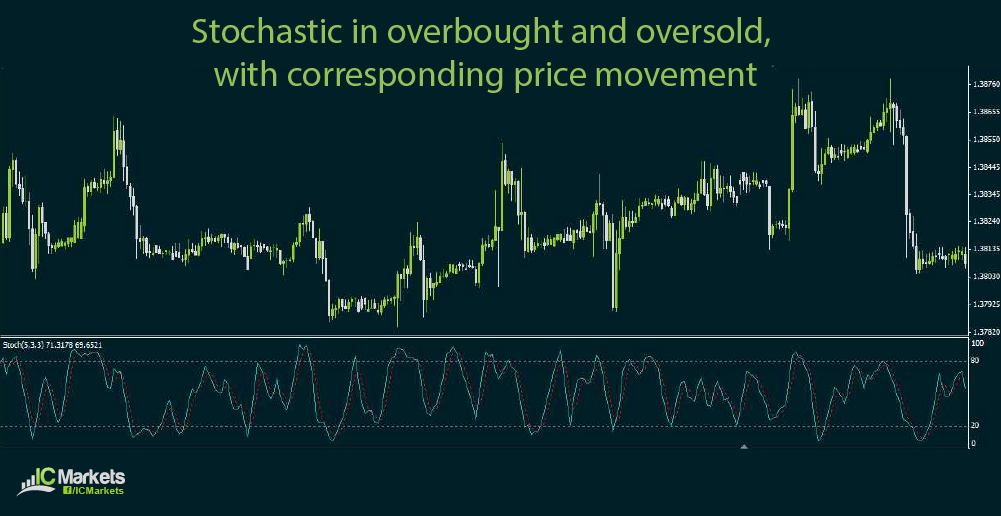
As you can see from the illustration, once stochastic hit the overbought zone above 80.00, price eventually went down along with the oscillator’s movement. When stochastic reached the oversold area below 20.00, price eventually went up along with the oscillator’s movement.
Of course the magnitude of the move still depends on a number of other technical and fundamental factors, and these are not necessarily indicated by the leading indicator’s movement. In other words, the move up can be stronger than the move down or vice versa, depending on the market trend.
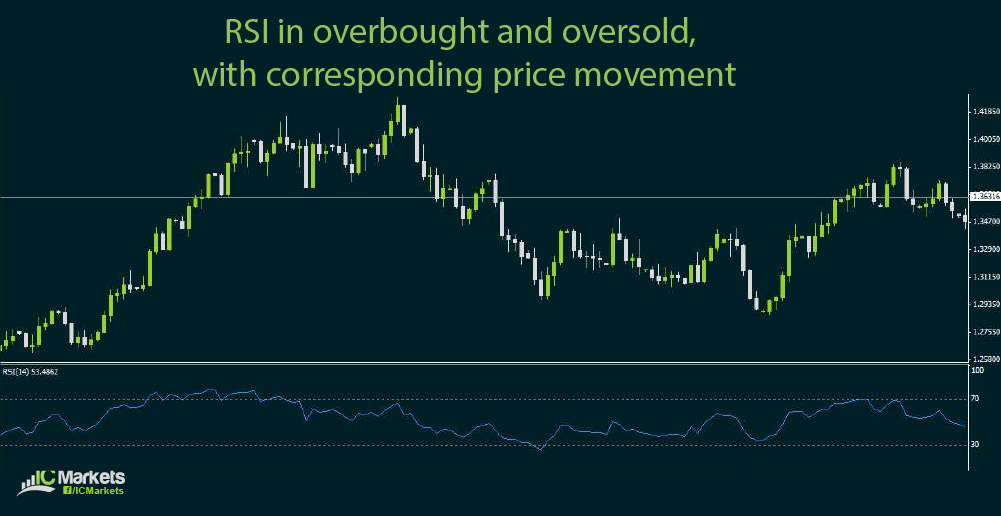
Another example of a leading indicator is the RSI or the relative strength index, which functions mostly like the stochastic. When RSI reaches the overbought area and gives a sell signal, price moves down. When RSI reaches the oversold area and gives a buy signal, price moves up.
The parabolic SAR (stop and reversal) is a special kind of leading indicator which also provides exit signals. Aside from that, this oscillator is usually applied as an overlay on price action to better allow the trader to visualize his entries and exits.
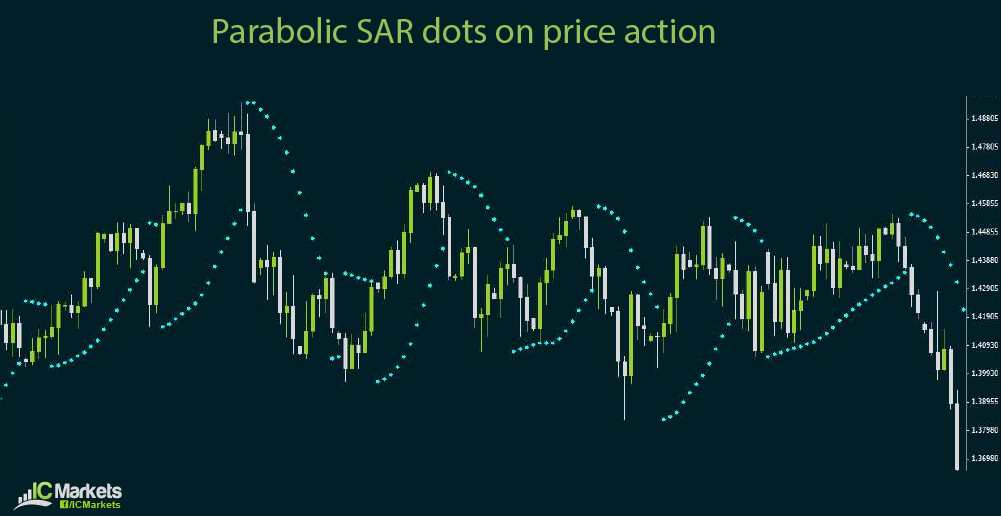
As you can see from the illustration, dots form above the price when a selloff is about to take place. On the other hand, dots form below the price when a rally is about to happen.
It may not be wise to jump in a long or short trade the moment a single dot appears below or above price action. One can wait for two or three dots to form before entering a position on the next candle then exiting when one or two dots form in the other direction.
Stochastic and RSI can also be used to identify trade exits by checking if the oscillator has reached the opposite end and is signaling a possible reversal. For stochastic, a crossover could signify a potential market turn. For RSI, a move below the middle 50.00 level could be an early sign that the trend is weakening.
Of course the parameters of these leading indicators can be tweaked to suit your trading style. More often than not, shorter-term parameters can generate more signals while longer-period ones give fewer signals. You can try different settings to filter out the false signals and to come up with a system that generates optimal results.


