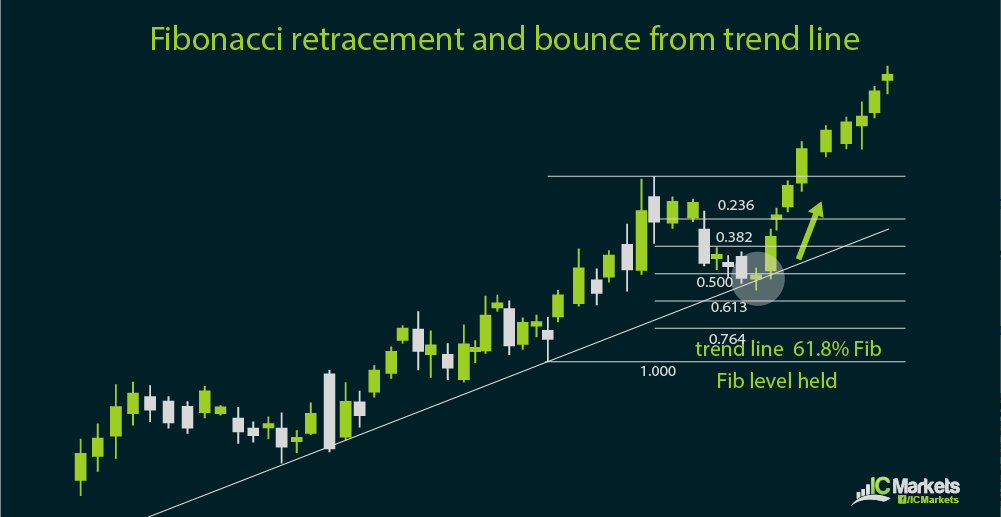
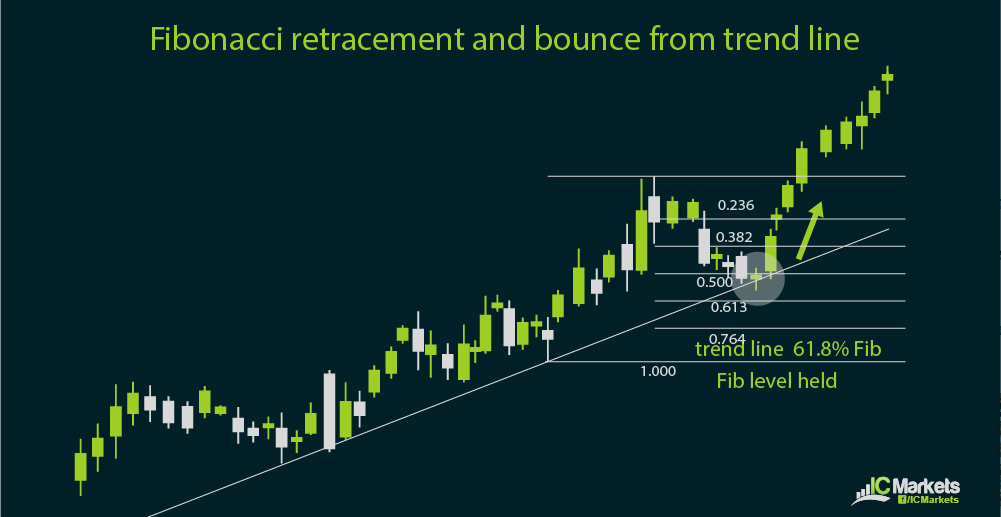
As discussed in the previous sections, Fibonacci retracement is often used during trending market environments so it makes sense to combine it with the use of trend lines.
Of course this also requires one to be able to draw trend lines properly, and the rule of thumb is to use one that has already been tested at least thrice. This entry-setting method tends to be more reliable on longer-term time frames.
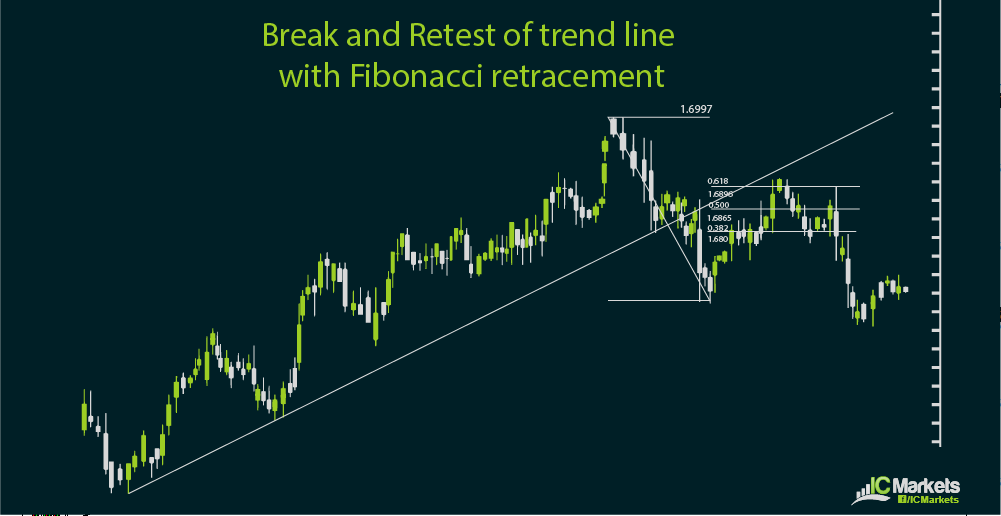
As with other types of support or resistance combined with Fibonacci retracement, there’s always the chance that this method might fail. This could be indicative of a change in market bias or a shift in trend, signaling the start of a reversal.
In this case, traders who are able to be flexible enough to quickly shift biases could use the Fibonacci levels in the direction of the reversal to wait for a potential retest of the broken trend line.
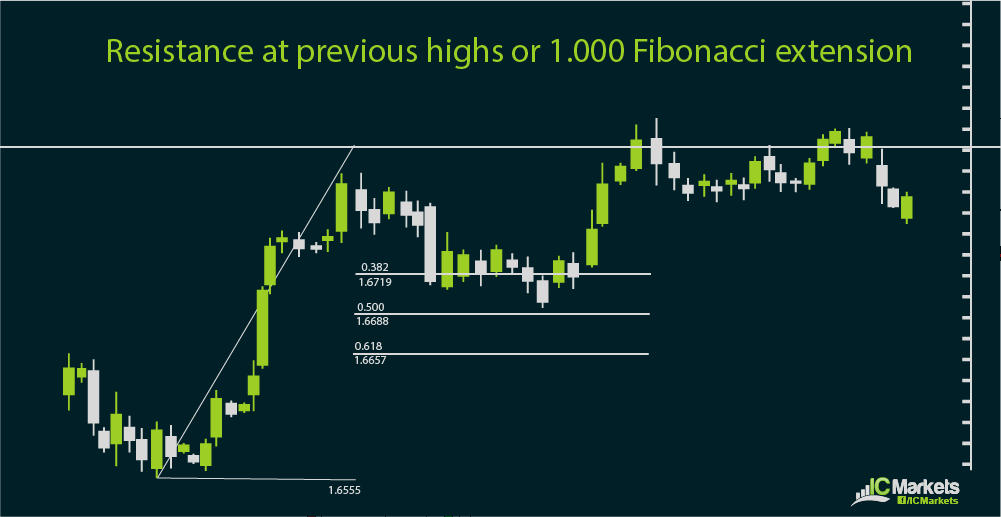
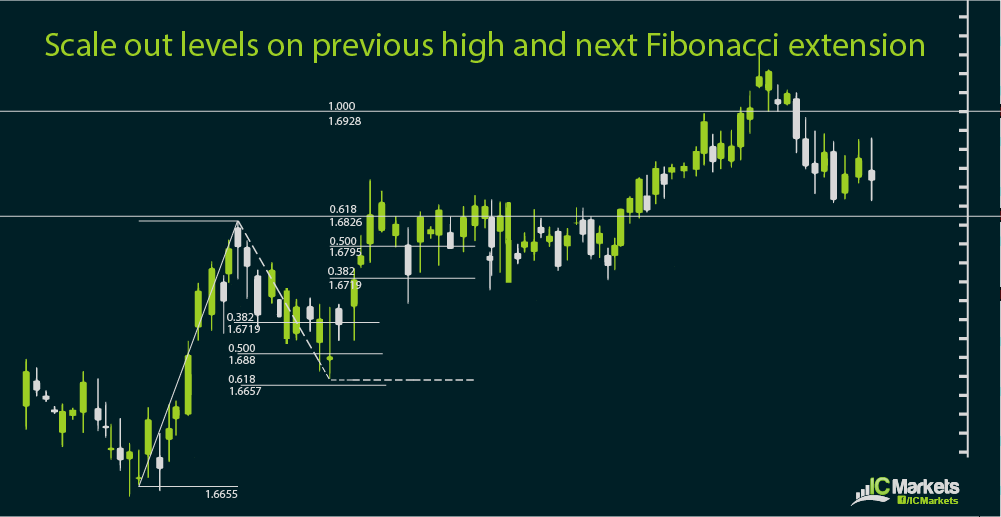
Fibonacci extension levels can be used in setting profit targets as well, but some traders opt to close their trades or have a partial exit at the latest swing low or high. In a downtrend, price typically finds support at the latest swing low while the latest swing high usually acts as resistance in an uptrend.
However in stronger trends, price tends to form new highs or lows. When price has already established which particular Fibonacci retracement level triggered a bounce, it could be easier to determine which extension levels could serve as exit points.
The selection of profit levels could vary depending on the aggressiveness of a trader. This could also depend on the reward-to-risk ratio that a trader is aiming for. Generally, trades that yield at least a 1:1 return on risk make for a good trade idea.
If the scaling-in method is a choice for entering trades, then the scaling-out method is an option for exiting trades. As mentioned earlier, one can book profits or exit part of the trade once price tests the previous swing high or low. The second or third profit level could be set at the next Fibonacci extension levels to press the advantage or catch more pips in case price makes new highs or lows.
You can opt to close half your trade position on the previous high or low then adjust your stop loss to your entry level in the remaining open position in order to protect your recent profits. That way, you can wind up with a risk-free trade on the open position. This is one of the many ways you can reduce your exposure, particularly when there are top-tier events up for release or if you won’t be able to watch your trades for a while.
