A note on lower timeframe confirming price action…
Waiting for lower timeframe confirmation is our main tool to confirm strength within higher timeframe zones, and has really been the key to our trading success. It takes a little time to understand the subtle nuances, however, as each trade is never the same, but once you master the rhythm so to speak, you will be saved from countless unnecessary losing trades. The following is a list of what we look for:
- A break/retest of supply or demand dependent on which way you’re trading.
- A trendline break/retest.
- Buying/selling tails – essentially we look for a cluster of very obvious spikes off of lower timeframe support and resistance levels within the higher timeframe zone.
- Candlestick patterns. We tend to only stick with pin bars and engulfing bars as these have proven to be the most effective.
EUR/USD:
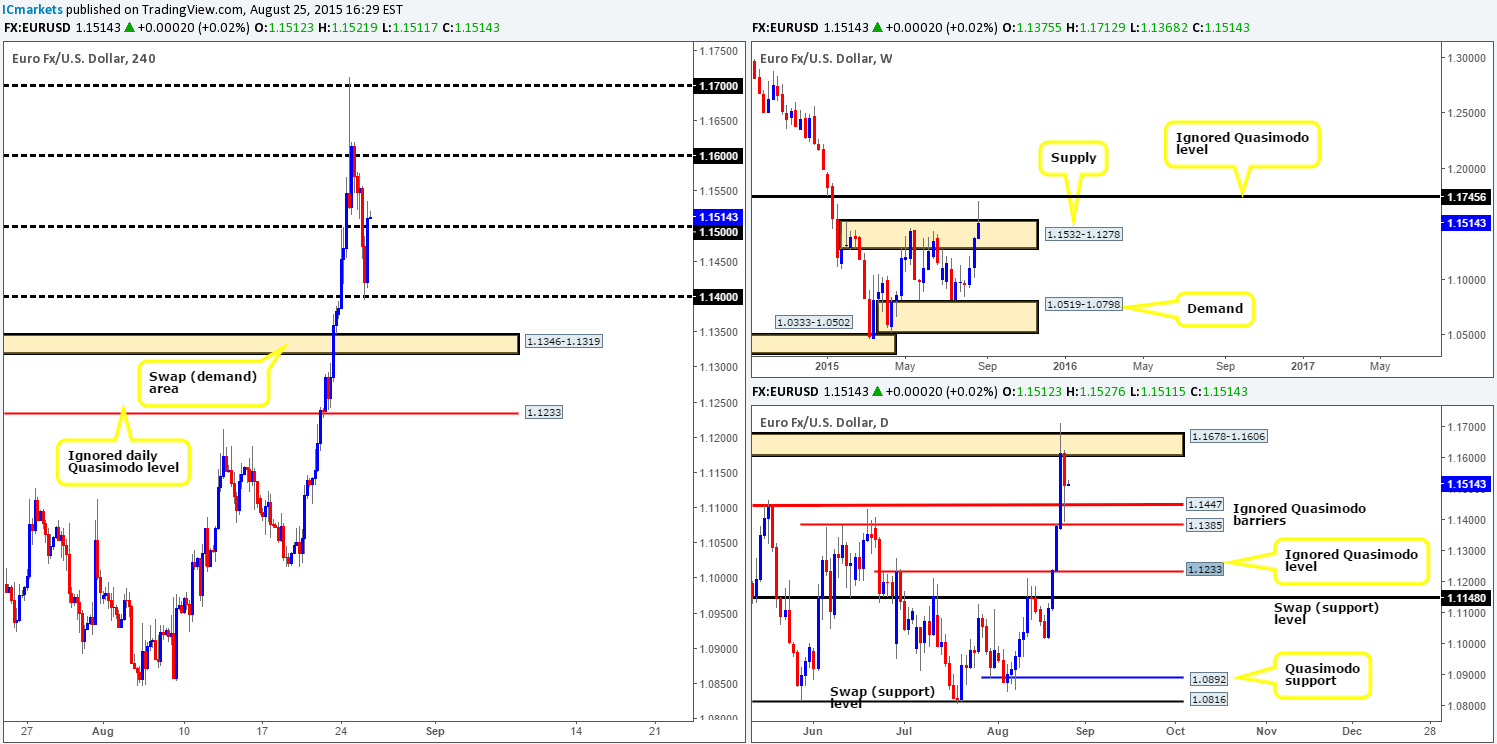
Following the strong rejection off of 1.1700 on Monday, price action continued to sell-off during yesterday’s trade. This move took out 1.1500 and jabbed into 1.1400, which, as you can see, was clearly strong enough to support a counter-attack back up to above 1.1500 into the close 1.1512. Looking at only the 4hr timeframe for the minute, we would say that if the buyers manage to hold the market above 1.1500 going into the more liquid sessions today, then a continuation move up to 1.1600 is quite possible.
However, looking at the bigger picture, we can see that the daily timeframe supports this move. Price found fresh bids between the ignored daily Quasimodo barriers coming in at 1.1447/1.1385, with daily supply not being seen until 1.1678-1.1606. Conversely however, weekly action is seen holding within the upper limits of supply at 1.1532-1.1278, so, as far as we see it, there is a mini tug-of-war currently in play on the higher timeframes.
Given the points made above, attempting to trade any retest seen at 1.1500 is a little on the risky side, but certainly not out of the question. As long as lower timeframe confirming price action accompanies the retest of 1.1500, it will likely be good for at least a bounce trade up to the mid-level number 1.1550.
Levels to watch/live orders:
- Buys: 1.1500 [Tentative – confirmation required] (Stop loss: dependent on where one confirms this level).
- Sells: Flat (Stop loss: N/A).
GBP/USD:
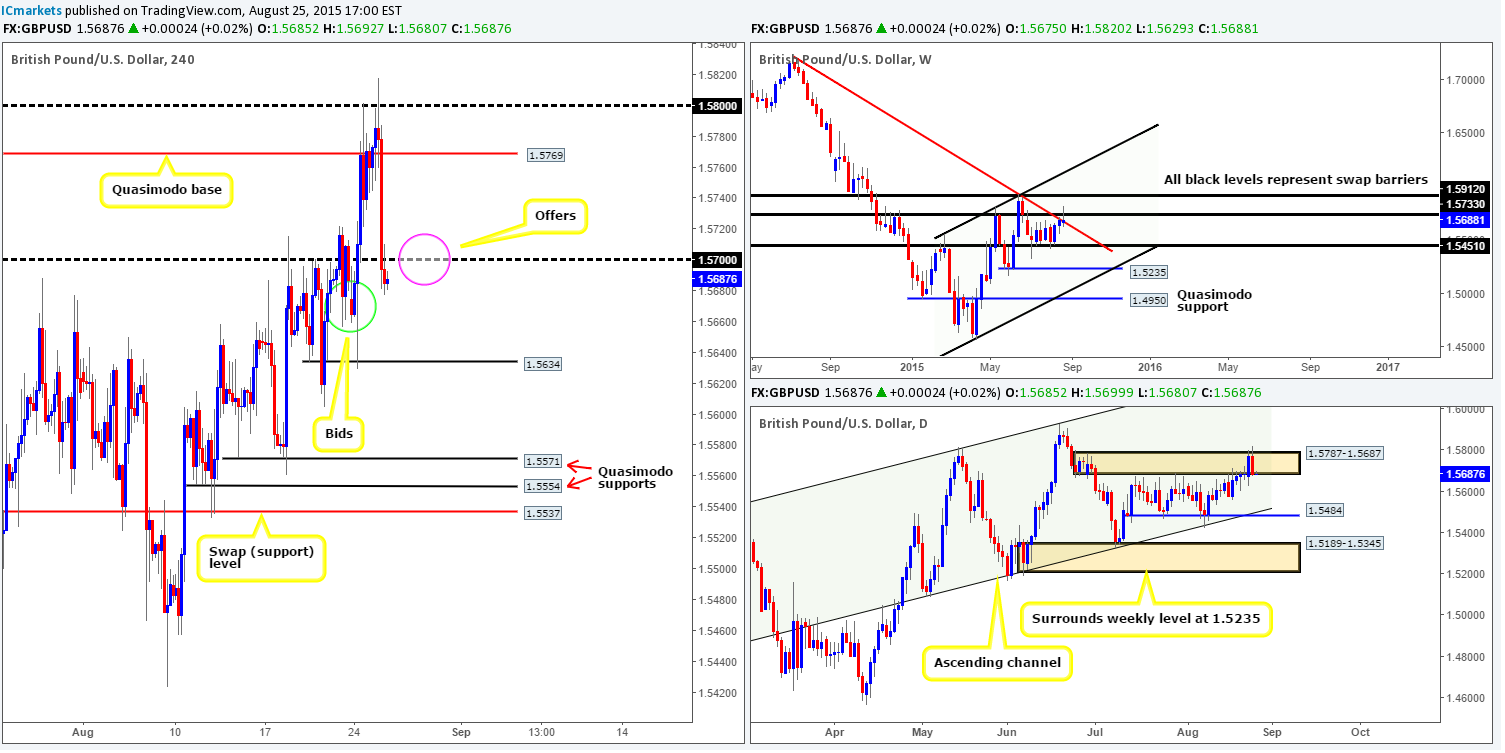
Amid yesterday’s trade, price broke above the 4hr Quasimodo resistance base at 1.5769 and spiked fifteen pips above the psychological resistance level at 1.5800. The stops taken out above this round number were clearly enough to fuel a sell-off of over 100 pips early on in U.S. trade, which consequently broke below and retested 1.5700 into the close 1.5685.
In view of price now effectively trapped between potential bids around 4hr demand (green circle) at 1.5679-1.5656, and offers seen at 1.5700 (pink circle), where do we see this market heading today? Well, with the weekly action currently respecting the weekly swap (resistance) level at 1.5733, and price on the daily timeframe seen holding below daily supply at 1.5787-1.5687, shorting this market could be the way to go. For this reason, if 1.5700 gets retested again and holds we will, if lower timeframe confirmation is seen, look to short from here targeting at least the 4hr Quasimodo base at 1.5634.
Levels to watch/ live orders:
- Buys: Flat (Stop loss: N/A).
- Sells: 1.5700 [Tentative – confirmation required] (Stop loss: dependent on where one confirms this level).
AUD/USD:
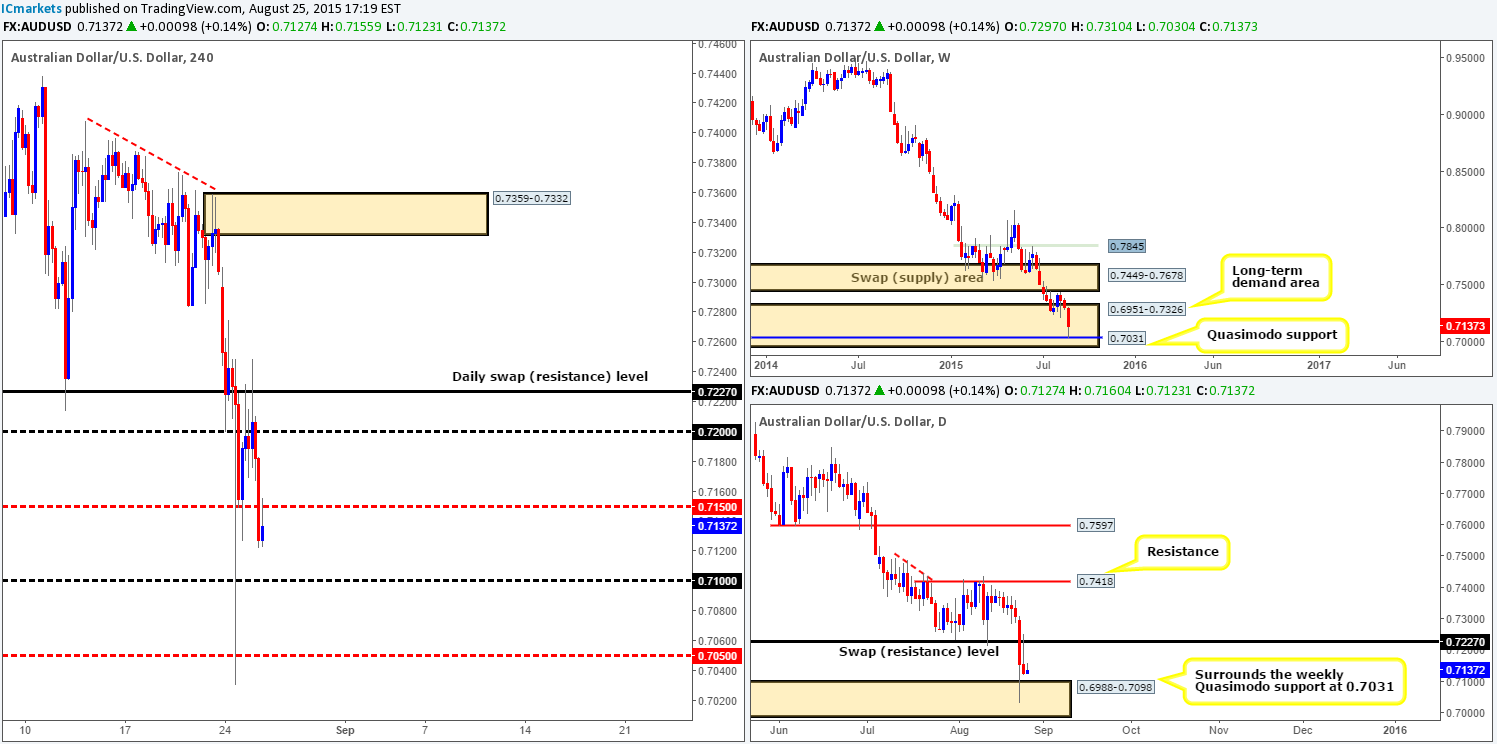
The AUD/USD pair, as you can see, spent the majority of the London morning session teasing offers around both 0.7200, and the daily swap (resistance) level just above it at 0.7227. It was only once the U.S. session opened did we see the market sell-off. Price aggressively smashed through bids sitting at the mid-level number 0.7150, and is at the time of writing currently retesting this hurdle as resistance.
Considering price is currently nibbling at a potential sell zone on the 4hr chart, where does our team stand in the bigger picture? Well, the weekly chart still shows price holding above the weekly Quasimodo support at 0.7031, whereas on the daily chart, the buyers and sellers are currently battling for position between 0.6988-0.7098 and 0.7227. Therefore, we’re sure you’ll agree that trading from 0.7150 is certainly tight! This – coupled with the current economic situation surrounding China makes this a relatively easy call to remain on the sidelines during today’s trade.
Levels to watch/ live orders:
- Buys: Flat (Stop loss: N/A).
- Sells: Flat (Stop loss: N/A).
USD/JPY:
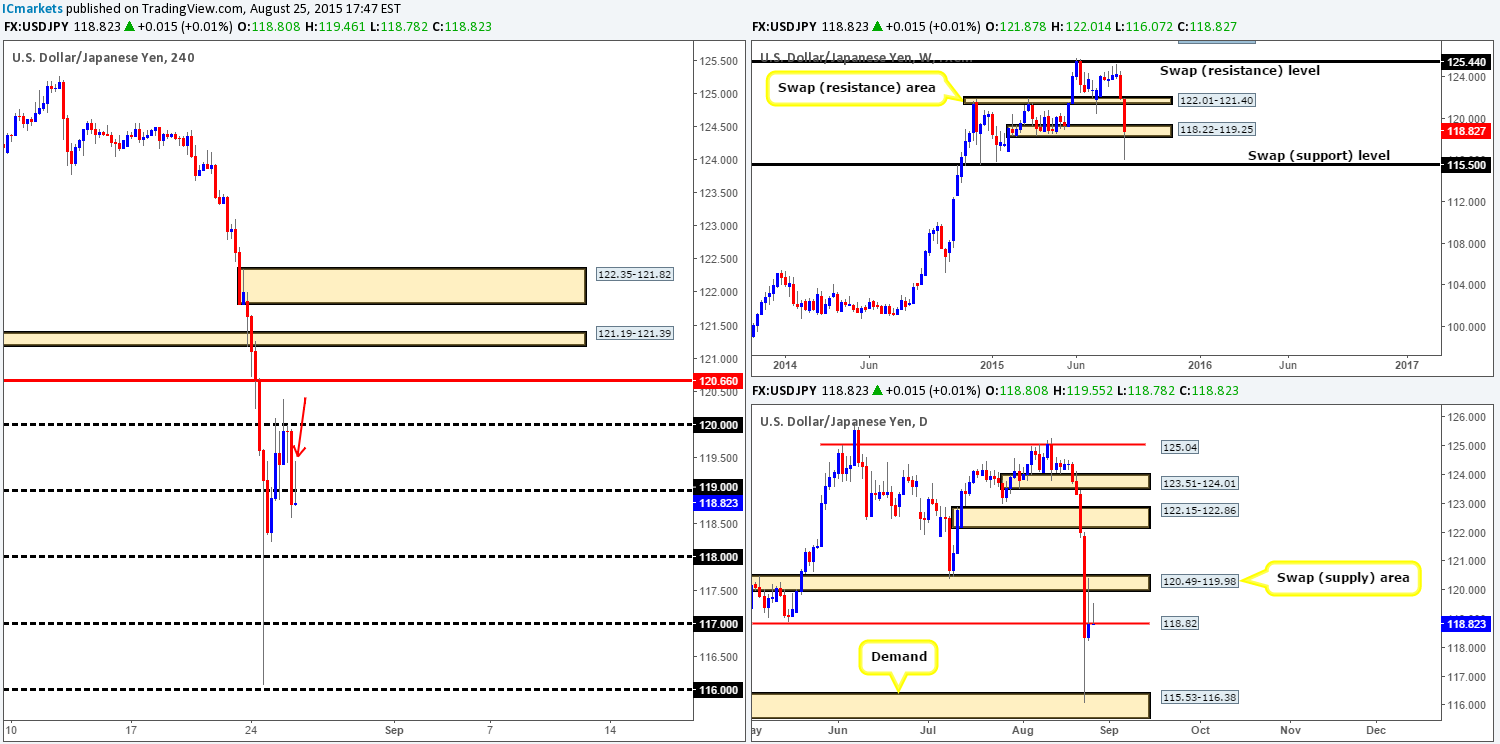
During the course of yesterday’s sessions, we can see that price drew resistance from the round-number 120.00, which eventually saw the USD/JPY sell-off and close below 119.00. As we write, price is currently retesting this number as resistance. The question we’d all no doubt like the answer to is, will this level be a stable enough platform to consider shorting this market today? With all things considered, we believe this handle to be weak, here’s why….
- The weekly chart shows price remains holding firm within the weekly support area at 118.22-119.25.
- Check out the recently closed daily candle. See how price violently stabbed above the daily swap (resistance) level at 118.82. This, at least to us, suggests that offers have been removed from not only this level but also from above at the daily swap (supply) area at 120.49-119.98 as well. To that end, the path north appears clear for further buying.
- Offers on the 4hr timeframe are likely weak now not only around 119.00, but also the mid-level region 119.50 from the recent spike north at 119.46 marked with a red arrow.
So, instead of attempting to short the retest of 119.00, we plan to wait and see if price can close back above this number and retest it as support. This will, in effect, be our cue to begin watching for lower timeframe buying confirmation to enter long. Targets for this trade should the above come to fruition will be 120.00, followed closely by 120.66 – a 4hr swap (resistance) level.
Levels to watch/ live orders:
- Buys: Watch for offers around 119.00 to be consumed and then look to trade any retest seen at this number (confirmation required).
- Sells: Flat (Stop loss: N/A).
USD/CAD:
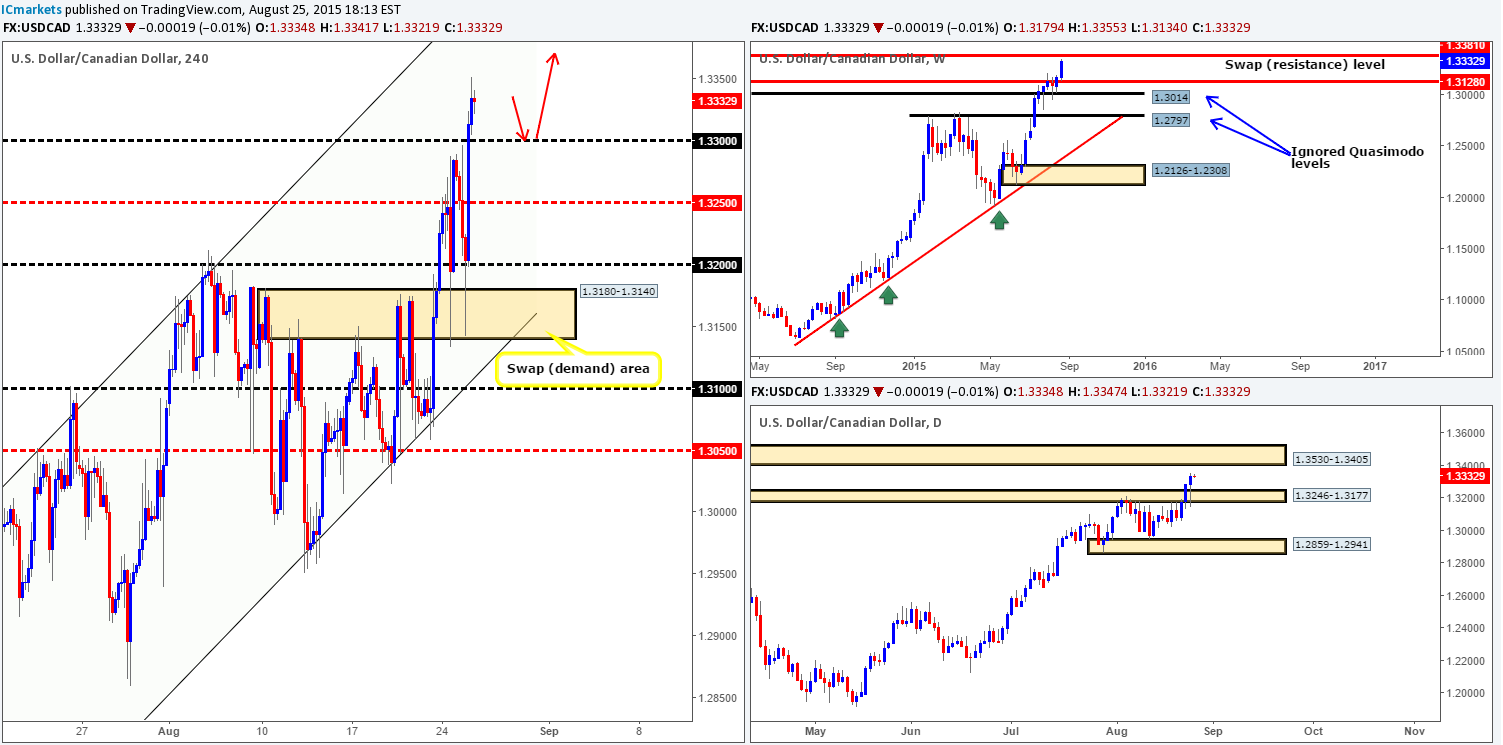
The USD/CAD shows that early morning trade in London saw a heavy wave of bids come into the market from within the 4hr swap (demand) area at 1.3180-1.3140. This time however, price punched through not only the mid-level number 1.3250, but also the round-number resistance at 1.3300. So, where do we believe price is heading to next?
Given that little resistance is seen on the weekly chart until the weekly swap (resistance) level at 1.3381, and daily supply at 1.3246-1.3177 has recently been retested as demand, this pair will likely continue to rally today.
To take advantage of this potential move, one could either buy at market – effectively buying the breakout above 1.3300, or conservatively wait to see if price retests 1.3300 before taking a trade. For those who read our analysis on a regular basis will already know that we’re not fond of breakout trading, as a result, we favor the latter.
So, to sum up, we’re looking for price to retest 1.3300 as support today, and will buy from here if lower timeframe confirmation is seen. Take-profit targets for this trade come in at 1.3381 – the weekly swap (resistance) level, followed closely by the lower limit of daily supply positioned a little above the round-number 1.3400 at 1.3405.
Levels to watch/ live orders:
- Buys: 1.3300 [Tentative – confirmation required] (Stop loss: dependent on where one finds confirmation around this level.
- Sells: Flat (Stop loss: N/A).
USD/CHF:
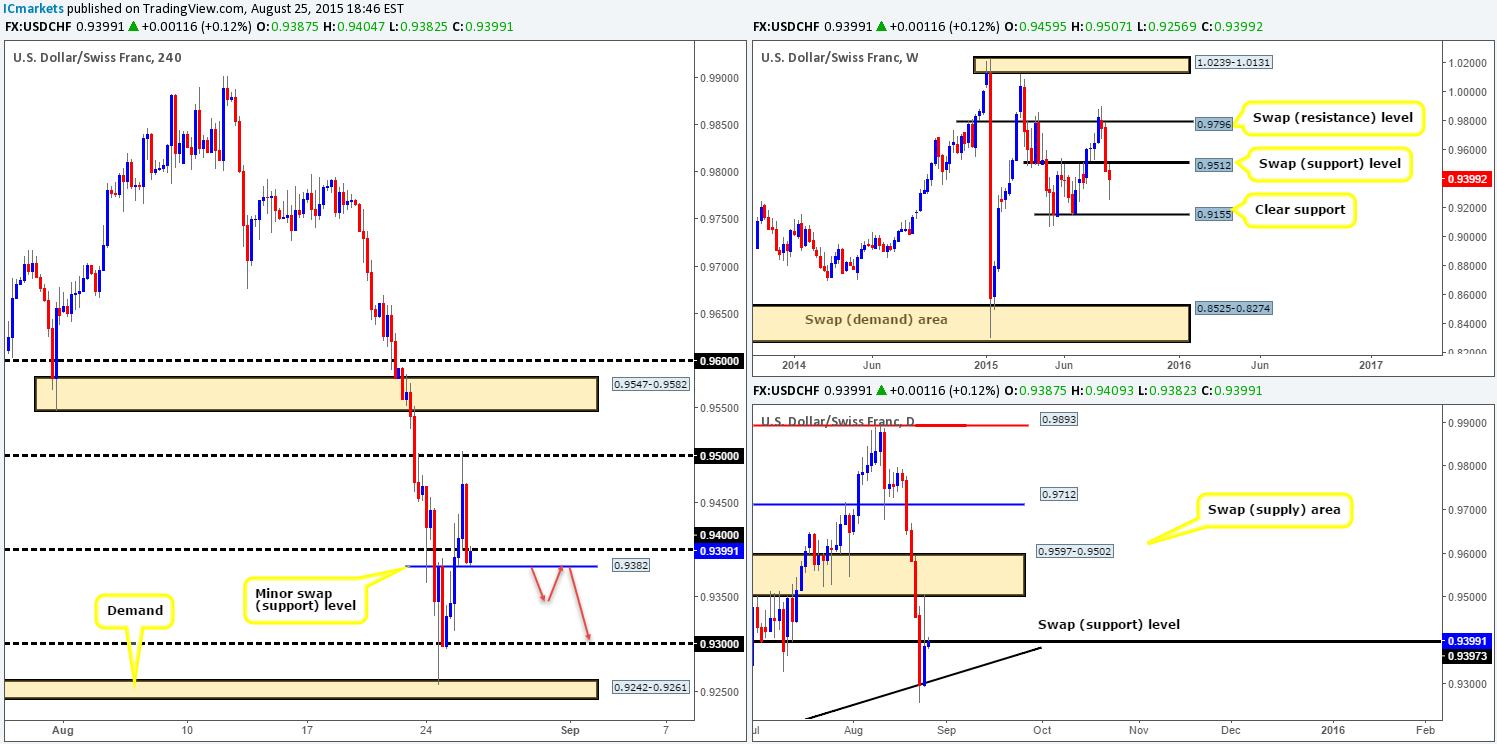
Following four consecutive days of losses, a heavy influx of bids came into this market yesterday causing prices to rally around 200 pips into the close 0.9387. It was only once we saw price connect with the 0.9500 handle in the early hours of U.S. trade, did the market energetically reverse over a 100 pips back below 0.9400.
As you can see, price is currently retesting 0.9400 as resistance at the moment, which we believe could hold this market lower today. The reasons for why come from the following:
- The weekly timeframe shows price recently retested 0.9512 as resistance.
- Although the daily ascending trendline (0.9077) held as support yesterday, price was unable to get above the daily swap (resistance) level at 0.9397. This was due to strong offers coming in at the base of a daily swap (supply) area seen just above at 0.9597-0.9502.
- Other than the small 4hr swap (support) barrier at 0.9382, price is relatively free to move down to at least 0.9300.
Given the points made above, the most conservative approach to trading 0.9400 today might be to wait and see if price can break below 0.9382 before looking to sell. Personally, we would not feel comfortable selling on the break of this number. Instead, our team would look for price to retest 0.9382/0.9400 as resistance (red arrows), and then begin looking for lower timeframe selling confirmation to short this market down to 0.9300.
Levels to watch/ live orders:
- Buys: Flat (Stop loss: N/A).
- Sells: Watch for bids around 0.9382 to be consumed and then look to trade any retest seen between this number and 0.9400 (confirmation required).
DOW 30:
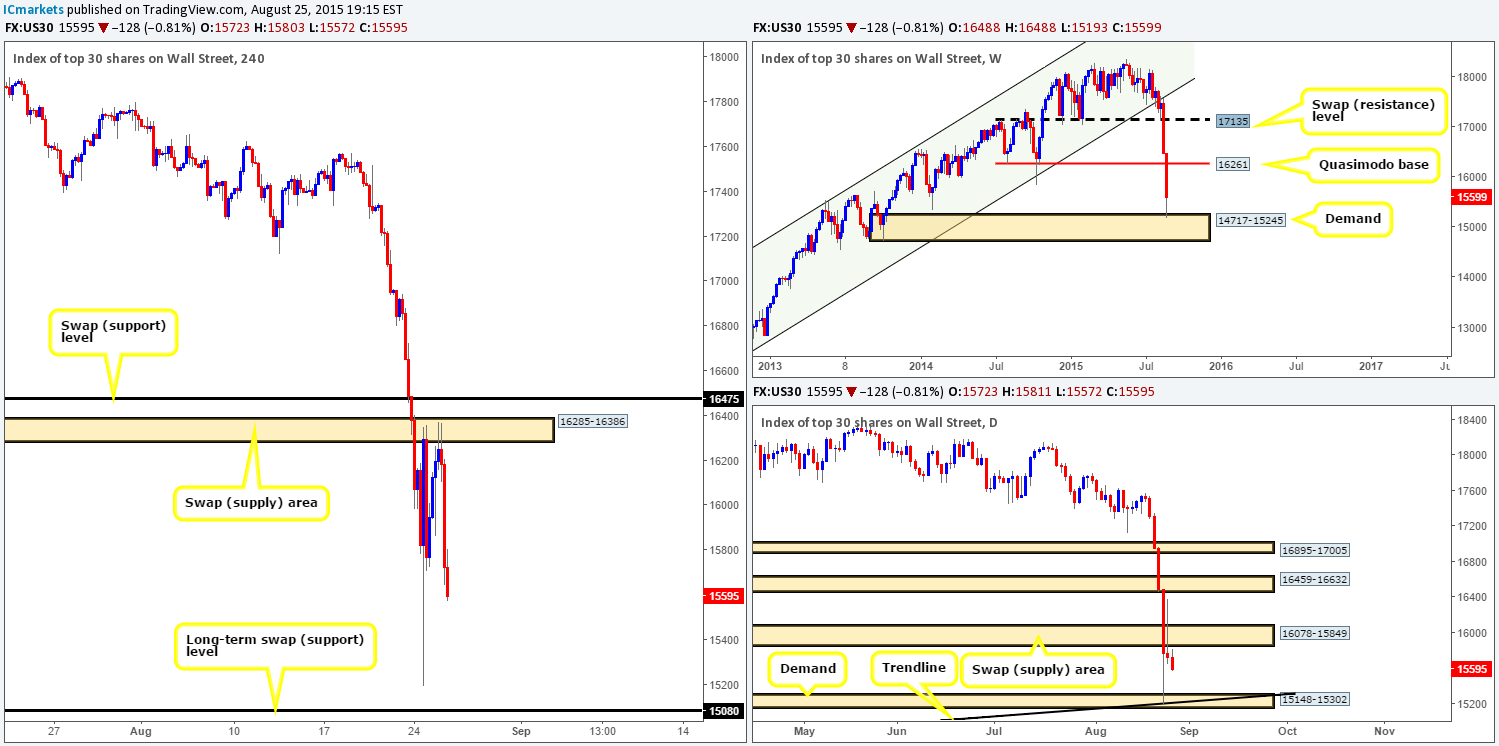
From looking at the DOW 30 charts this morning, both the 4hr and daily timeframes show room to continue trading lower today. However, when one takes into account that price is currently rebounding off of a weekly demand area at 14717-15245 at the moment, selling this market all of sudden becomes less attractive!
This is certainly not to say that price will not reach either the daily demand zone at 15148-15302 or the 4hr swap (support) level just below it at 15080. It simply comes down to us not being comfortable shorting into clear buying pressure from a weekly demand zone – no matter how much room is seen on the lower timeframes. Be that as it may, our team has come to a general consensus that in the absence of clearer price action, remaining flat in this market for the time being could be the best path to take.
Levels to watch/ live orders:
- Buys: Flat (Stop loss: N/A).
- Sells: Flat (Stop loss: N/A).
XAU/USD: (Gold)
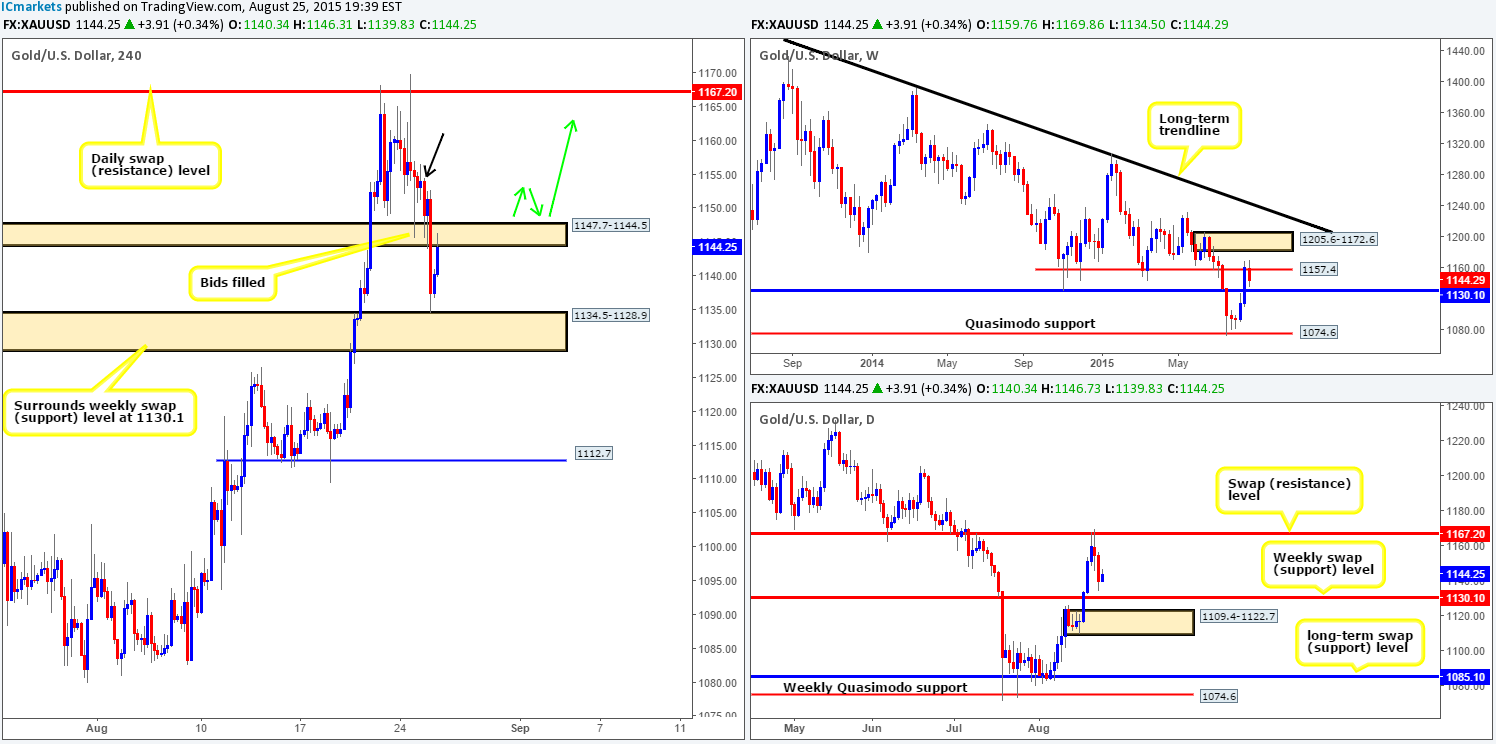
For those who read our previous report on Gold http://www.icmarkets.com/blog/tuesday-25th-august-daily-technical-outlook-and-review/ you may recall us mentioning to watch how price action responded to the consumed bids around the 4hr swap (demand) area at 1147.7-1144.5. As you can see, a relatively strong bearish candle printed just above this zone (see black arrow), which would have been enough of a signal to suggest we’re heading lower down to 4hr swap (demand) area at 1134.5-1128.9. Unfortunately though, we were not at our desks when this happened and missed the move entirely. Well done to any of our readers who managed to lock in some green pips here!
Going forward, we can see that price is now testing the underside of 1147.7-1144.5 on the 4hr timeframe as supply at the moment. This area is not really somewhere we’d stamp a high-probability reversal zone, simply because price is finding support just above the weekly swap (support) level at 1130.1.The most we see price dropping to from here is back down to 1134.5-1128.9.
Therefore, with supportive pressure being seen from a weekly swap (support) base, we believe price will eventually take out the 4hr swap (supply) area at 1147.7-1144.5. This, in itself, would effectively be our cue to begin watching for price to retest the violated area as demand. Should all go to plan, and lower timeframe confirmation is seen accompanying the retest, we would, depending on the time of day of course, likely take a long trade from here targeting the daily swap (resistance) level at 1167.2.
Levels to watch/ live orders:
- Buys: Watch for offers around 1147.7-1144.5 to be consumed and then look to trade any retest seen at this area (confirmation required).
- Sells: Flat (Stop loss: N/A).

