Tuesday 25th July 2023: Technical Outlook and Review
The DXY chart indicates a bullish momentum, suggesting a potential bullish continuation towards the 1st resistance level at 101.98. This resistance level is identified as an overlap resistance and coincides with the 61.80% Fibonacci retracement.

IC Markets Asia Fundamental Forecast | 25 July 2023
IC Markets Asia Fundamental Forecast | 25 July 2023 What happened […]
Monday 24th July 2023: Asian and Australian Markets Display Mixed Performance
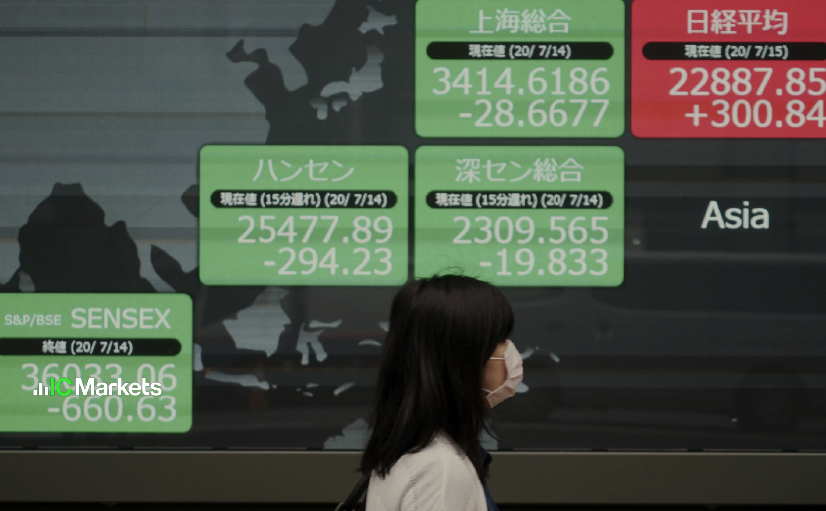
Global Markets: News & Data: Markets Update: Asian markets showed a […]

IC Markets Europe Fundamental Forecast | 24 July 2023
IC Markets Europe Fundamental Forecast | 24 July 2023 What happened […]

Monday 24th July 2023: Technical Outlook and Review
The price may potentially experience a bearish reaction off the 1st resistance level at 101.09, which coincides with the 38.20% Fibonacci retracement, leading to a drop towards the 1st support at 101.03, representing the 61.80% Fibonacci retracement.
IC Markets Asia Fundamental Forecast | 24 July 2023
IC Markets Asia Fundamental Forecast | 24 July 2023 What happened […]

Friday 21st July 2023: Asian Markets Display Mixed Sentiment, Australian Market Faces Challenges.
Global Markets: News & Data: Markets Update: Asian markets had a […]
IC Markets Europe Fundamental Forecast | 21 July 2023
IC Markets Europe Fundamental Forecast | 21 July 2023 What happened […]

Friday 21st July 2023: Technical Outlook and Review
The chart for the DAY instrument indicates a prevailing bearish momentum, suggesting a potential continuation of the downward movement towards the 1st support level. This support level, located at 100.01, holds significance as an overlap support and aligns with the 61.80% Fibonacci retracement. Furthermore, the 2nd support level at 99.42 also acts as an overlap support.


