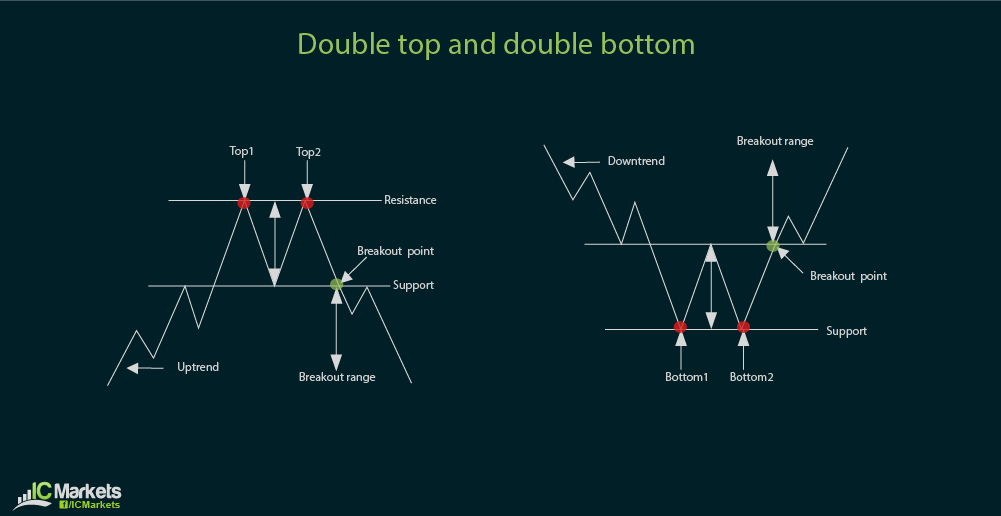
Basic Forex Chart Formations
Aside from technical indicators and Japanese candlestick patterns, another main component […]
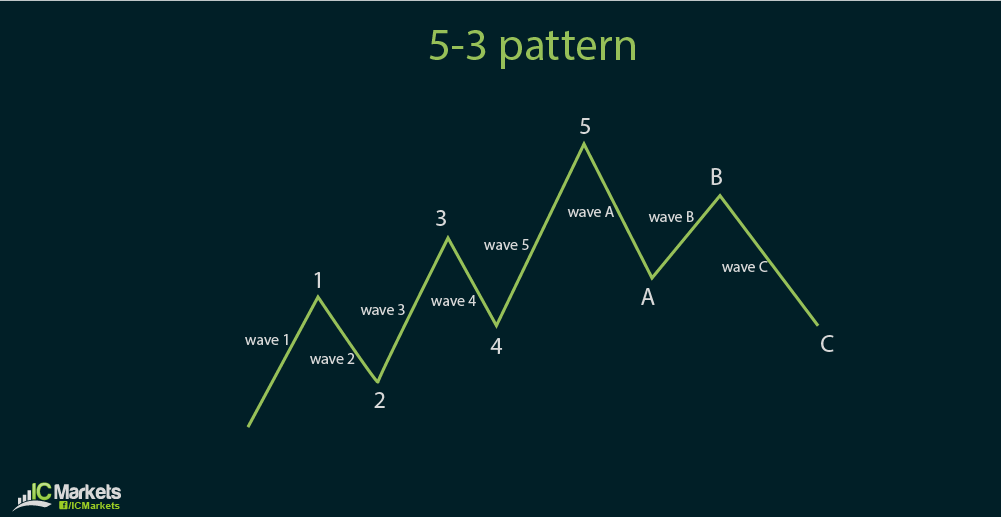
Elliott Wave Analysis 101
A combination of repeating price patterns with Fibonacci analysis yields another […]
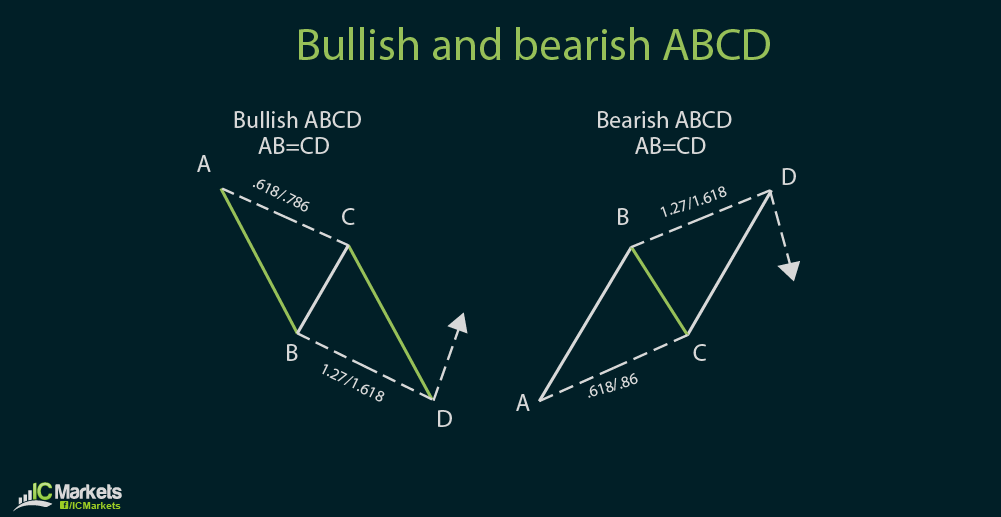
Understanding Harmonic Price Patterns
Harmonic price patterns comprise another set of chart formations involving Fibonacci […]
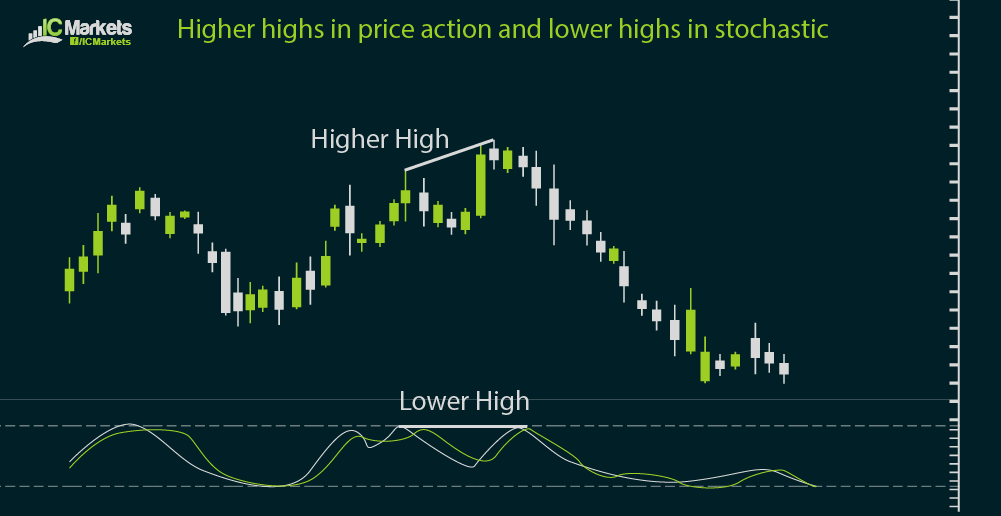
How to Trade Divergences
As you've learned in the previous sections, technical indicators and price […]
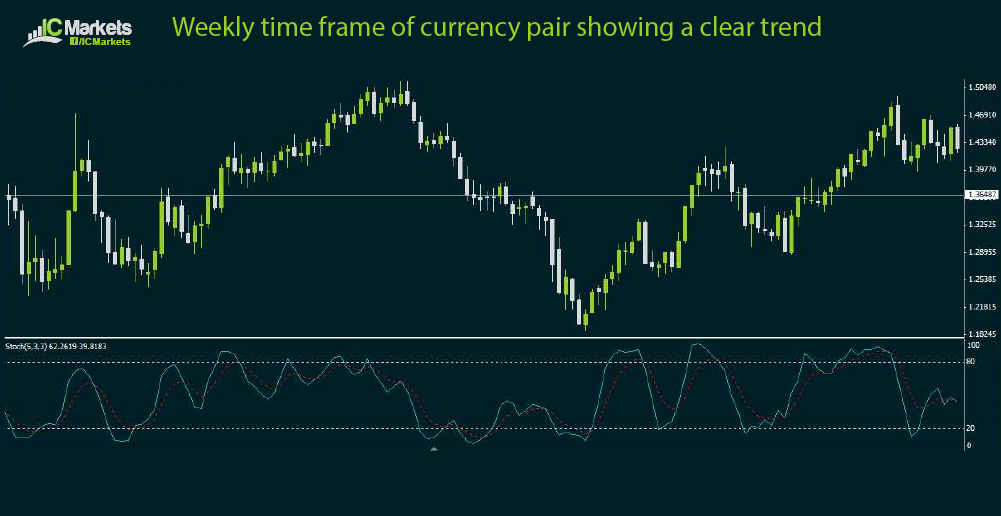
Using Multiple Time Frame Analysis
While using a combination of technical indicators can help confirm price […]


