
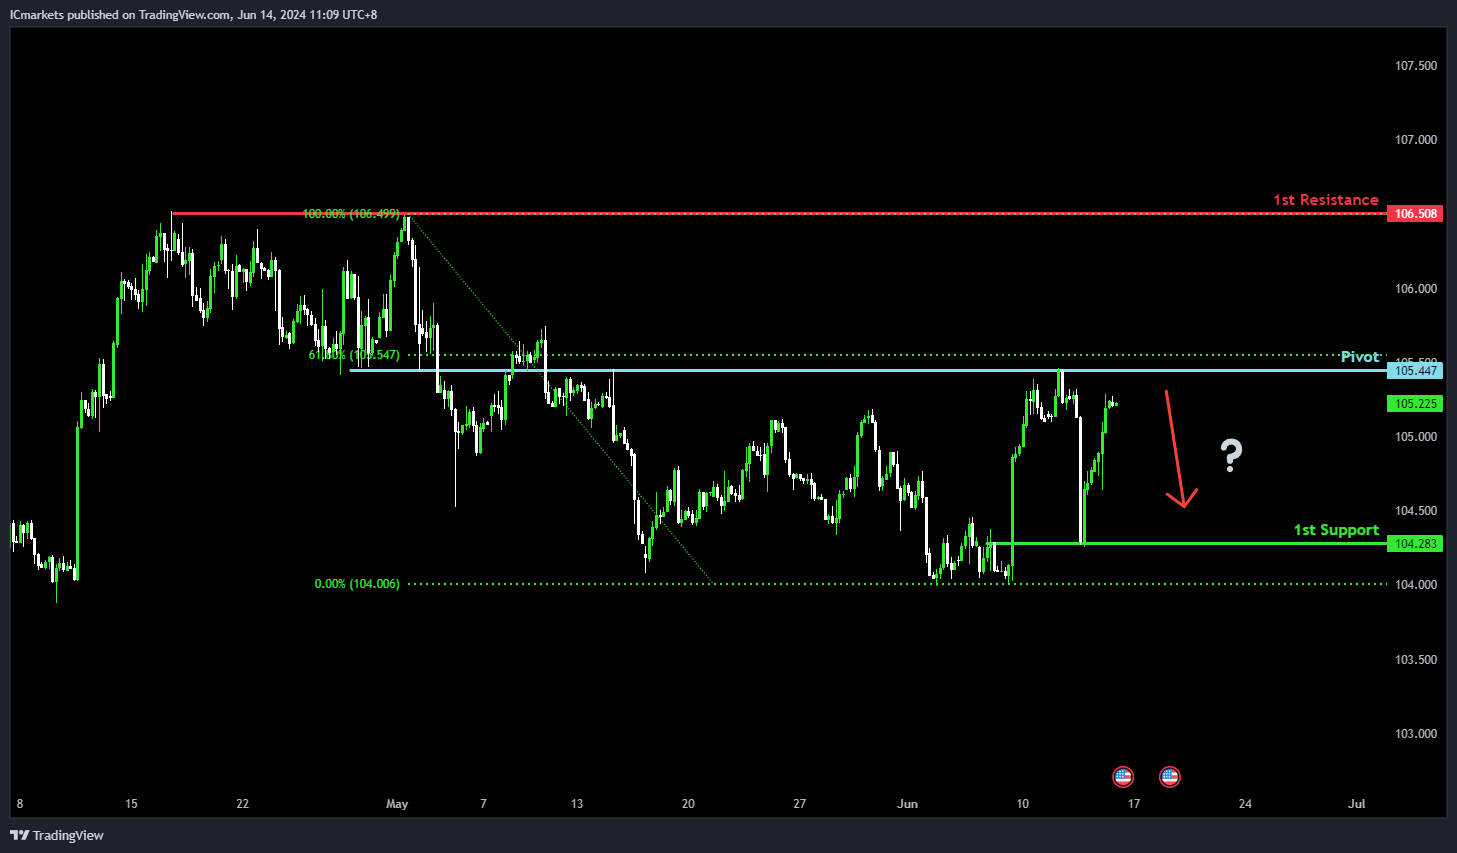
DXY (US Dollar Index):
Potential Direction: Bearish
Overall momentum of the chart: Bearish
Price could potentially make a bearish reaction off pivot and drop to 1st support.
Pivot: 105.44
Supporting reasons: Identified as pullback resistance, coinciding with the 61.8% Fibonacci Retracement, indicating a level where selling pressure may emerge.
1st support: 104.28
Supporting reasons: Recognized as overlap support, suggesting a historical level where buying interest has previously emerged.
1st resistance: 106.50
Supporting reasons: Noted as a multi-swing high resistance indicating a significant area where selling pressure may intensify.
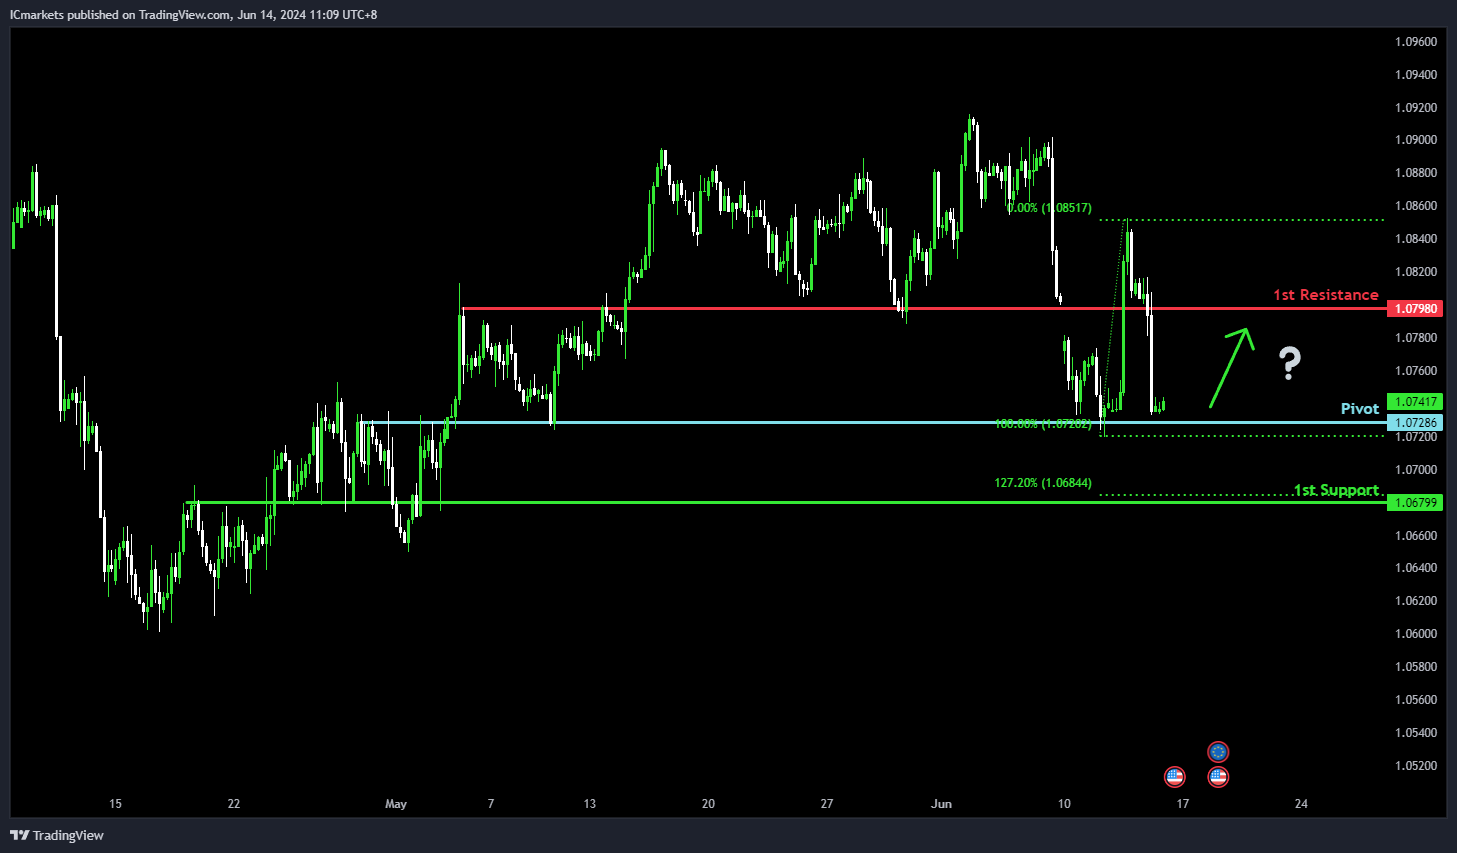
EUR/USD:
Potential Direction: Bullish
Overall momentum of the chart: Bearish
Price could potentially make a bullish bounce off pivot and head towards 1st resistance.
Pivot: 1.0741
Supporting reasons: Identified as an overlap support level, indicating a historical area where buying interest has previously emerged.
1st support: 1.0679
Supporting reasons: Recognized as an overlap support, coinciding with the 127.20% Fibonacci Extension level, suggesting a strong historical support zone where buyers might be active.
1st resistance: 1.0798
Supporting reasons: Noted as pullback resistance, indicating a significant area where selling pressure may emerge and potentially limit further upside movement.
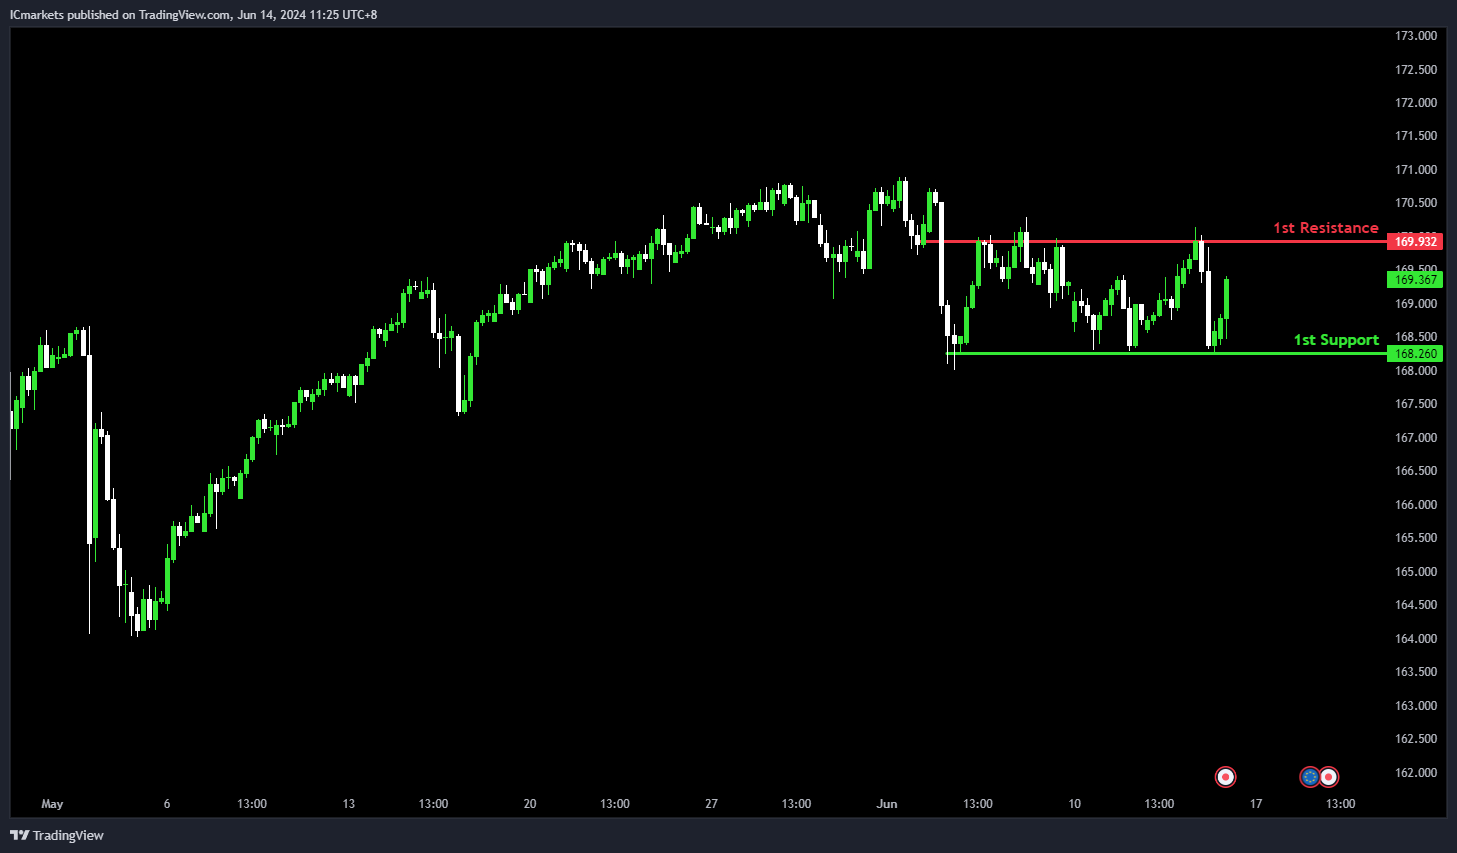
EUR/JPY:
Potential Direction: Neutral
Overall momentum of the chart: Bullish
Price could potentially fluctuate between the 1st resistance and 1st support level.
1st support: 168.26
Supporting reasons: Identified as multi-swing low support, indicating a historical level where buying interest has previously been strong.
1st resistance: 169.93
Supporting reasons: Noted as swing high resistance, suggesting a significant area where selling pressure may emerge and potentially limit further upside movement.
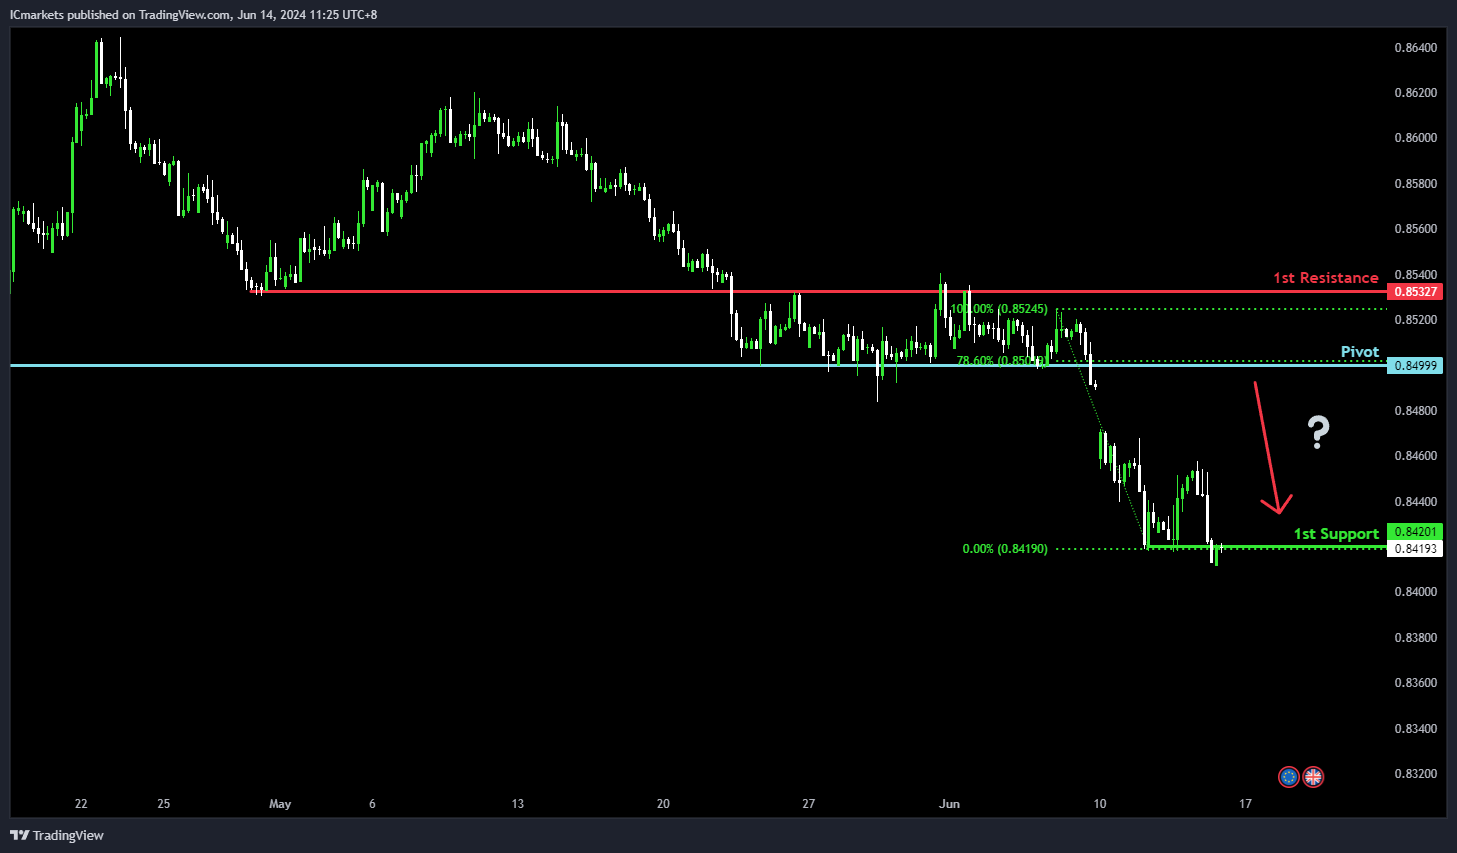
EUR/GBP:
Potential Direction: Bearish
Overall momentum of the chart: Bearish
Price could potentially make a bearish reaction off pivot and drop to 1st support.
Pivot: 0.8499
Supporting reasons: Identified as pullback resistance, coinciding with the 78.6% Fibonacci Retracement, indicating a level where selling pressure may emerge.
1st support: 0.8420
Supporting reasons: Recognized as swing low support, suggesting a historical level where buying interest has been strong.
1st resistance: 0.8532
Supporting reasons: Noted as an overlap resistance, indicating a level where selling pressure may intensify due to historical significance.
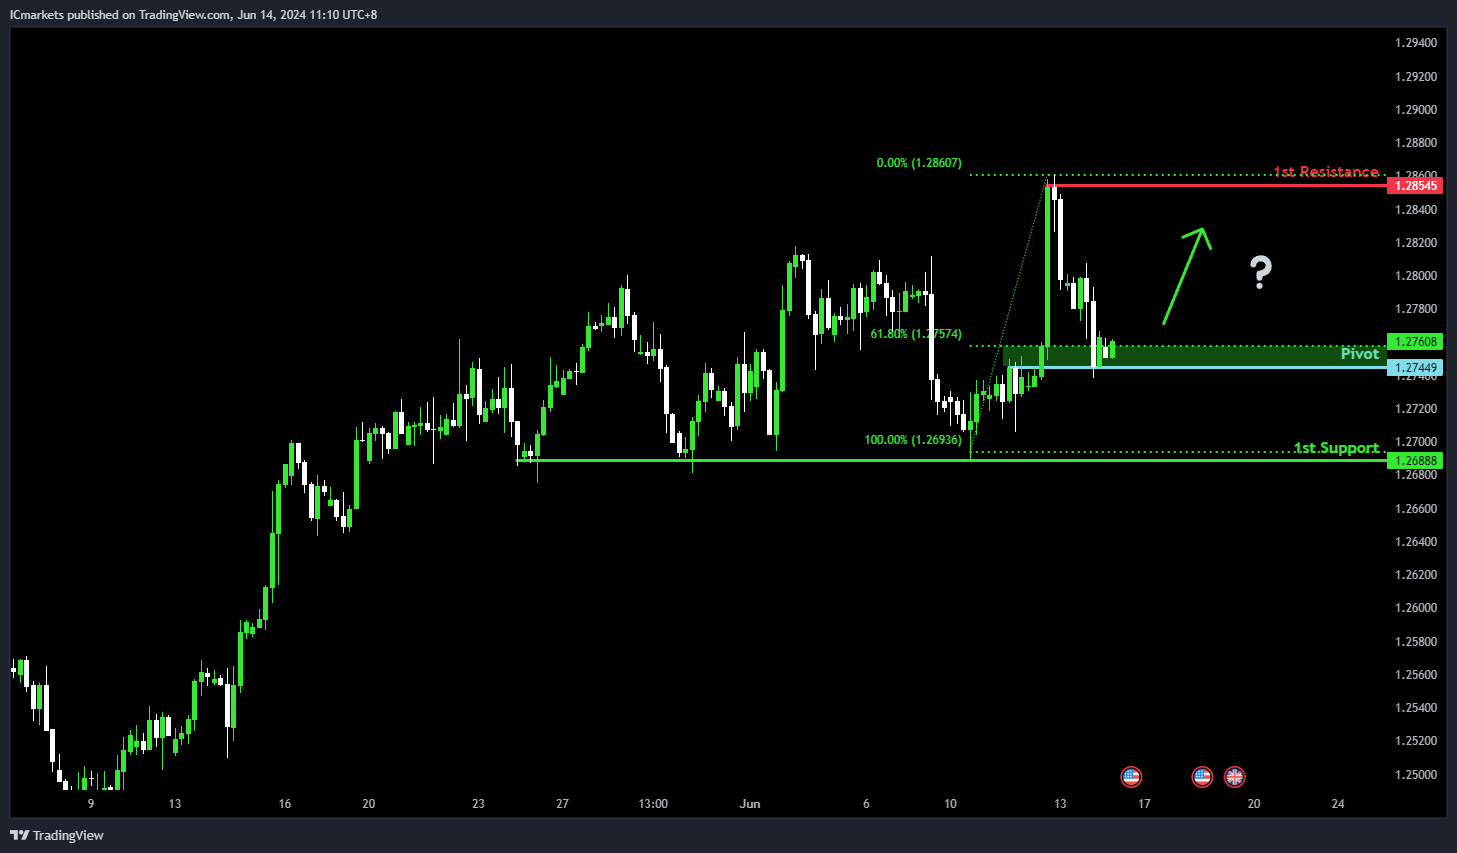
GBP/USD:
Potential Direction: Bullish
Overall momentum of the chart: Bullish
Price could potentially make a bullish bounce off pivot and head towards 1st resistance.
Pivot: 1.2744
Supporting reasons: Identified as pullback support, coinciding with the 61.80% Fibonacci Retracement level, suggesting a potential area where buying interest could emerge.
1st support: 1.2688
Supporting reasons: Recognized as multi-swing low support, indicating a historical level where buying interest has previously been significant.
1st resistance: 1.2854
Supporting reasons: Noted as multi-swing high resistance, suggesting a significant area where selling pressure may emerge and potentially limit further upside movement.
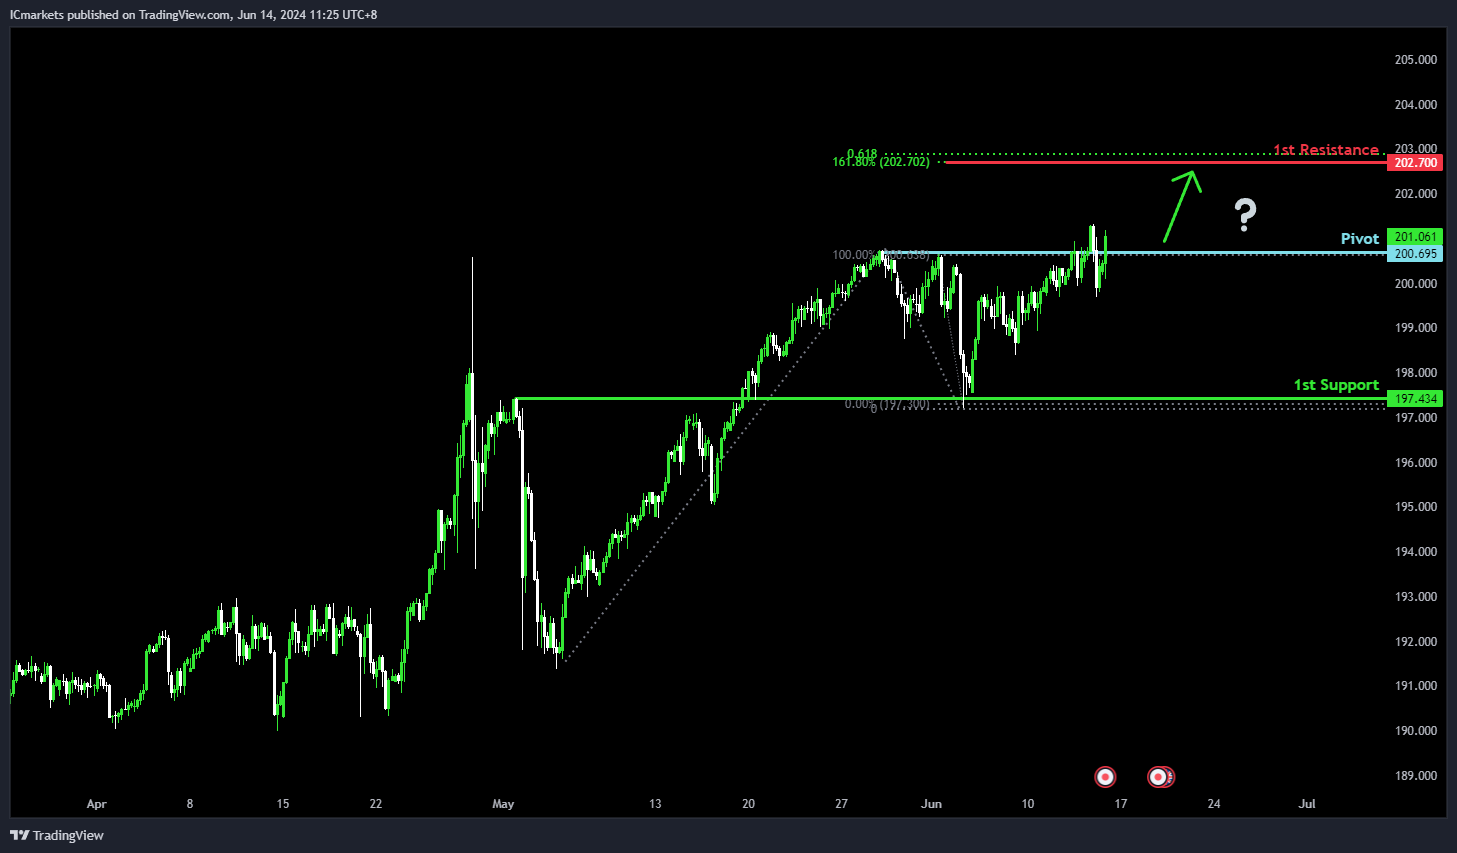
GBP/JPY:
Potential Direction: Bullish
Overall momentum of the chart: Bullish
Price could potentially make a bullish break through the pivot and rise to the 1st resistance.
Pivot: 200.69
Supporting reasons: Identified as multi-swing high resistance, indicating a level where previous selling pressure may have been present.
1st support: 197.43
Supporting reasons: Recognized as an overlap support level, suggesting a historical area where buying interest has emerged in the past.
1st resistance: 202.70
Supporting reasons: Noted as a confluence area with the 161.80% Fibonacci Extension and the 61.80% Fibonacci Projection, suggesting a strong Fibonacci resistance zone where selling pressure may intensify and potentially limit further upside movement.
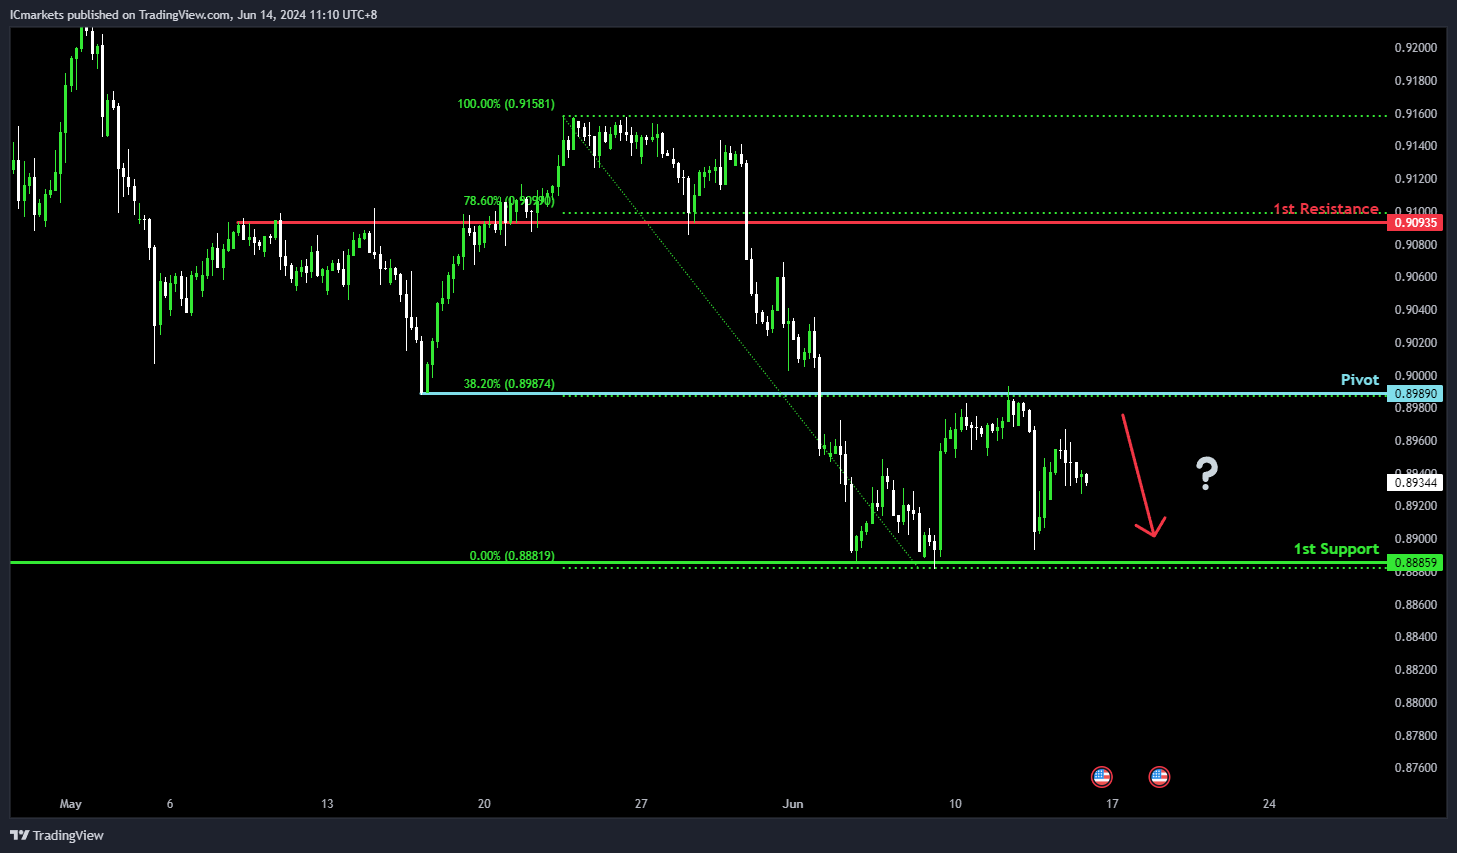
USD/CHF:
Potential Direction: Bearish
Overall momentum of the chart: Bearish
Price could potentially make a bearish continuation towards the 1st support.
Pivot: 0.8989
Supporting reasons: Identified as an overlap resistance and coinciding with the 38.20% Fibonacci Retracement level, suggesting a significant area where selling pressure may emerge.
1st support: 0.8886
Supporting reasons: Recognized as a multi-swing low support, indicating historical buying interest at this level.
1st resistance: 0.9093
Supporting reasons: Noted as a pullback resistance level and coinciding with the 78.60% Fibonacci Retracement, suggesting a strong Fibonacci resistance zone where selling pressure may intensify and potentially limit further upward movement.
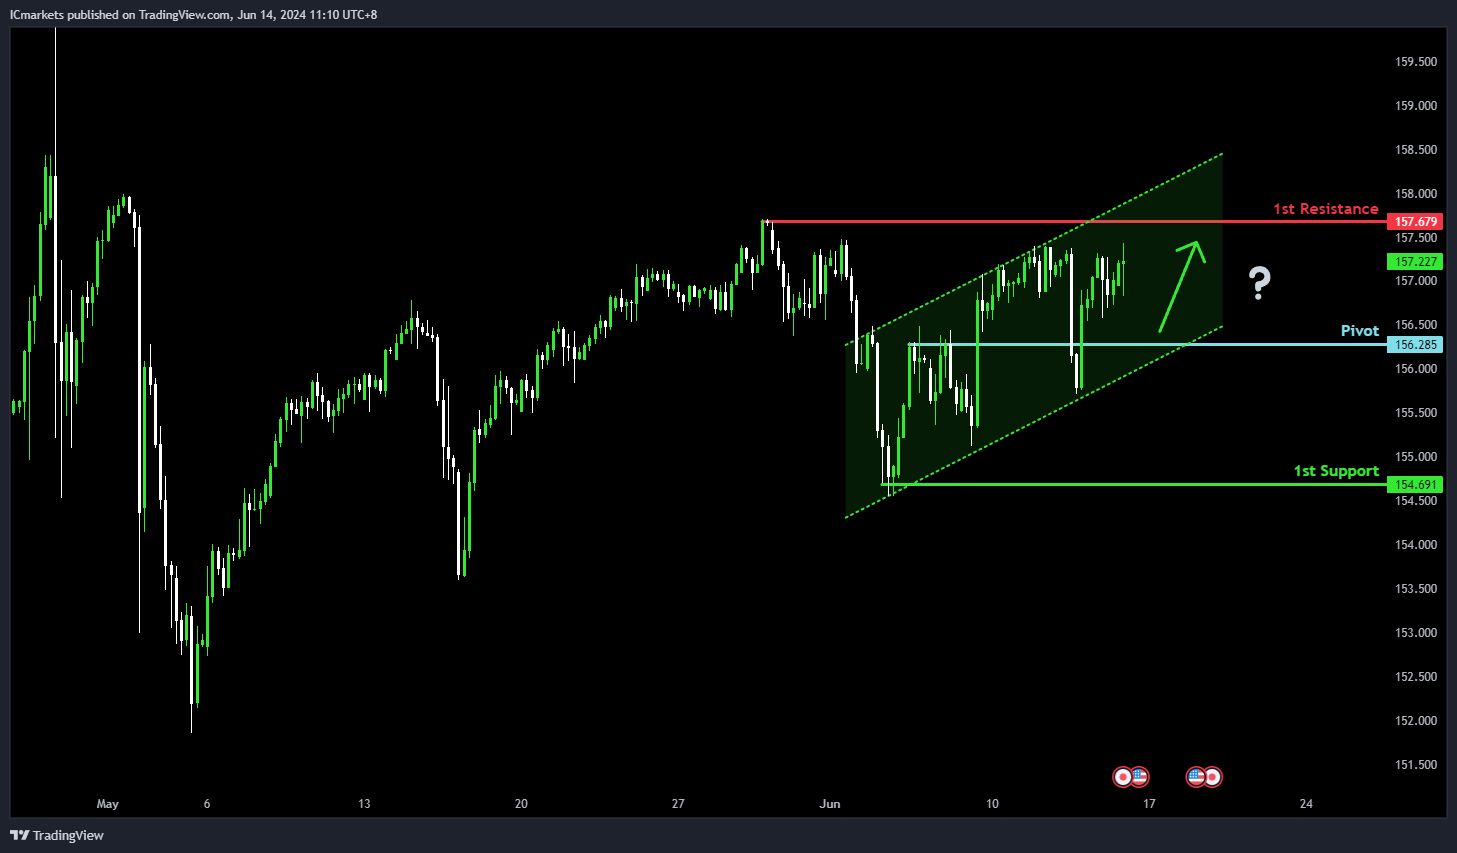
USD/JPY:
Potential Direction: Bullish
Overall momentum of the chart: Bullish
Factors contributing to the momentum are that the price is in a bullish ascending channel.
Price could potentially make a bullish bounce off pivot and head towards 1st resistance.
Pivot: 156.28
Supporting reasons: Identified as pullback support, suggesting a level where buying interest may emerge.
1st support: 154.69
Supporting reasons: Recognized as swing low support, indicating a historical level where buying interest has emerged.
1st resistance: 157.67
Supporting reasons: Noted as swing high resistance, suggesting a significant area where selling pressure may intensify.
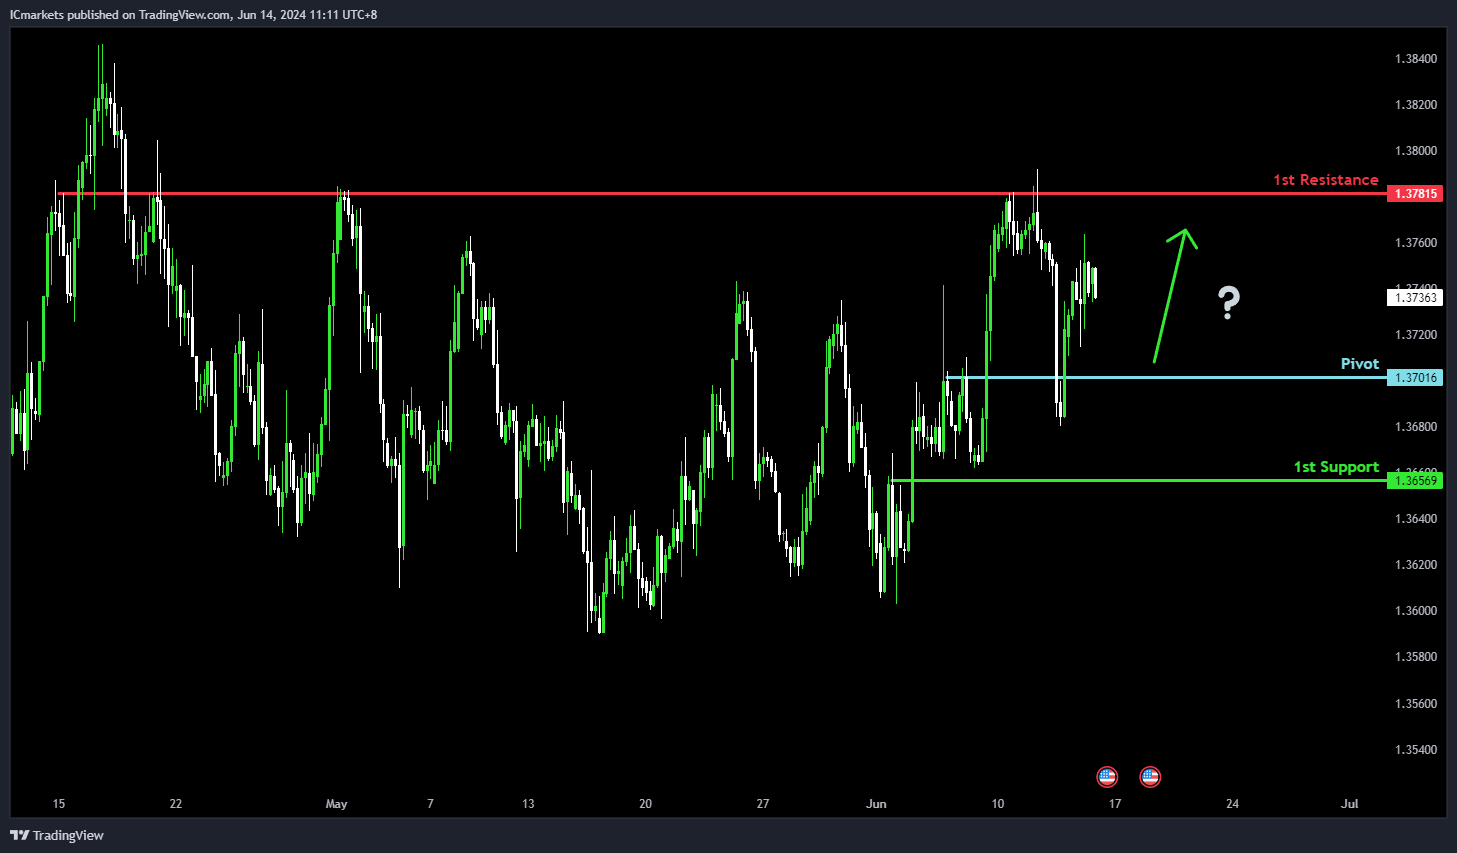
USD/CAD:
Potential Direction: Bullish
Overall momentum of the chart: Bullish
Price could potentially make a bullish bounce off the pivot and head towards the 1st resistance.
Pivot: 1.3701
Supporting reasons: Identified as a pullback support level, indicating a historical area where buying interest has emerged.
1st support: 1.3656
Supporting reasons: Recognized as another pullback support level, reinforcing the potential for buyers to enter at this price point.
1st resistance: 1.3781
Supporting reasons: Noted as an overlap resistance level, suggesting a significant area where selling pressure may emerge and potentially limit further upward movement.
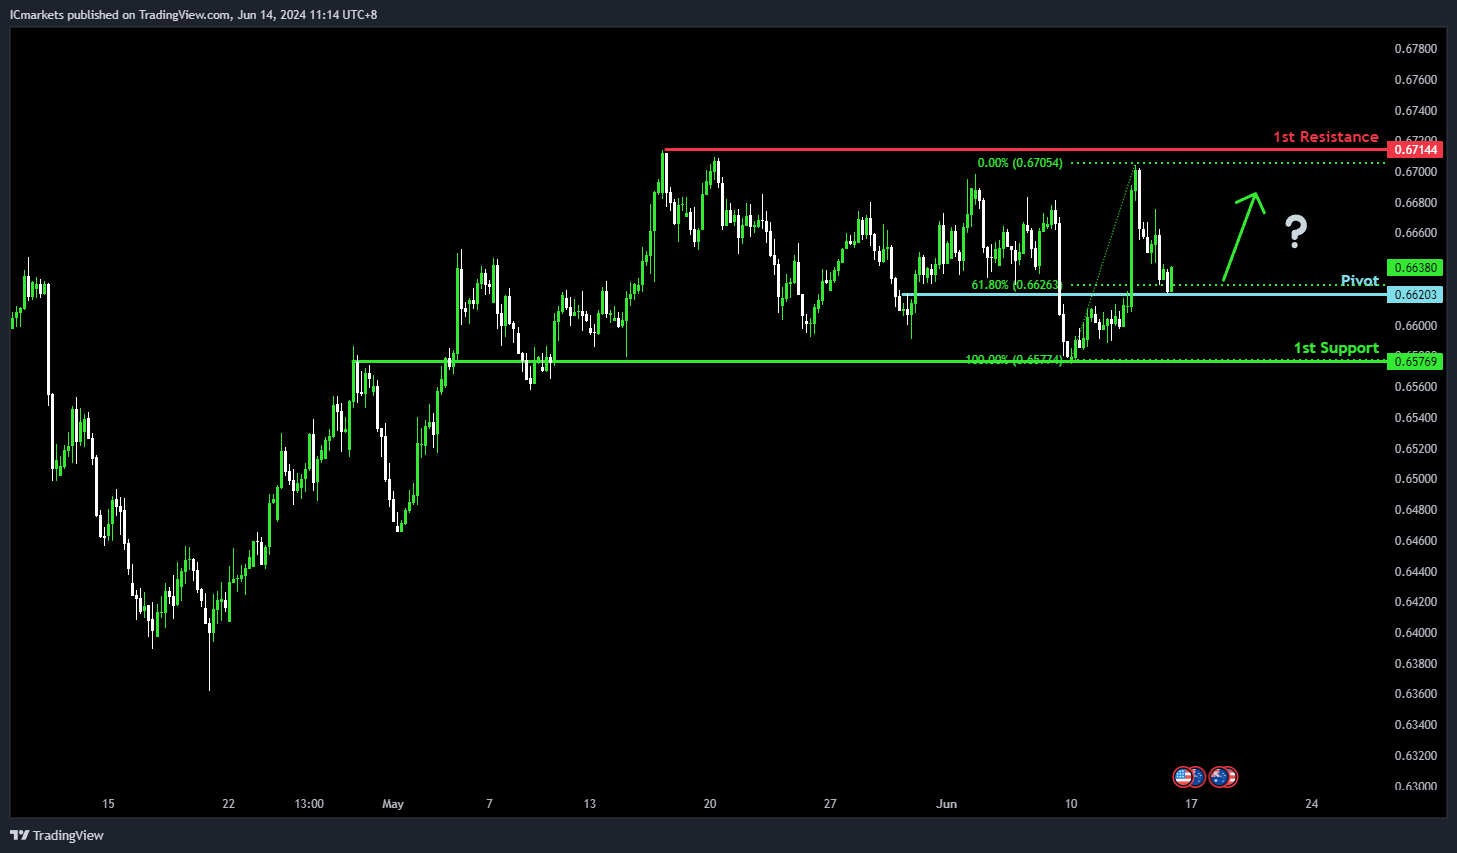
AUD/USD:
Potential Direction: Bullish
Overall momentum of the chart: Bullish
Price could potentially make a bullish bounce off the pivot and head towards the 1st resistance.
Pivot: 0.6620
Supporting reasons: Identified as an overlap support level and coinciding with the 61.80% Fibonacci Retracement, suggesting a strong historical and technical support zone.
1st support: 0.6576
Supporting reasons: Noted as another overlap support level, reinforcing the significance of this area where buyers have historically entered the market.
1st resistance: 0.6714
Supporting reasons: Recognized as a swing high resistance level, indicating a significant area where selling pressure may emerge and potentially halt further upward movement.
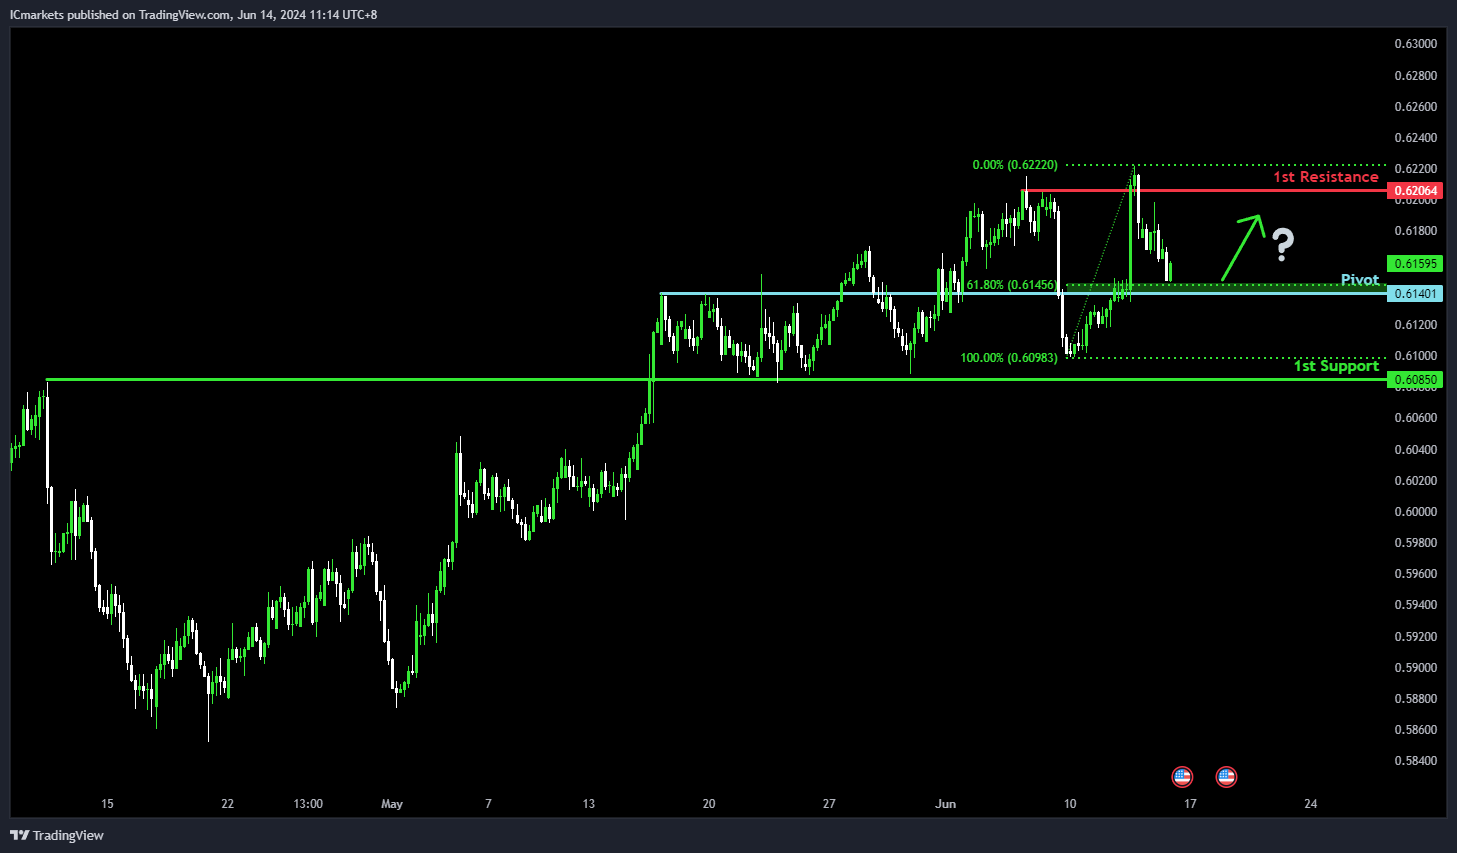
NZD/USD
Potential Direction: Bullish
Overall momentum of the chart: Bullish
Price could potentially make a bullish bounce off the pivot and head towards the 1st resistance.
Pivot: 0.6140
Supporting reasons: Identified as a pullback support level and coinciding with the 61.80% Fibonacci Retracement, suggesting a strong historical and technical support zone.
1st support: 0.6085
Supporting reasons: Noted as an overlap support level, reinforcing the significance of this area where buyers have historically entered the market.
1st resistance: 0.6206
Supporting reasons: Recognized as a multi-swing high resistance level, indicating a significant area where selling pressure may emerge and potentially halt further upward movement.
US30 (DJIA):
Potential Direction: Bullish
Overall momentum of the chart: Bullish
Price could potentially make a bullish bounce off the pivot and head towards the 1st resistance.
Pivot: 38641.99
Supporting reasons: Identified as an overlap support level and coinciding with the 61.80% Fibonacci Retracement, indicating a strong historical and technical support area.
1st support: 38077.26
Supporting reasons: Noted as a multi-swing low support, suggesting a significant historical level where buying interest has previously emerged.
1st resistance: 39038.86
Supporting reasons: Recognized as an overlap resistance level and coinciding with the 50% Fibonacci Retracement, indicating a critical area where selling pressure may intensify and potentially halt further upward movement.
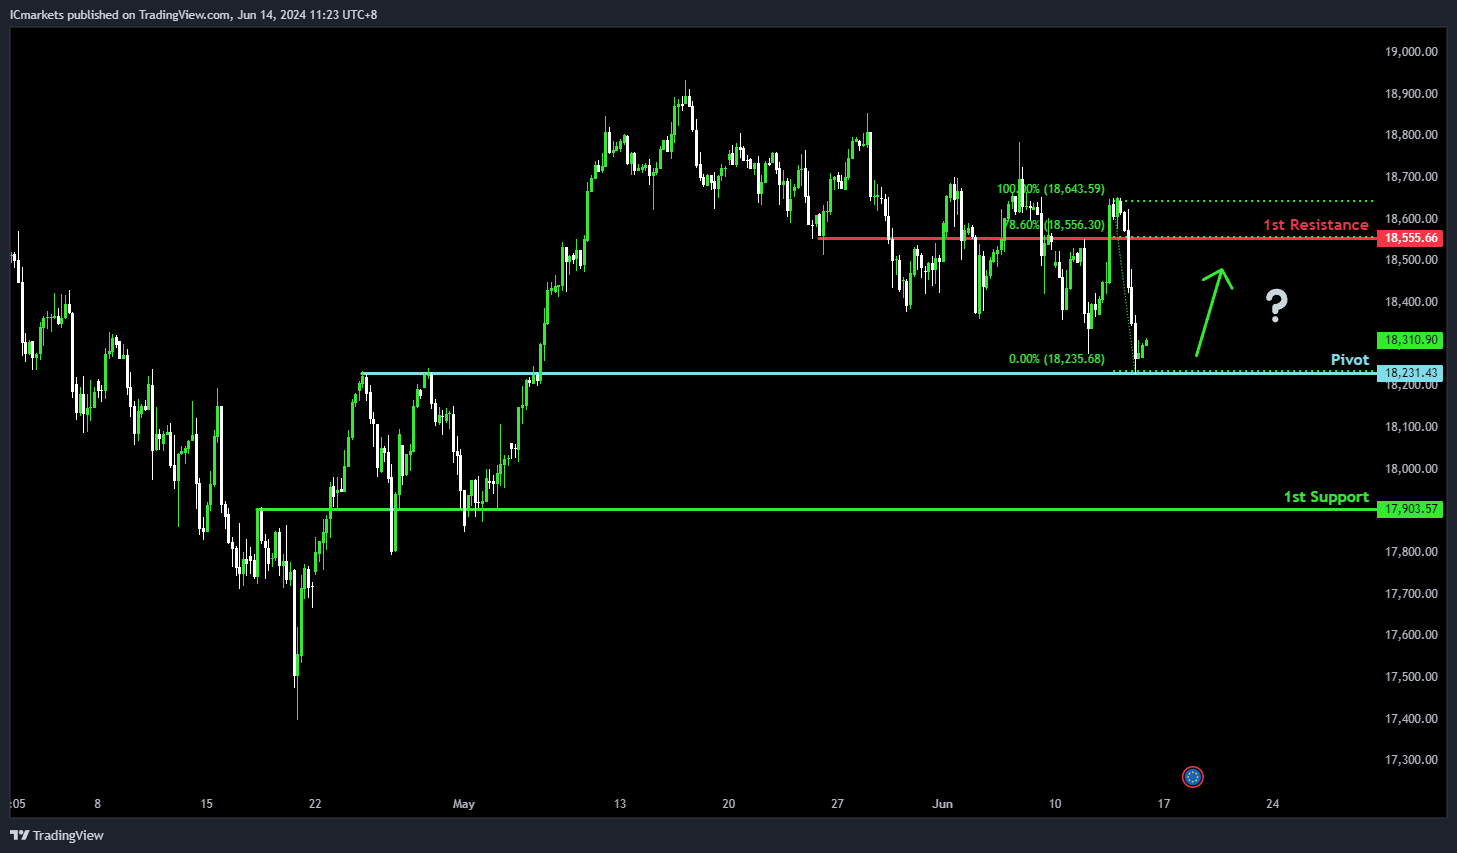
DE40 (DAX):
Potential Direction: Bullish
Overall momentum of the chart: Bullish
Price could potentially make a bullish bounce off the pivot and head towards the 1st resistance.
Pivot: 18231.43
Supporting reasons: Identified as an overlap support level.
1st support: 17903.57
Supporting reasons: Noted as another overlap support level.
1st resistance: 18555.66
Supporting reasons: Recognized as pullback resistance, coinciding with the 78.60% Fibonacci retracement level.
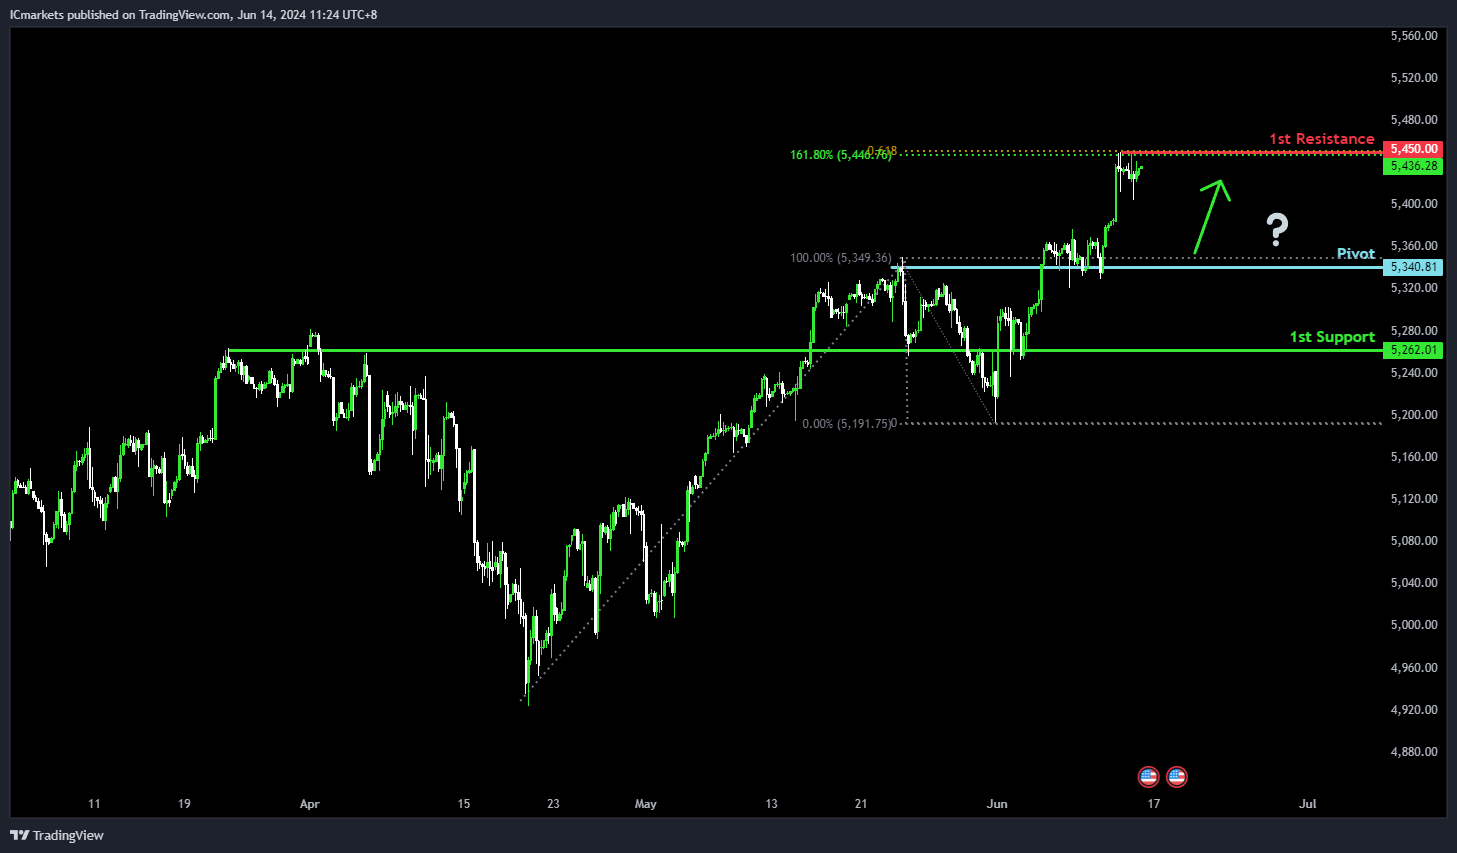
US500 (S&P 500):
Potential Direction: Bullish
Overall momentum of the chart: Bullish
Price could potentially make a bullish bounce off the pivot and head towards the 1st resistance.
Pivot: 5340.81
Supporting reasons: Identified as an overlap support level.
1st support: 5262.01
Supporting reasons: Identified as another overlap support level.
1st resistance: 5450.00
Supporting reasons: This level is identified by the confluence of the 161.80% Fibonacci Extension and the 61.80% Fibonacci Projection, indicating a significant area where selling pressure may intensify.
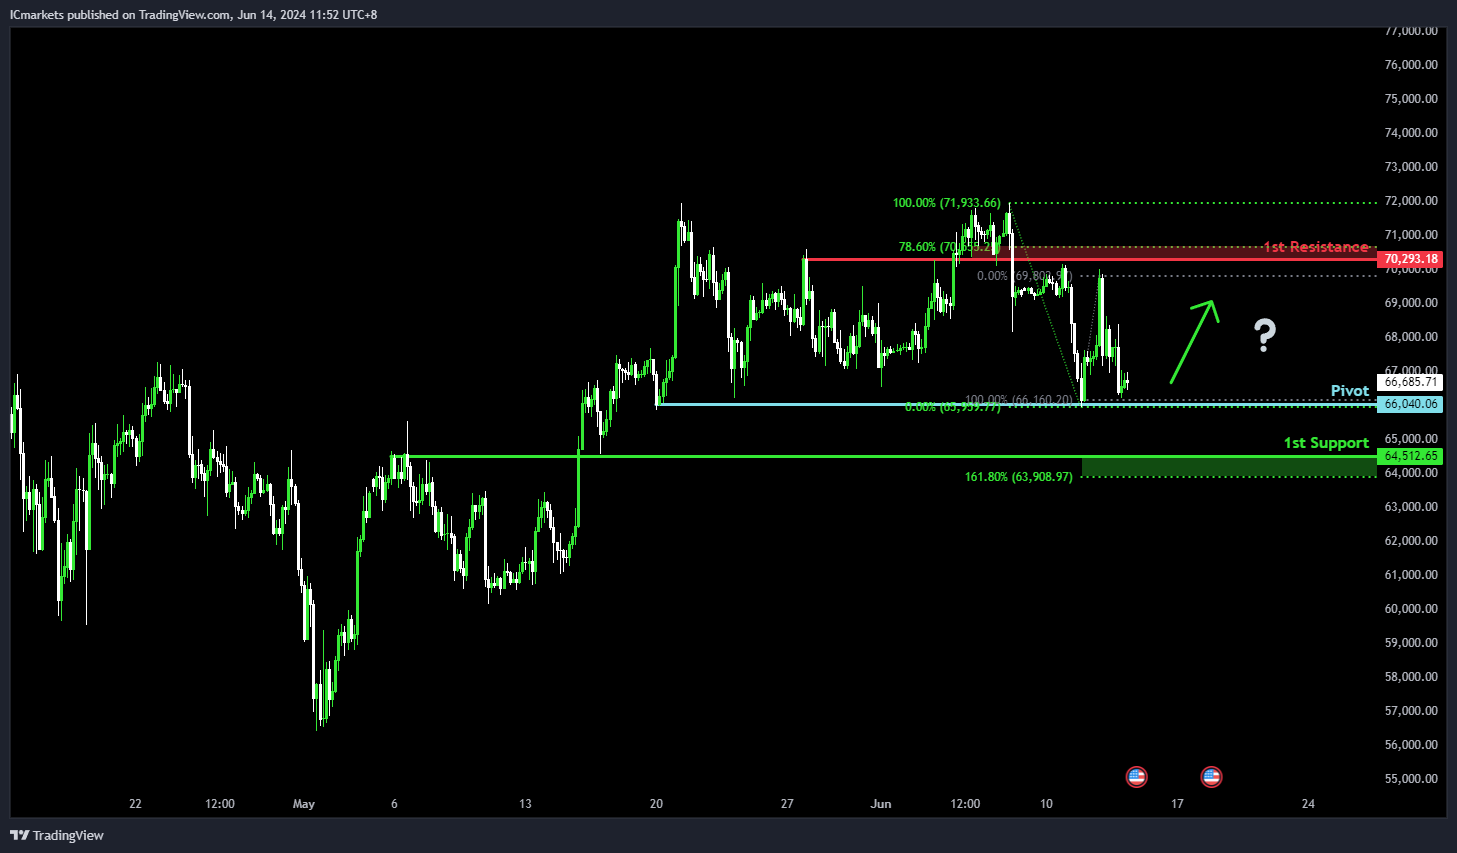
BTC/USD (Bitcoin):
Potential Direction: Bullish
Overall momentum of the chart: Bullish
Price could potentially make a: Bullish bounce-off pivot and head toward 1st resistance
Pivot: 66,040.06
Supporting reasons: Identified as multi-swing low support, indicating a historical level where buying interest has previously emerged.
1st support: 64,512.65
Supporting reasons: Identified as an overlap support, suggesting a significant level where buying pressure could potentially increase.
1st resistance: 70,293.18
Supporting reasons: Identified as an overlap resistance and coinciding with the 78.60% Fibonacci Retracement level, indicating a critical area where selling pressure may intensify.
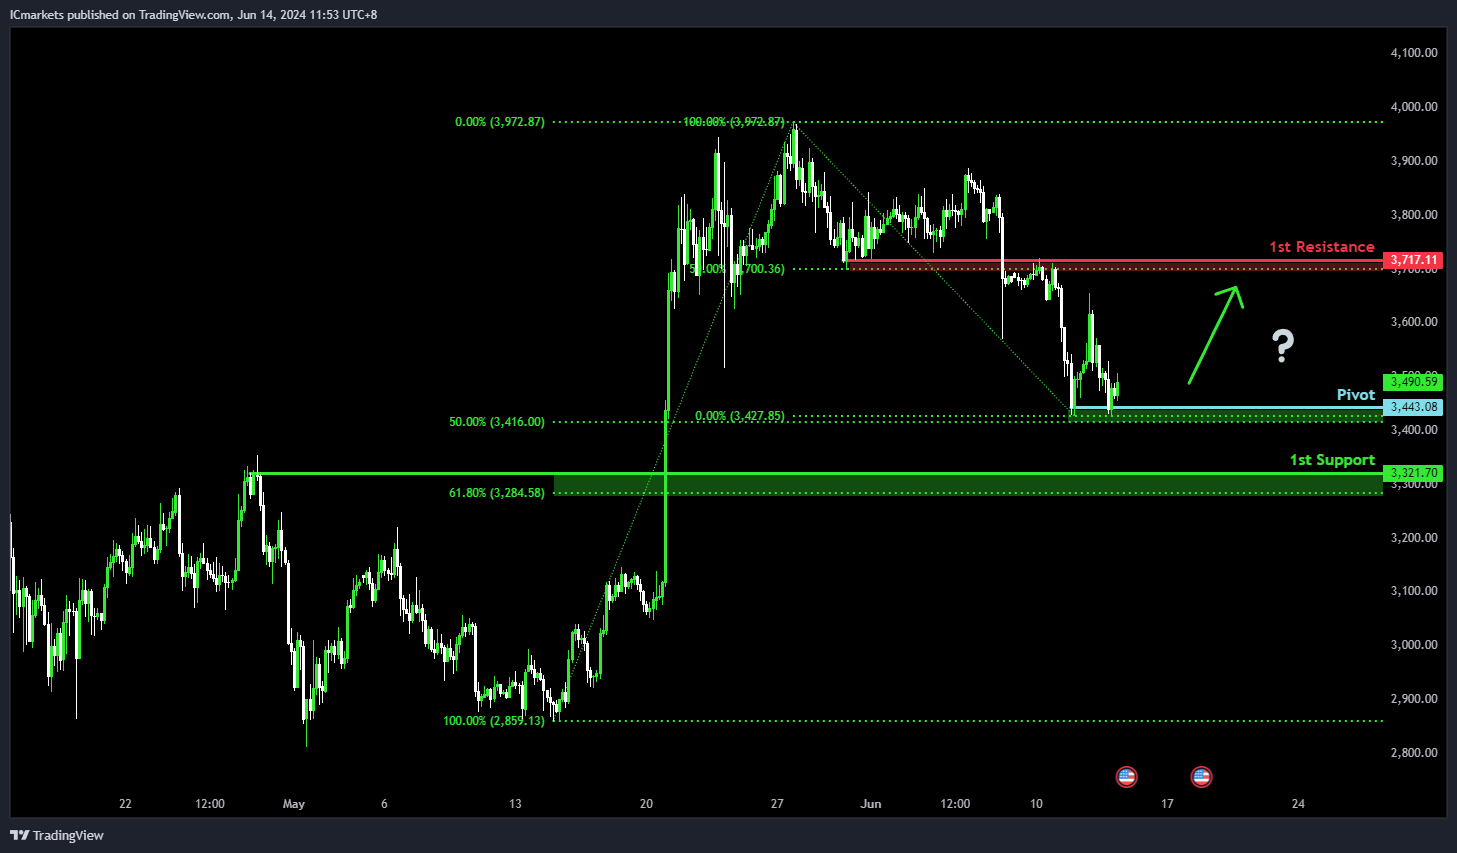
ETH/USD (Ethereum):
Potential Direction: Bullish
Overall momentum of the chart: Bearish
Price could potentially make a: Bullish bounce-off pivot and head towards 1st resistance
Pivot: 3,443.08
Supporting reasons: Identified as multi-swing low support, coinciding with the 50% Fibonacci Retracement level, indicating a strong historical and technical support area.
1st support: 3,321.70
Supporting reasons: Identified as pullback support, coinciding with the 61.80% Fibonacci Retracement level, suggesting a significant area where buying interest could emerge to support a rebound.
1st resistance: 3,717.11
Supporting reasons: Identified as an overlap resistance, coinciding with the 50% Fibonacci Retracement level, marking a significant barrier where selling pressure may intensify and potentially halt further upward movements.
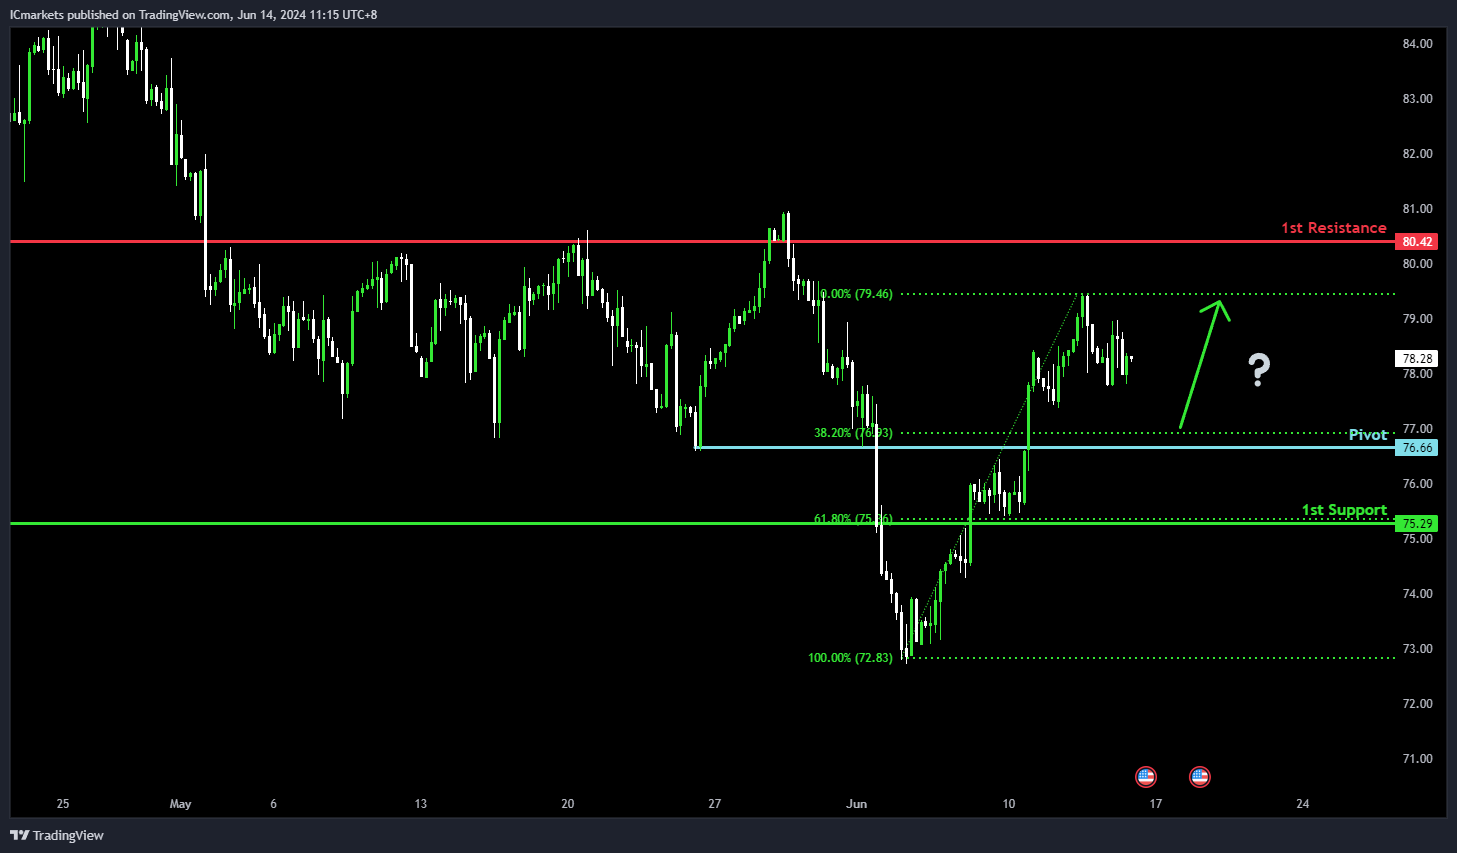
WTI/USD (Oil):
Potential Direction: Bullish
Overall momentum of the chart: Bullish
Price could potentially make a bullish bounce off pivot and heads towards 1st resistance.
Pivot: 76.66
Supporting reasons: Identified as pullback support, coinciding with the 38.20% Fibonacci Retracement level.
1st support: 75.29
Supporting reasons: Identified as an overlap support level, coinciding with the 61.80% Fibonacci Retracement level.
1st resistance: 80.42
Supporting reasons: Recognized as an overlap resistance level, indicating a significant area where selling pressure may emerge.
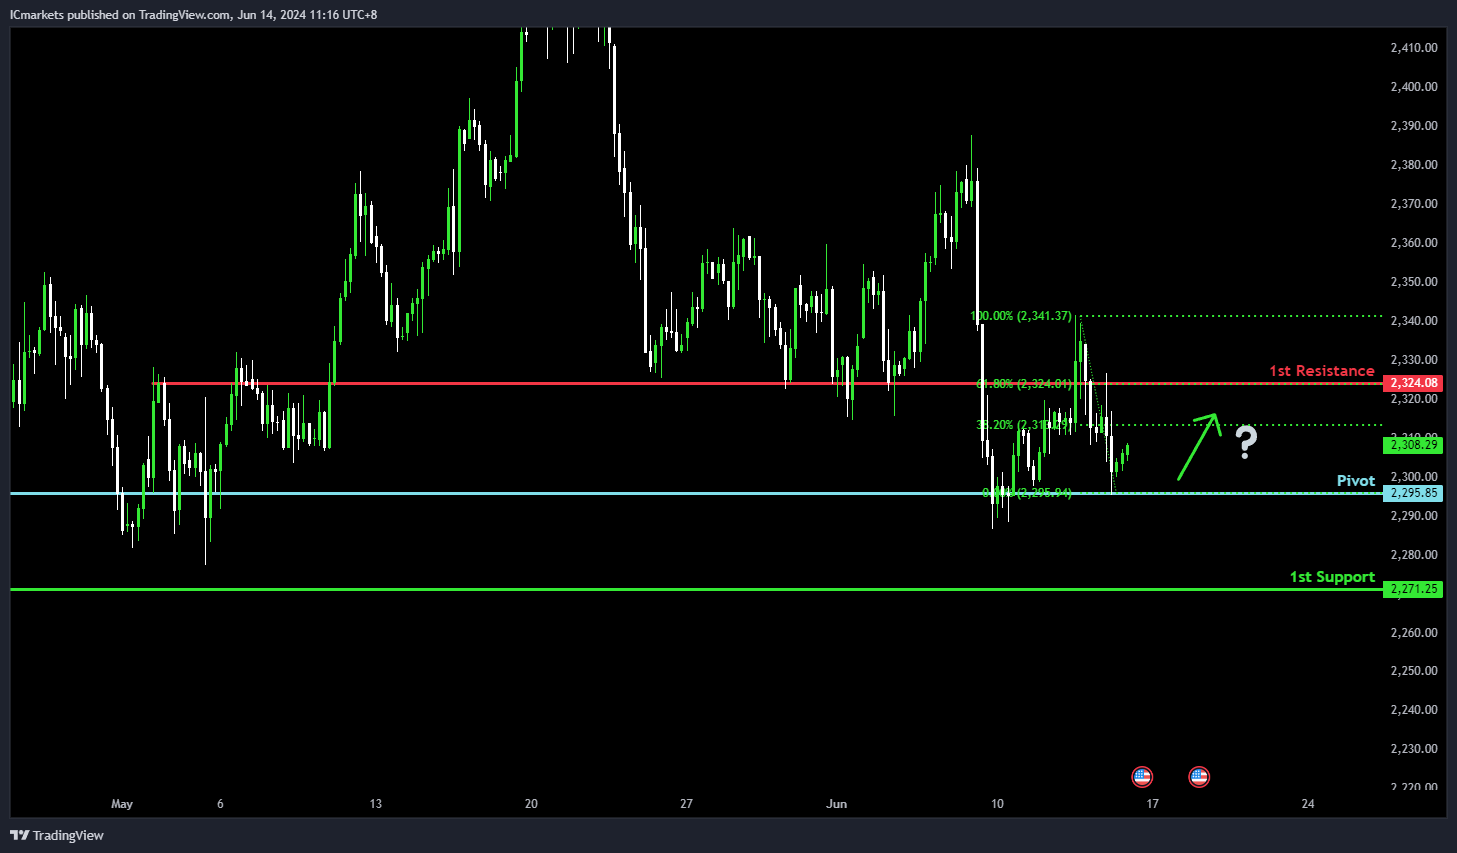
XAU/USD (GOLD):
Potential Direction: Bullish
Overall momentum of the chart: Bearish
Price could potentially make a: Bullish bounce-off pivot and head towards 1st resistance
Pivot: 2,295.00
Supporting reasons: Identified as an overlap support level, indicating a historical area where buying interest has previously emerged.
1st support: 2,271.25
Supporting reasons: Identified as another overlap support level, reinforcing the significance of this zone as a potential area for buyers to step in.
1st resistance: 2,324.08
Supporting reasons: Identified as an overlap resistance level, coinciding with the 61.80% Fibonacci Retracement, suggesting a critical area where selling pressure may emerge and potentially stall further upward movements.
The accuracy, completeness and timeliness of the information contained on this site cannot be guaranteed. IC Markets does not warranty, guarantee or make any representations, or assume any liability regarding financial results based on the use of the information in the site.
News, views, opinions, recommendations and other information obtained from sources outside of www.icmarkets.com.au, used in this site are believed to be reliable, but we cannot guarantee their accuracy or completeness. All such information is subject to change at any time without notice. IC Markets assumes no responsibility for the content of any linked site.
The fact that such links may exist does not indicate approval or endorsement of any material contained on any linked site. IC Markets is not liable for any harm caused by the transmission, through accessing the services or information on this site, of a computer virus, or other computer code or programming device that might be used to access, delete, damage, disable, disrupt or otherwise impede in any manner, the operation of the site or of any user’s software, hardware, data or property.


