A note on lower timeframe confirming price action…
Waiting for lower timeframe confirmation is our main tool to confirm strength within higher timeframe zones, andhas really been the key to our trading success. It takes a little time to understand the subtle nuances, however, as each trade is never the same, but once you master the rhythm so to speak, you will be saved from countless unnecessary losing trades. The following is a list of what we look for:
- A break/retest of supply or demand dependent on which way you’re trading.
- A trendline break/retest.
- Buying/selling tails – essentially we look for a cluster of very obvious spikes off of lower timeframe support and resistance levels within the higher timeframe zone.
- Candlestick patterns. We tend to only stick with pin bars and engulfing bars as these have proven to be the most effective.
EUR/USD:
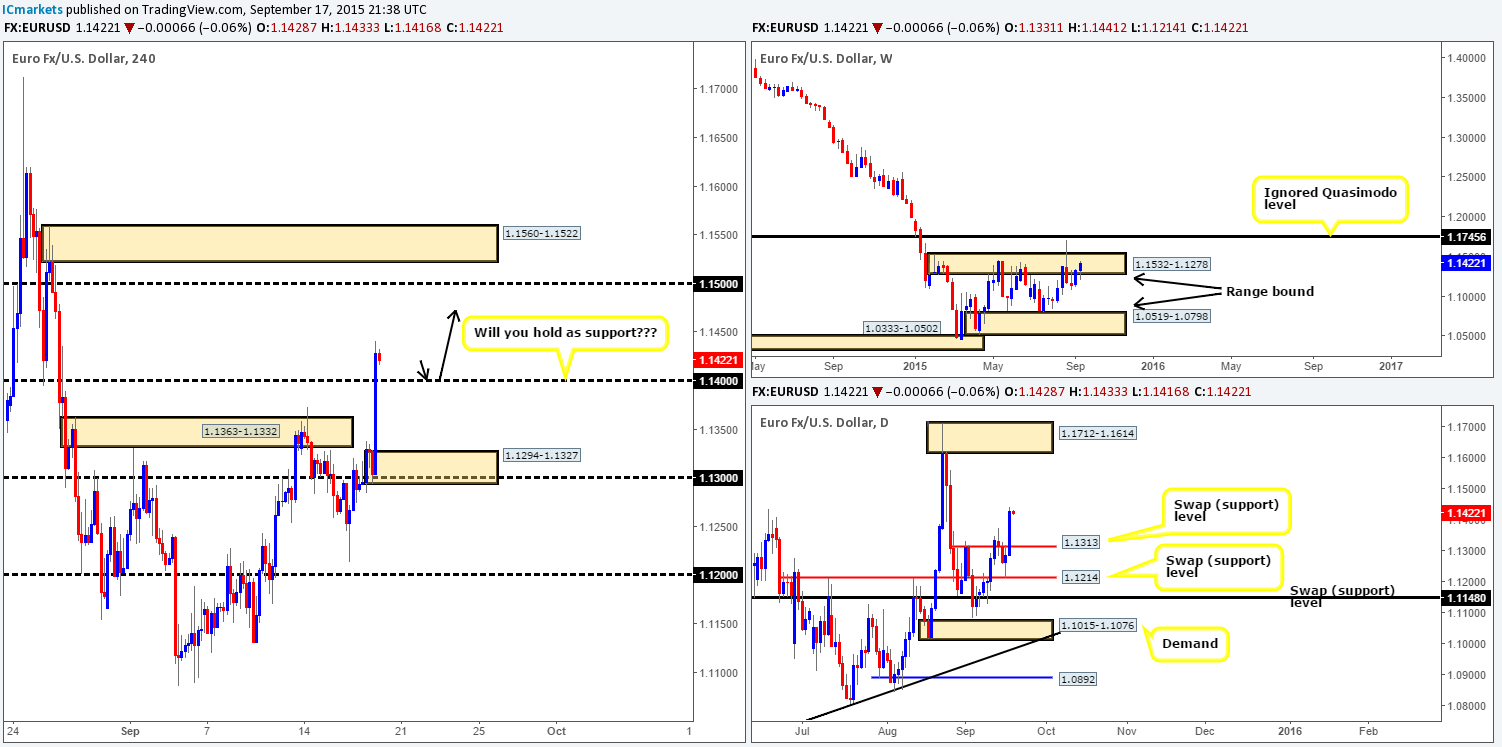
The FED’s decision finally arrived and it was more dovish than expected, as interest rates remained unchanged. This, as you can see, sent the EUR currency soaring higher, taking out psychological resistance 1.1400 and reaching highs of 1.1441 on the day.
Technically, this recent upsurge has opened up the floodgates for price to run higher on both the daily and 4hr charts. The 4hr shows room to continue up to 1.1500, followed closely by supply sitting just above it at 1.1560-1.1522, while the daily action boasts a clear run up to supply coming in at 1.1712-1.1614. The only drawback here is the weekly scale. Price is currently trading within supply at 1.1532-1.1278. Despite this though, there has not really been much noteworthy selling interest registered here since price connected with it over three weeks ago…
Therefore, should price retest 1.1400 as support going into today’s trade, and show some form of lower timeframe buying strength, we’d feel relatively confident taking a long from here, targeting 1.1500. However, this is not a ‘set and forget’ type of trade. If all goes to plan, we intend to trail our stop behind lower timeframe supports as and when they form since we absolutely detest taking a loss when a win was possible.
Levels to watch/live orders:
- Buys:1.1400 [Tentative – confirmation required] (Stop loss: dependent on where one confirms this level).
- Sells:Flat (Stop loss: N/A).
GBP/USD:
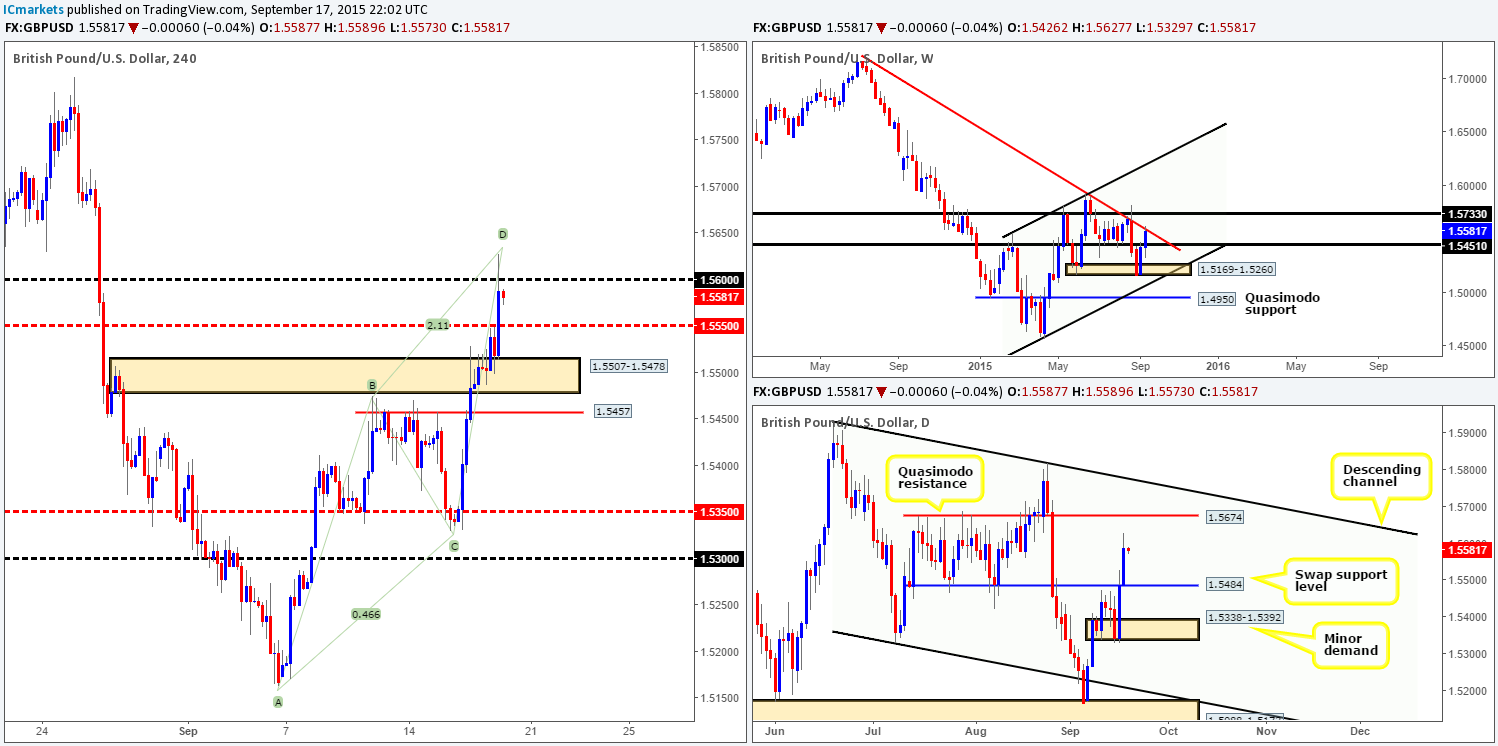
Cable also posted healthy gains during yesterday’s trade on the back of the FED’s comments, marking the second consecutive bull day for this market. Unlike the EUR/USD, however, the GBP gave back close to forty pips on the day as price connected with psychological resistance 1.5600.
In light of price trading just below 1.5600 now, do we believe the GBP is going to see a pullback in today’s trade? It’s very possible in our opinion. Here’s why:
- The recent surge in buying has brought price into the jaws of a major weekly down trendline taken from the high 1.7166.
- Space is seen for price to move lower on the 4hr chart down to at least the mid-level number 1.5550.
- Very close to an AB=CD pattern completion point at 1.5635.
Yetin spite of the above,the daily scale shows that there is not really any obvious resistance overhead until a Quasimodo level at 1.5674. Therefore, if you’re considering shorts, you might want to wait for lower timeframe confirmation before jumping in. For us, personally, we have little interest in shorting this market even though we believe it will decline short-term. The reason for why is simple – there is only around thirty pips profit on the table down to 1.5550. To trade this, we’d need to pin-point a relatively lower timeframe setup that would allow us a tight stop, and as far as we see, this could be difficult since price is already trading twenty or so pips below 1.5600.
Levels to watch/ live orders:
- Buys: Flat (Stop loss: N/A).
- Sells: Flat (Stop loss: N/A).
AUD/USD:
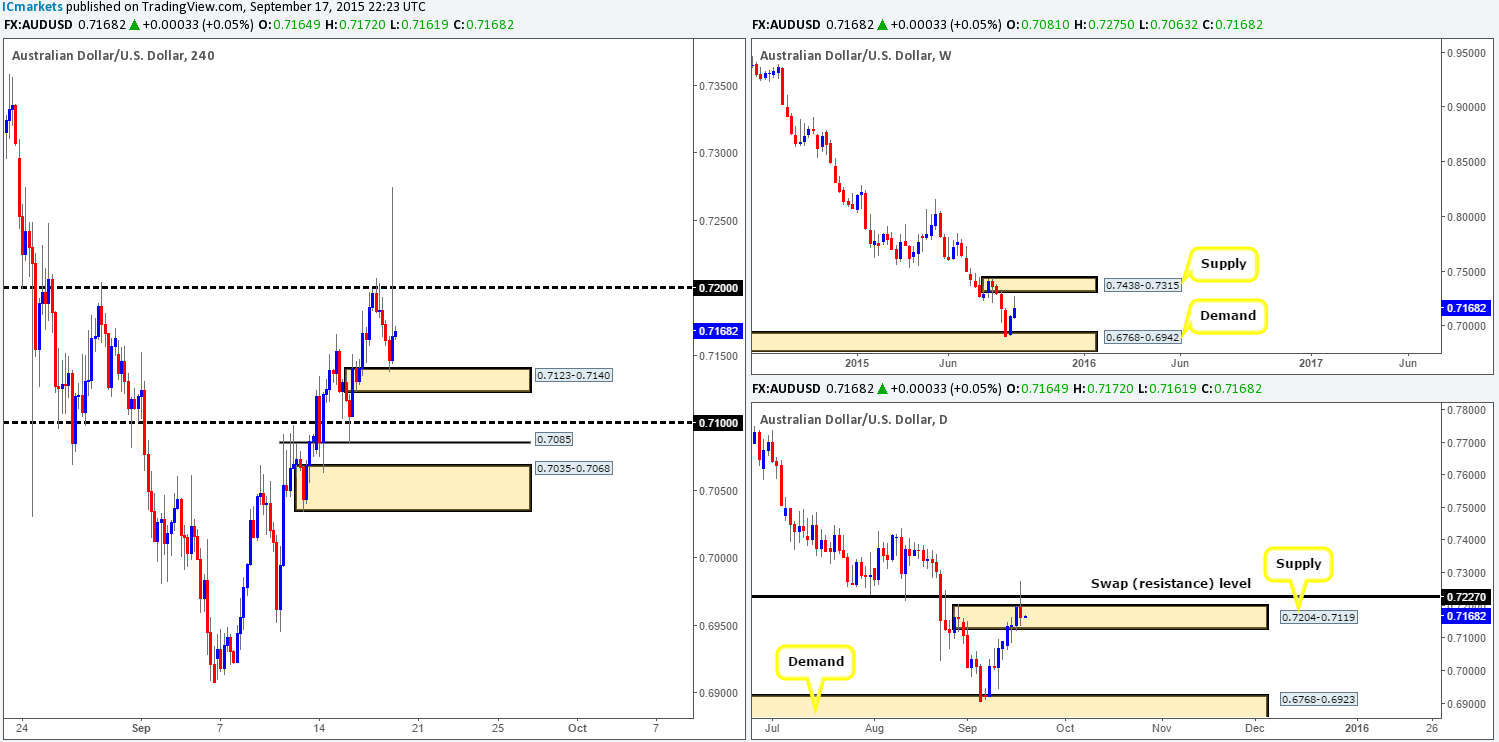
The AUD/USD did initially benefit from the U.S. dollar weakness, but gains quickly faded after reaching highs of 0.7275. At the time of writing, price remains holding firm above 4hr demand at 0.7123-0.7140.
This quick surge of buying saw price not only pierce through both a daily supply zone at 0.7204-0.7119, but also a daily swap (resistance) level at 0.7227 as well. And, if you scan above to the weekly chart, you’ll also notice it came close to connecting with weekly supply at 0.7438-0.7315 – very interesting.
With the above in mind, what do we believe is in store for this pair today? Well, we certainly see potential for price to reconnect with 0.7200, as it has been a well-respected number in the past. However, this is not really something that interests us due to it only being a thirty or so pip move from current prices. Beyond this though, it is very difficult to tell the Aussie’s next move. The reasons for why are simply because there is the possibility that price may continue to sell-off from the daily areas just mentioned above. On the other hand, there is also a chance that price may want to rally higher to shake hands with the aforementioned weekly supply zone. Therefore, as you can see, there is conflicting signals being seen at the minute. Because of this, our team has decided it’s best to remain flat going into today’s trade.
Levels to watch/ live orders:
- Buys: Flat (Stop loss: N/A).
- Sells:Flat (Stop loss: N/A).
USD/JPY:
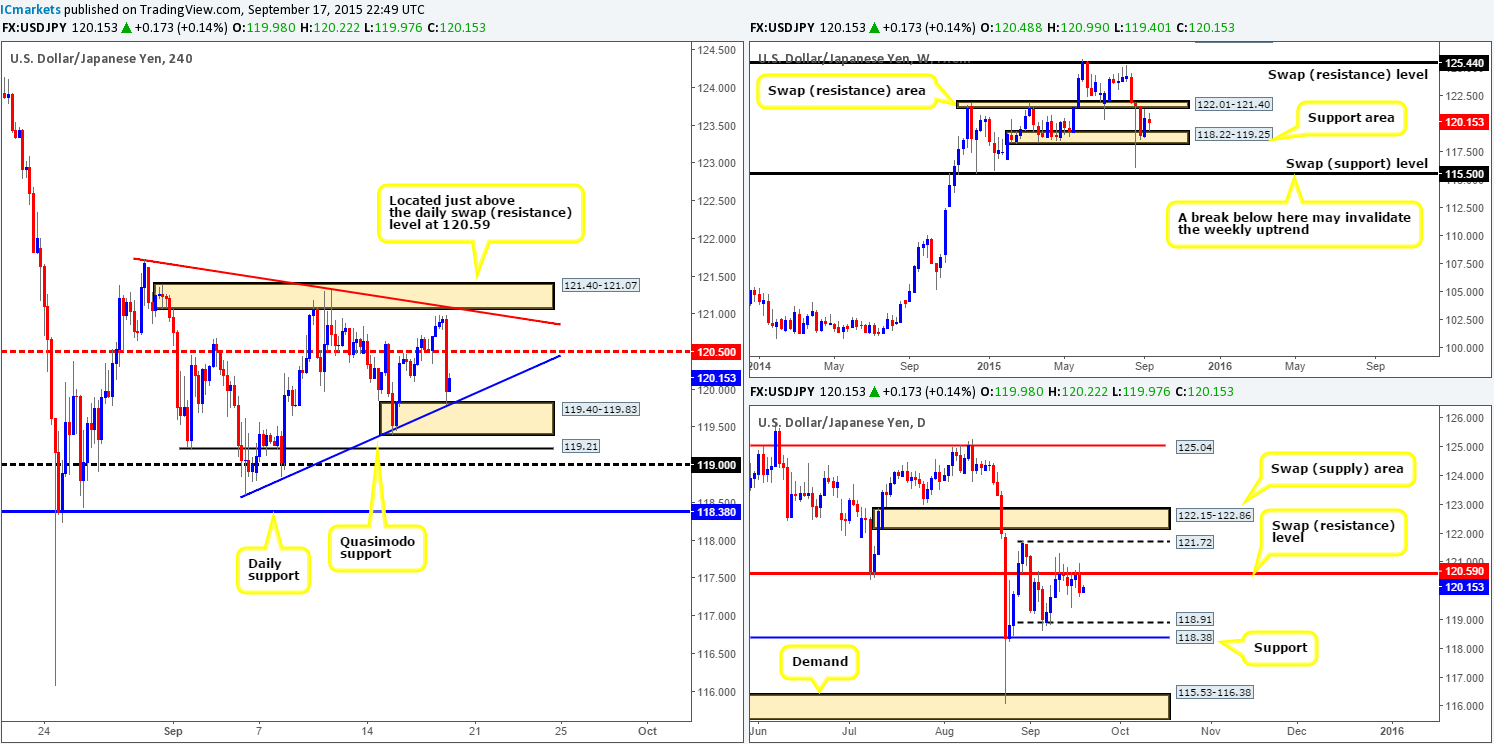
Recent events on the USD/JPY reveal price action took a tumble on the back of recent FED comments. This move began from just below 4hr supply at 121.40-121.07 and ended with price slamming into 4hr demand at 119.40-119.83, which, as you can see, was defended into the close 119.98. In addition to the above, notice the two 4hr converging trendlines (121.72/118.83) that support the above said 4hr zones. This looks very much like a compressing 4hr pennant formation currently brewing here.
Like the GBP/USD and AUD/USD, this pair is also trading in tight space. Price has only around thirty or so pips room to move higher until 120.50, which has potential to provide resistance to this market – not really a tradable move as per our trading plan.
With price still seen holding below the daily swap (resistance) level at 120.59, there’s a chance the market could breakout below the current 4hr pennant formation. Nevertheless, there are a number of supports lurking just below current 4hr demand, so even with a breakout lower, selling into these barriers is not really something we would be keen on!
So, to conclude, our team’s position will remain flat going into trade today. This will not change unless we see price rally up to the aforementioned 4hr supply zone. Shorts from this area look appealing considering where price is positioned on the daily scale (see above).
Levels to watch/ live orders:
- Buys:Flat (Stop loss: N/A).
- Sells: 121.40-121.07 [Tentative – confirmation required] (Stop loss: dependent on where one confirms this level).
USD/CAD:
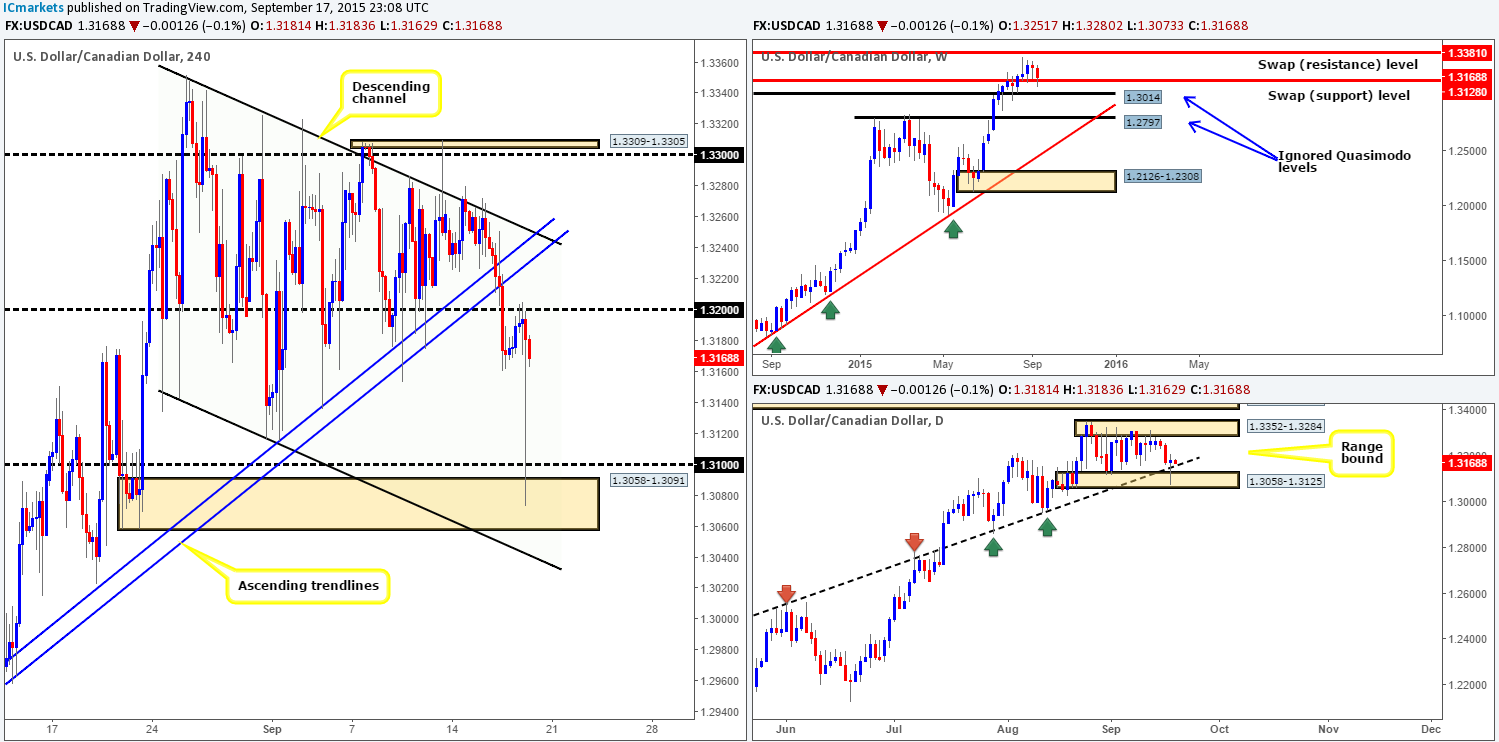
Similar to the AUD/USD pair, the Loonie initially fell on FED comments from the underside of 1.3200 down to 4hr demand at 1.3058-1.3091, but quickly clawed its way back up to where the sell-off began. For those who read our previous report http://www.icmarkets.com/blog/thursday-17th-september-several-high-impacting-events-set-to-hit-markets-today-remain-vigilant/ you may recall us mentioning to watch for lower timeframe confirmed shorts on any retest seen of 1.3200. Well done to any of our readers who managed to catch some of this FED-driven move yesterday!
At first glance, we were considering shorting this pair today judging by 4hr structure. However, upon scanning the higher timeframes, we can see both the weekly and daily charts are trading from support right now. On the weekly, price is lurking above a swap support barrier at 1.3128, while on the daily; price has beautifully spiked into not only an ascending trendline (1.2537), but also demand at 1.3058-1.3125 as well.
The above is not to say that price will not sell-off today, it is just we would not really feel comfortable selling now knowing what’s lurking below in the bigger picture. With that being said, should price close above 1.3200, we’d be all over any retest seen at this number (confirmation required), eyeing the upper limit of the 4hr descending channel (1.3352) as our first take-profit area. It will be interesting to see how this plays out!
Levels to watch/ live orders:
- Buys:Watch for offers at 1.3200 to be consumed and then look to enter on any retest seen at this number (confirmation required).
- Sells: Flat (Stop loss: N/A).
USD/CHF:
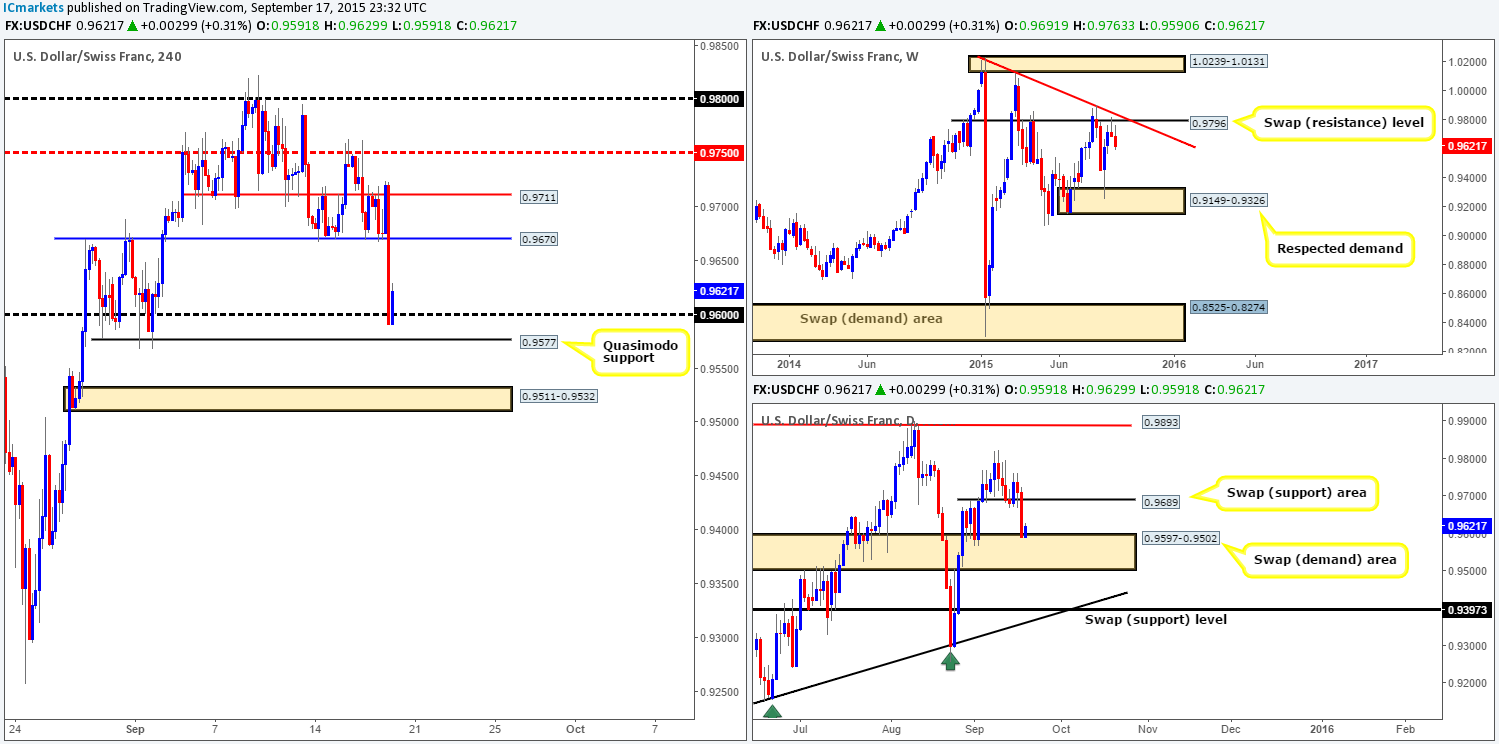
For those who read our previous report http://www.icmarkets.com/blog/thursday-17th-september-several-high-impacting-events-set-to-hit-markets-today-remain-vigilant/, you may remember us saying to watch for price to break below 0.9670 – a 4hr ignored Quasimodo level. As we can all see, price did exactly that thanks to the FED but unfortunately did not see any retest of this number to allow us to short.
In view of price currently trading from the 0.9600 region now, would we consider this a stable enough platform in which to look for confirmed longs from today? From the daily scale, yes, but from the weekly, no. Daily action shows price respecting the top-side of a swap demand area at 0.9597-0.9502, while the weekly chart shows room for price to continue lower all the way down to demand at 0.9149-0.9326.
Therefore, one could look to take a long should price manage to pullback to 0.9600 today. Waiting for confirmation is paramount here though guys seeing as buying from here you’re potentially going up against weekly sellers – trade carefully. Upside targets from 0.9600 falls in at 0.9670, followed closely by 0.9711.
In the event that 0.9600 fails to hold, there is an immediate back-up level waiting just below in the form of a 4hr Quasimodo support at 0.9577. If this also gives way, then this could suggest further downside towards a fresh 4hr demand at 0.9511-0.9532. Assuming that price retests 0.9577 following a break lower, we may, depending on lower timeframe price action, look to short this move since there is clear room for prices to run below 0.9577.
Levels to watch/ live orders:
- Buys:0.9600/0.9577 [Tentative – confirmation required] (Stop loss: dependent on where one finds confirmation).
- Sells: Watch for bids at 0.9577 to be consumed and then look to enter on any retest seen at this number (confirmation required).
DOW 30:
For those who read our previous report on the DOW http://www.icmarkets.com/blog/thursday-17th-september-several-high-impacting-events-set-to-hit-markets-today-remain-vigilant/, you may recall us mentioning that we were interested in shorting this market if price trades deep into 4hr supply at 16943-16827. Price did exactly that, but we were unable to pin-point a setup on the lower timeframes seeing as price reacted so quickly due to FED comments! Too bad!
This move lower saw price drive into a small fresh4hr demand area coming in at 16570-16635, which, at the time of writing, is seen holding firm. However, even though price is currently trading around a potential buy zone right now, where does our team stand in the bigger picture? Up on the weekly timeframe, there still appears to be room for prices to move north up to a swap resistance level at 17135. Meanwhile, down on the daily timeframe, price has recently sold off from a small swap supply area at 16895-17005, and also shows room to continue lower down to 16465 – a swap support level.
Isn’t this a tricky one! Buying from current 4hr demand would place one in-line with weekly flow, but against the daily! The best, and in our opinion, most conservative approach to this market today might be simply to let the lower timeframe price action lead the way from 4hr levels of interest, and only go for small intraday bounces rather than medium-term moves.
Levels we have our eye on for confirmed trades today are as follows:
Buys:
- Current 4hr demand at 16570-16635.
- 4hr swap support barrier at 16519.
- 4hr demand at 16307-16409.
Sells:
- 4hr supply at 16943-16827.
Levels to watch/ live orders:
- Buys:16570-16635 [Tentative – confirmation required] (Stop loss: depends on where one confirms this area) 16519 [Tentative – confirmation required] (Stop loss: depends on where one confirms this level) 16307-16409 [Tentative – confirmation required] (Stop loss: depends on where one confirms this area).
- Sells:16943-16827[Tentative – confirmation required] (Stop loss: depends on where one confirms this area).
XAU/USD: (Gold)
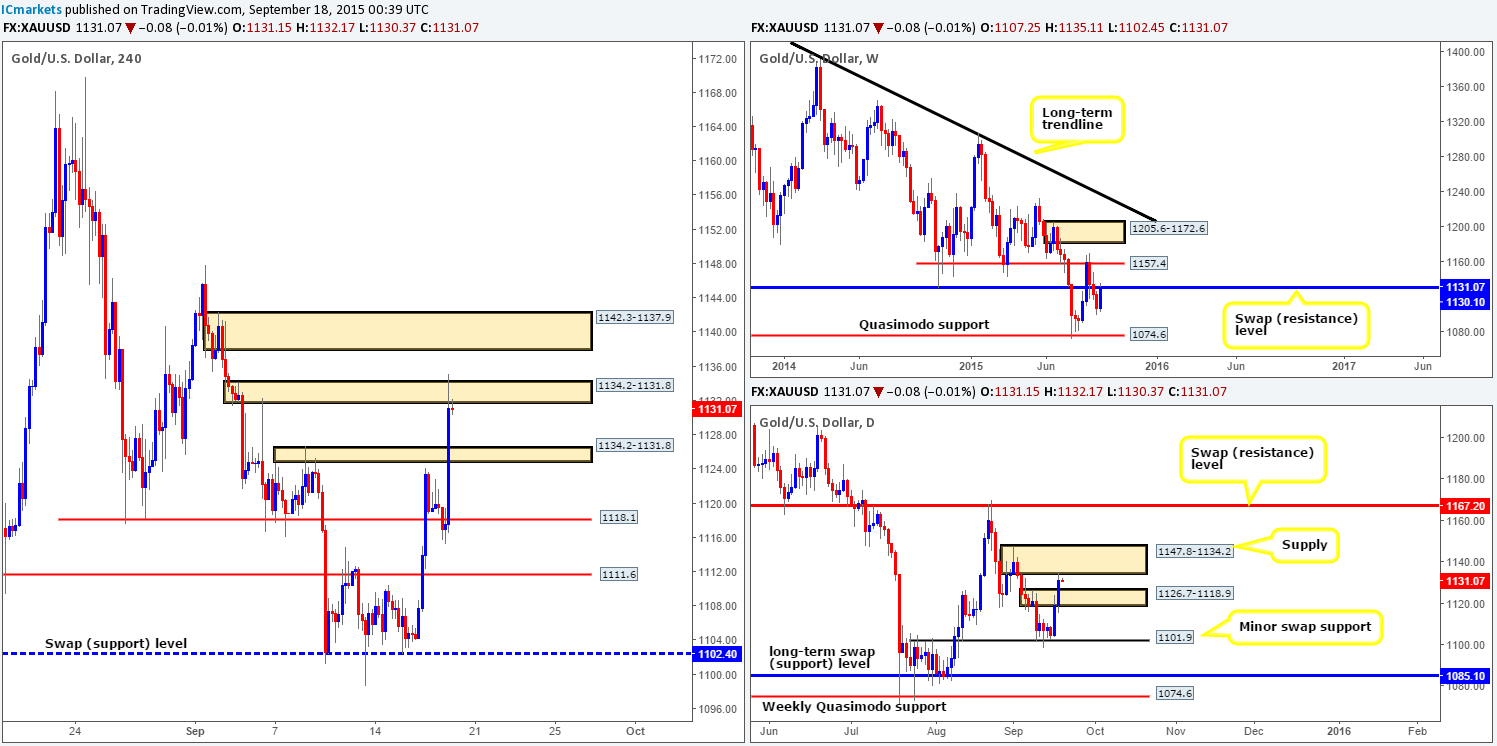
As can be seen from the charts, the Gold market clearly benefited from the recent U.S. dollar weakness. This sent price action above daily supply at 1126.7-1118.9, and also its partner supply on the 4hr timeframe at 1126.5-1124.8. From here, we can now see price nibbling at not only the underside of a weekly swap (resistance) level at 1130.1, but also rebounding from daily supply at 1147.8-1134.2 and a small 4hr supply at 1134.2-1131.8.
So, given the above, we’re certainly not keen on buying this market today that’s for sure! By far,at least from a technical standpoint, selling seems to be the best bet.With that, our objective is simple today. Watch for confirmed shorting opportunities at the current 4hr supply zone. Should all go to plan, we’ll be eyeing the 1134.2-1131.8 4hr area as our immediate take-profit target. The only drawback to this trade is the fact that a large number of sellers may have already been taken out from the current 4hr supply, thus weakening the zone. On that account, do tread carefully here today traders as it is possible we may see a push up to fresh orders at 4hr supply sitting at 1142.3-1137.9 before a sell-off is seen.
Levels to watch/ live orders:
- Buys: Flat (Stop loss: N/A).
- Sells:1134.2-1131.8 [Tentative – confirmation required] (Stop loss: dependent on where one confirms this area) 1142.3-1137.9 [Tentative – confirmation required] (Stop loss: dependent on where one confirms this area).
