A note on lower timeframe confirming price action…
Waiting for lower timeframe confirmation is our main tool to confirm strength within higher timeframe zones, andhas really been the key to our trading success. It takes a little time to understand the subtle nuances, however, as each trade is never the same, but once you master the rhythm so to speak, you will be saved from countless unnecessary losing trades. The following is a list of what we look for:
- A break/retest of supply or demand dependent on which way you’re trading.
- A trendline break/retest.
- Buying/selling tails – essentially we look for a cluster of very obvious spikes off of lower timeframe support and resistance levels within the higher timeframe zone.
- Candlestick patterns. We tend to only stick with pin bars and engulfing bars as these have proven to be the most effective.
EUR/USD:
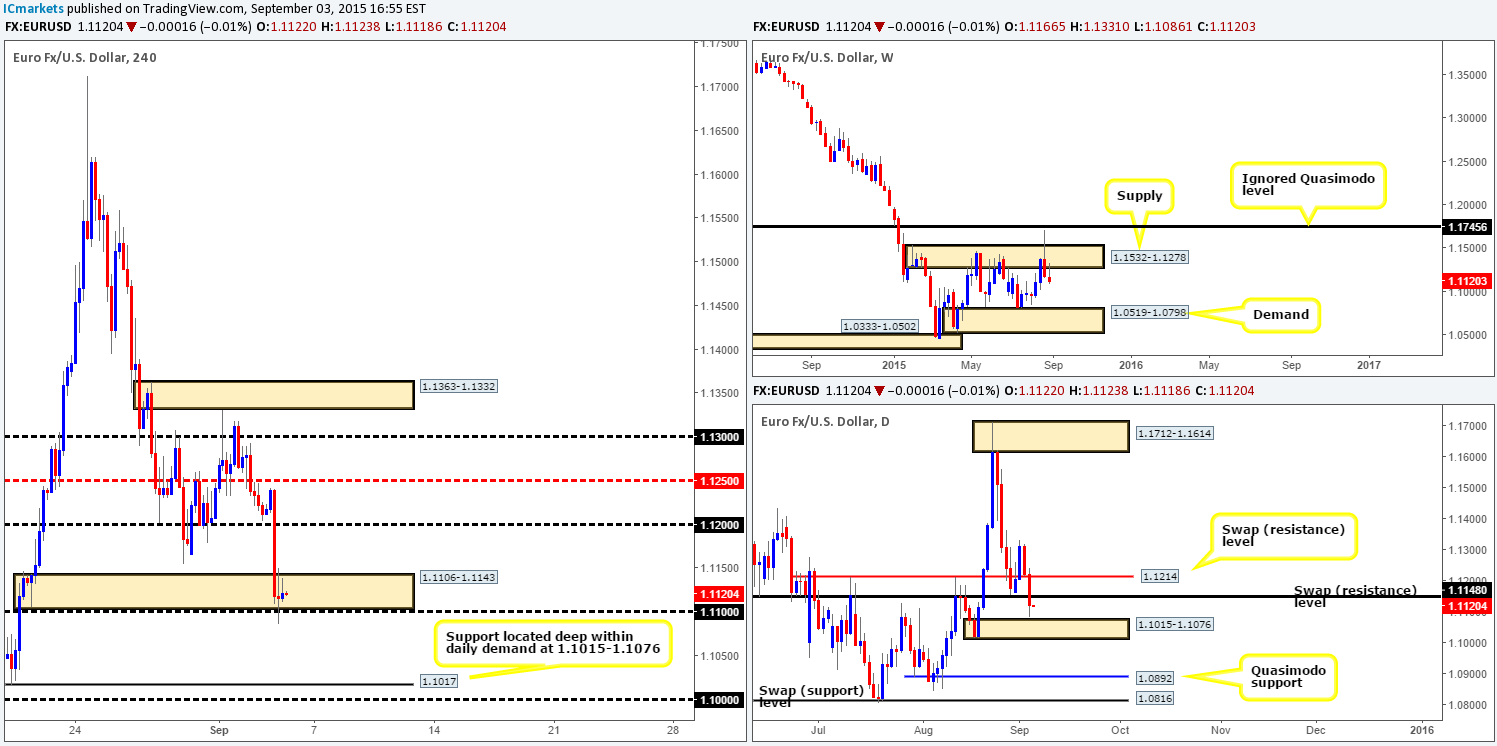
The EUR/USD fell sharply mid-way through London trade after ECB President Draghi warns of risks to the economy and potential increases in QE. This sell-off plowed through psychological support at 1.1200 and ended with price faking below 4hr demand (1.1106-1.1143) into the jaws of 1.1100.
Considering only the 4hr timeframe for the moment, we feel, at least from a technical standpoint, that the EUR could potentially bounce from this barrier today. The reasons? Stops = liquidity. The sell stops taken from below the 4hr demand area provide the market buying liquidity, which could be enough to tempt informed traders to buy.
While this may be plausible, we still have to take the bigger picture into account. Up on the weekly chart, we can see that price has recently pinned the underside of weekly supply at 1.1532-1.1278, and as a result is looking very bearish. Meanwhile, down on the daily chart, two daily swap (support) levels (1.1214/1.1148) were engulfed, which, as you can see, came within a cat’s whisker of hitting clear daily demand at 1.1015-1.1076.
With the above in mind, buying from the aforementioned 4hr demand area no longer seems as attractive as it first did. Although price is effectively bouncing off of the top-side of daily demand right now, it is also lurking close to daily support-turned resistance at 1.1148 – not to mention the fact that the EUR is holding below weekly supply! This –coupled with the mighty NFP due to take the limelight later on today, we’ll patiently stand aside and await more favorable – less cramped price action.
Levels to watch/live orders:
- Buys:Flat (Stop loss: N/A).
- Sells: Flat (Stop loss: N/A).
GBP/USD:
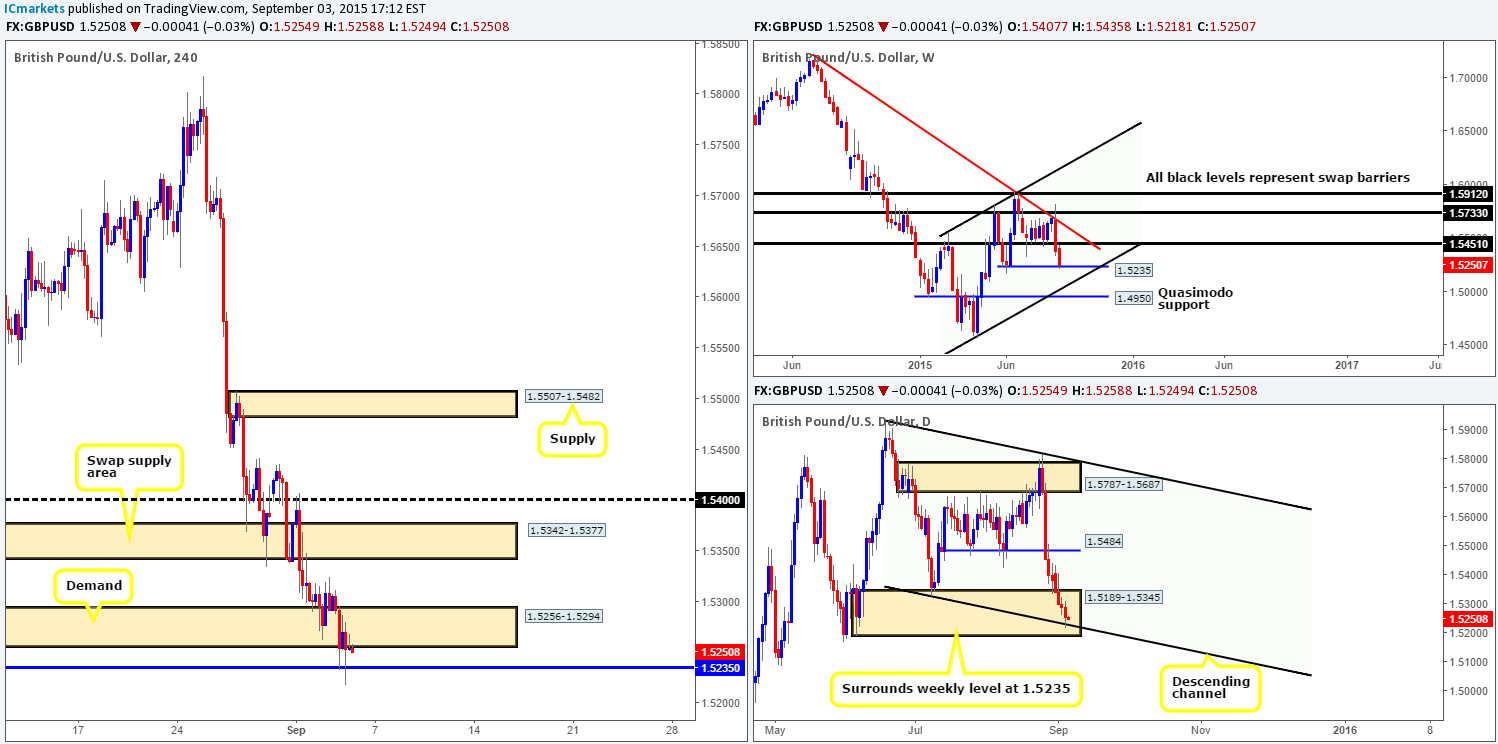
Recent action shows that Cable continued to sink during the course of yesterday’s sessions. This consequently saw price stab through 4hr demand at 1.5256-1.5294, andcross swords with the weekly swap (support) level drawn from 1.5235.
For those who read our previous report on this pair http://www.icmarkets.com/blog/thursday-3rd-september-remain-vigilant-midday-gmt-today-high-impacting-news-set-to-take-center-stage/ you may recall us mentioning to keep an eye on this aforementioned weekly level for potential confirmed buying opportunities. As we can all see, this level is certainly holding price, and why shouldn’t it! This beauty converges with not only a daily descending channel support (1.1329), but also with a large daily demand zone at 1.5189-1.5345. With that being said though, we were looking for more of a convincing reaction from here!
As of now, our team has yet to find any noteworthy lower timeframe price action to enter long from here. We’ll continue watching this level going into today’s sessions, but at the same time will remain aware that this barrier could potentially break later on the back of positive NFP data. Trade carefully guys!
Levels to watch/ live orders:
- Buys: 1.5235 region [Tentative – confirmation required] (Stop loss: dependent on where on confirms this area).
- Sells: Flat (Stop loss: N/A).
AUD/USD:
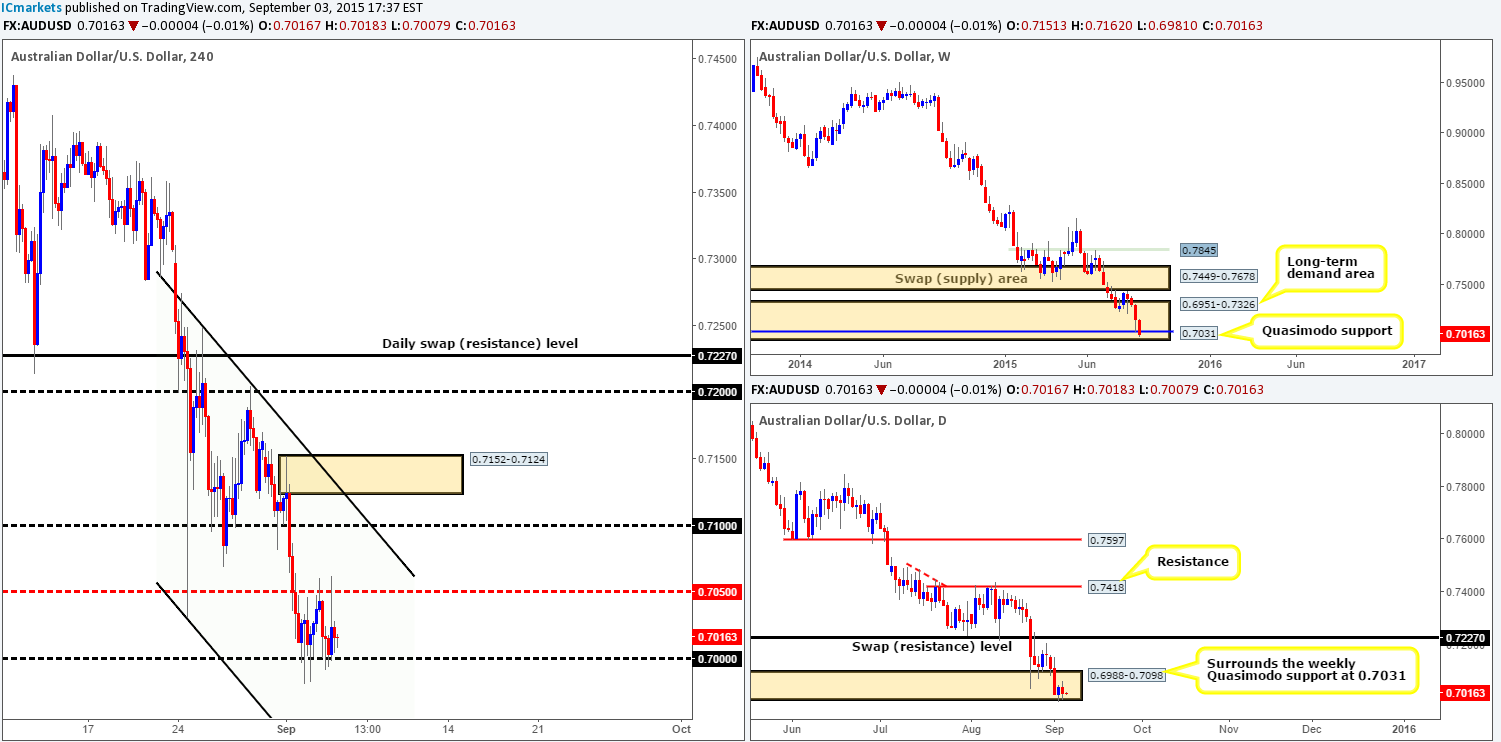
The AUD/USD pair, as you can see,reveals that price is beginning to consolidate within a relatively tight 4hr range between 0.7000 and 0.7050. With this, we feel that the buyers and sellers will likely continue to slug it out between these two limits ahead of the NFP release today.
At the moment, especially from the higher timeframes, things are not looking too good for anyone currently long this market. Both weekly and daily demand (0.6951-0.7326/0.6988-0.7098) appear to be struggling to hold on. Should the NFP number print positive, it could be enough to take out the last remaining bids within the above said higher timeframe areas and push this market to new lows. Conversely, a negative number could see the bulls strengthen potentially forcing price up to the daily swap (resistance) level given at 0.7227. It will be interesting to see how this plays out.
We’re going to approach this market conservatively today and will only begin looking for actionable trades after NFP has finished its show. Levels we’re keeping a tab on for confirmed trades are as follows:
Buys:
- The mid-level number 0.6950.
- The lower limit of the current descending channel taken from the low 0.7030.
Sells:
- The round number 0.7100.
- 4hr supply at 0.6988-0.7098.
- The round number 0.7200.
- The daily swap (resistance) level given at 0.7227.
Levels to watch/ live orders:
- Buys: 0.6950 [Tentative – confirmation required] (Stop loss: dependent on where one confirms this level) Keep an eye on the lower limit of the current descending channel taken from the low 0.7030.
- Sells: 0.7100 [Tentative – confirmation required] (Stop loss: dependent on where one confirms this level) 0.6988-0.7098 [Tentative – confirmation required] (Stop loss: dependent on where one confirms this area) 0.7200 [Tentative – confirmation required] (Stop loss: dependent on where one confirms this level) 0.7227 [Tentative – confirmation required] (Stop loss: dependent on where one confirms this level).
USD/JPY:
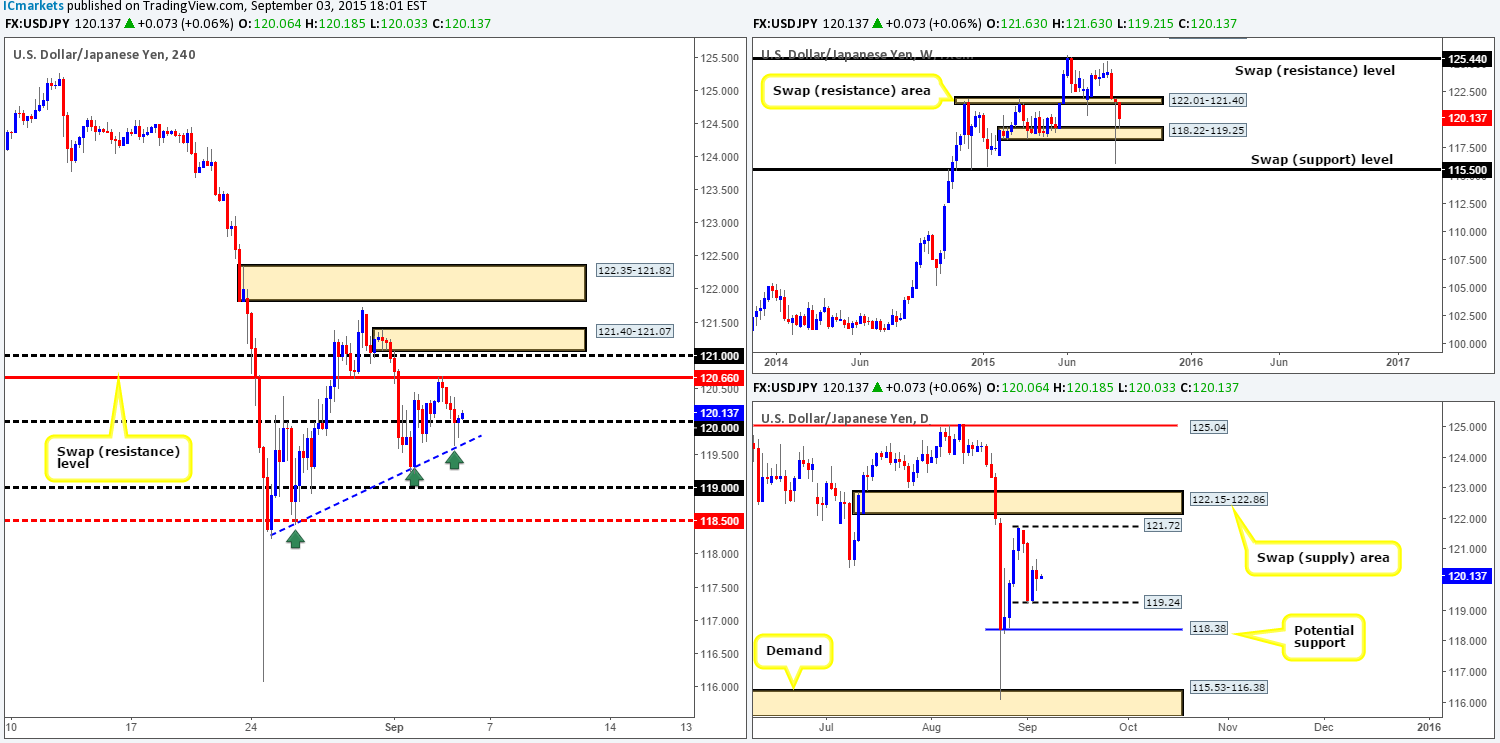
Throughout the course of yesterday’s trade, the USD/JPY pair was relatively lethargic. After this market crossed swords with the underside of a 4hr swap (resistance) level at 120.66, price made its way down towards the 120.00 handle. As you can see, despite the deep spikes seen below 120.00, this barrier is still holding steady for the time being.
The blue 4hr trendline we have placed on the chart is not to resemble a trend as such, it is more to demonstrate how beneath 120.00 bids are very likely consumed. Check out how each time price rallied, the market came back to fill unfilled buy orders from the origin to continue rallying higher, thus resulting in a potentially weak market.
However, entering short on a break/retest of 120.00 would place you up against possible buying pressure from both weekly and daily supportive structures (118.22-119.25/119.24). That being the case, we’re patiently going to wait for the NFP to do its thing later on today and then look to try and catch a quick scalp or two during the U.S. session.
Levels we have noted to watch for confirmed trades so far are:
Buys:
- The round number 119.00.
- The mid-level number 118.50.
Sells:
- The 4hr swap (resistance) level drawn from 120.66.
- The 4hr supply zone coming in at 121.40-121.07.
- The 4hr supply area at 122.35-121.82 (located just below the daily swap [supply] area at 122.15-122.86).
Levels to watch/ live orders:
- Buys: 119.00 [Tentative – confirmation required] (Stop loss: dependent on where one confirms this level) 118.50 [Tentative – confirmation required] (Stop loss: dependent on where one confirms this level).
- Sells:120.66 [Tentative – confirmation required] (Stop loss: dependent on where one confirms this level) 121.40-121.07 [Tentative – confirmation required] (Stop loss: dependent on where one confirms this area)
122.35-121.82 [Tentative – confirmation required] (Stop loss: dependent on where one confirms this area).
USD/CAD:
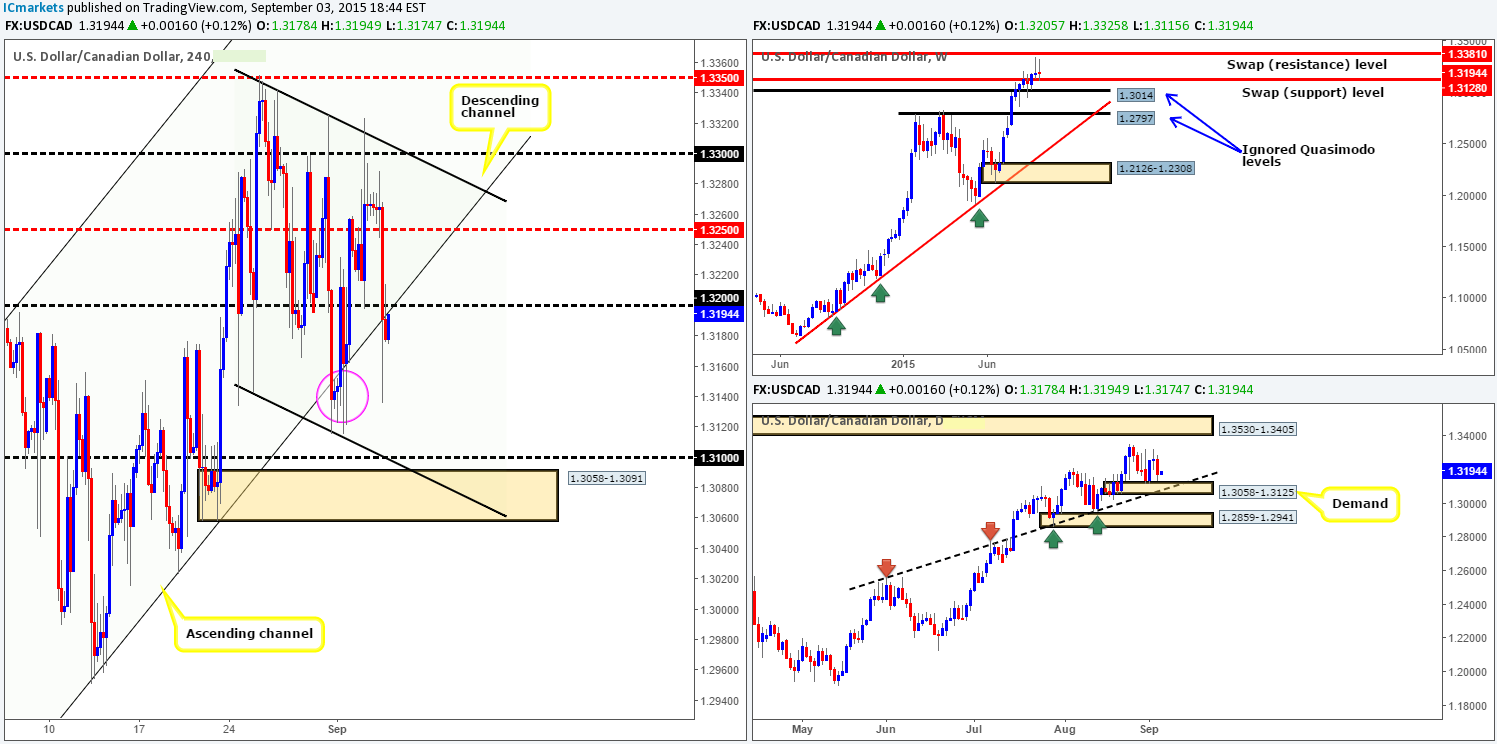
Early on in U.S. trade yesterday the USD/CAD came alive. Price action snowballed south not only taking out both 1.3250/1.3200, but also piercing below the lower limit of a 4hr ascending channel support (1.2536). There were clearly unfilled buy orders sitting around the 1.3140 mark (pink circle) just below as price rebounded back up to retest both round-number resistance 1.3200 and the underside of aforementioned 4hr channel.
At first glance we saw a potential short from here, but after looking at the higher timeframes and seeing that even though momentum appears to be slowing, price is still holding above both weekly and daily support (1.3128/1.3058-1.3125).
Therefore, shorting from the 1.3200 mark is not really something we’d stamp high probability today. With that in mind, our team has come to a general consensus that remaining flat at least until after NFP is the best course of action to take.
Levels to watch/ live orders:
- Buys:Flat (Stop loss: N/A).
- Sells: Flat (Stop loss: N/A).
USD/CHF:
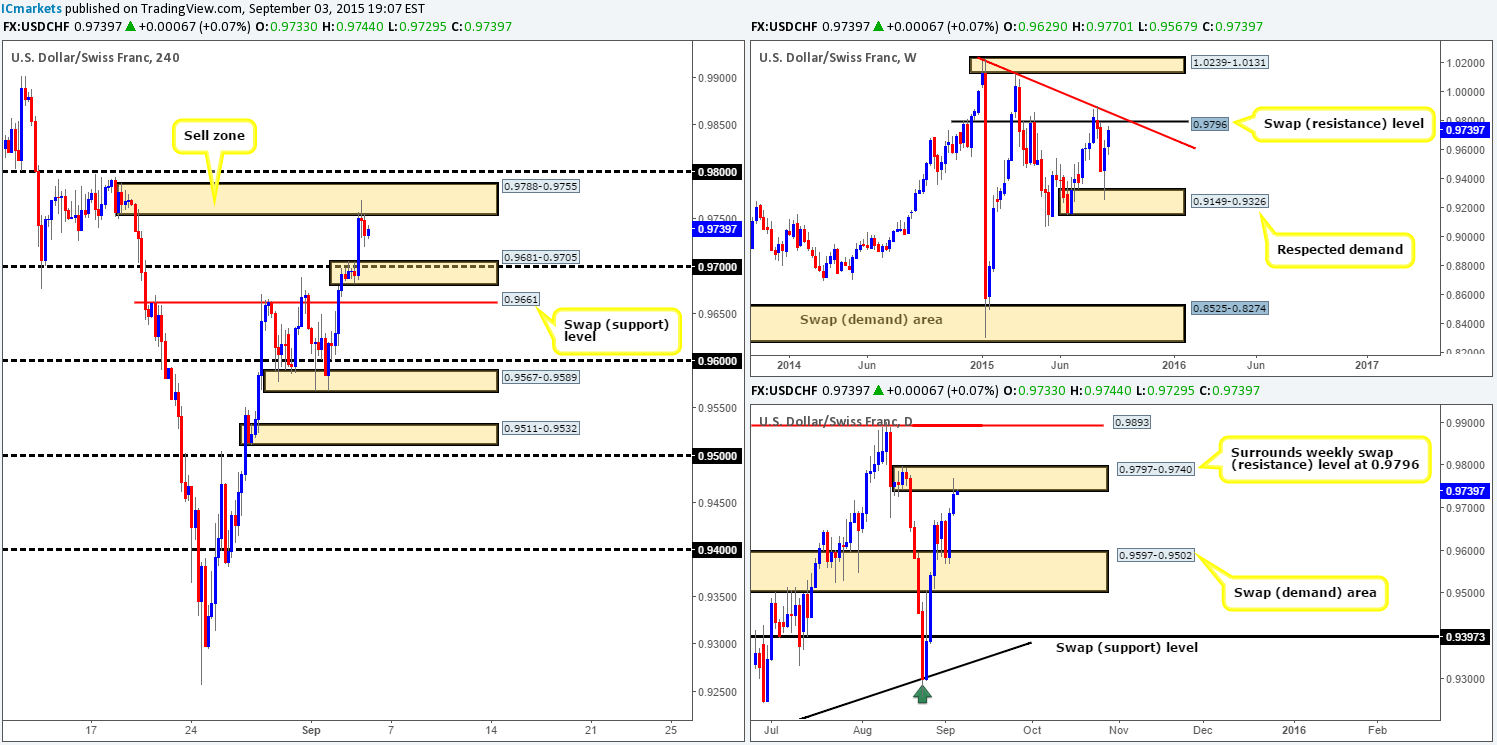
For anyone who follows our analysis on a regular basishttp://www.icmarkets.com/blog/thursday-3rd-september-remain-vigilant-midday-gmt-today-high-impacting-news-set-to-take-center-stage/ you may recall us mentioning to watch for price to take out offers at 0.9700 and head towards the combined 4hr supply/round number zone at 0.9788-0.9755/0.9800 for a potential sell. As can be seen from the chart, price has so far reacted bearishly to this area. Well done to any of our readers who managed to enter short here!
Considering price is trading only a hairline away from a weekly swap (resistance) level at 0.9796, and also from within daily supply at 0.9797-0.9740, we see this market drifting down to 4hr demand at 0.9681-0.9705 ahead of NFP today. This area, in our opinion, would be a good place to close at least 80% of your sell position, and let the remaining 20% run during the NFP release with your stop at breakeven. This way you get to take advantage of the volatility but at the same time remain protected by your breakeven stop.
Worst case scenario for anyone short right now would be a spike up to 0.9800, which is, in effect, the weekly resistance level just mentioned. Therefore, do not hesitate to close out your position should bulls start gaining momentum here!
Levels to watch/ live orders:
- Buys: Flat (Stop loss: N/A).
- Sells:Flat (Stop loss: N/A).
DOW 30:
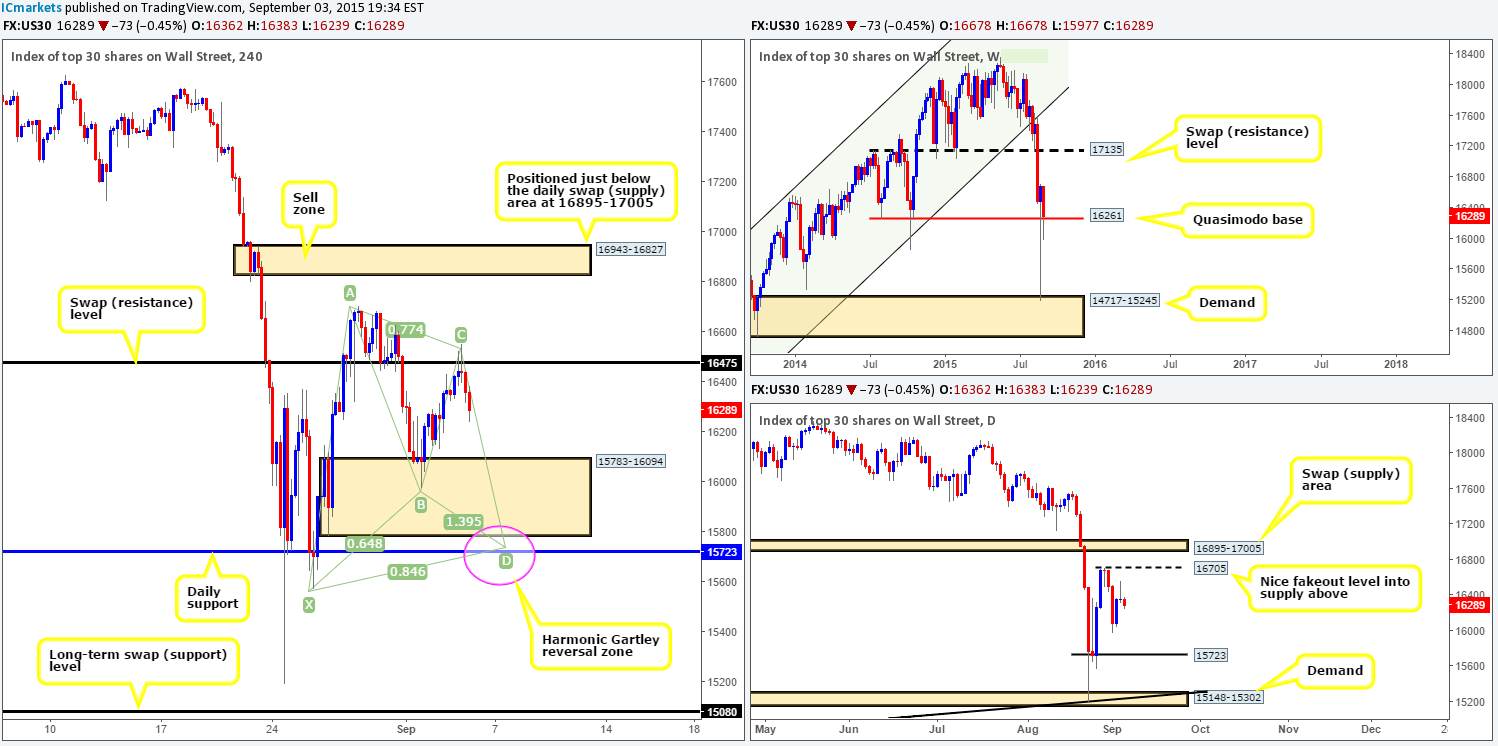
Throughout the course of Thursday’s sessions, price rallied to connect with offers sitting around the 4hr swap (resistance) level at 16475, which, as you can see, sent the market south. Assuming that the sellers can maintain this pressure, we may see price complete the D-leg of a 4hr Harmonic Gartley pattern that terminates around a daily swap (support) level at 15723 (pink circle). This 4hr Harmonic support is quite a way off, however, and price may not reach this area before NFP hits its high note. Despite this, do keep this barrier noted in your watch lists for a potential buy zone.
With the weekly timeframe continuing to show support above the weekly Quasimodo level at 16261, this market still has the potential to rally higher,so, be prepared for the possibility that 16475 may be taken out. This, in itself, could open up the trapdoor for prices to challenge 4hr supply coming in at 16943-16827 (positioned just below a daily swap [supply] area at 16895-17005). With this, one could either look to trade any confirmed retest seen from 16475, or failing that, simply watch for a confirmed short at the aforementioned 4hr supply.
Trading any of the above said areas will not be permitted during NFP. We will only consider these trading zones valid before or after the NFP has had its way. Trade carefully guys!
Levels to watch/ live orders:
- Buys:15723 region [Tentative – confirmation required] (Stop loss: depends on where one confirms this area) Watch for offers around 16475 to be consumed and then look to trade any retest seen at this level (confirmation required).
- Sells:16943-16827 [Tentative – confirmation] (Stop loss: 16992).
XAU/USD: (Gold)
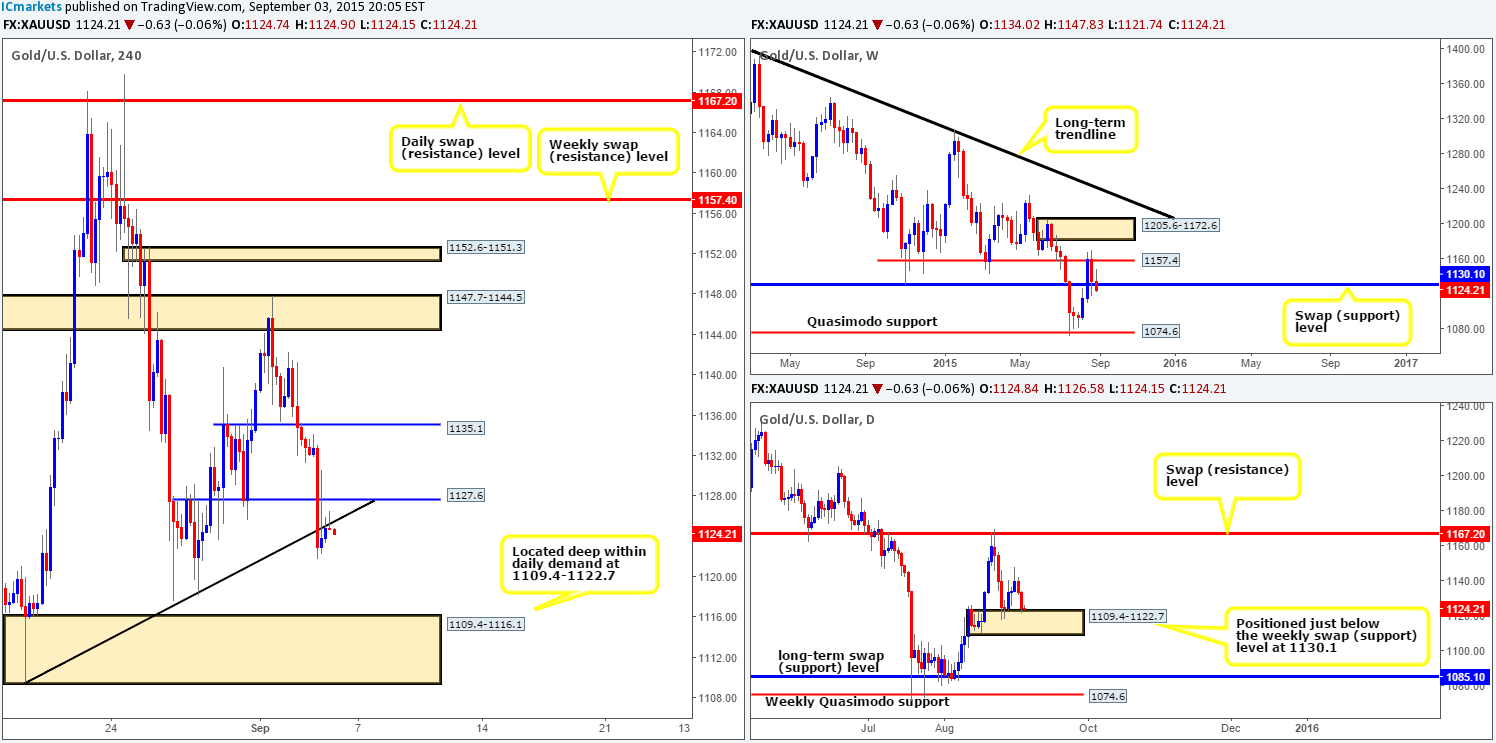
Using a top-down approach this morning, we can see that price is once again trading below the weekly swap (support) barrier at 1130.1. In the event of a close below here, this could encourage further selling going into next week’s trade. Turning our attention to the daily chart reveals that price is touching gloves with daily demand at 1109.4-1122.7 as it did the Friday before. To that end, with weekly sellers trying to push this market south, and daily buyers attempting to control this pressure, we have somewhat of a battle currently taking place!
As we move on to the 4hr scale, it’s clear to see that our 4hr Harmonic Bat pattern failed resulting in a loss for our team. Never mind, onwards and upwards as they say!
At the time of writing, price is hugging the underside of the recently broken 4hr ascending trendline, which may send Gold down towards 4hr demand at 1109.4-1116.1 (located deep within the aforementioned daily demand area). But, with the daily demand area just mentioned above providing a steady floor to this market right now, we’ll hold fire on this one.
Given the points made above and the fact that price may simply consolidate ahead of NFP today, we’ve decided to only begin hunting for (confirmed) trades thirty minutes after the NFP at the following pre-determined areas:
Buys:
- The 4hr demand at 1109.4-1116.1.
Sells:
- A 4hr swap (resistance) level at 1135.1.
- A 4hr swap (supply) area at 1147.7-1144.5.
Levels to watch/ live orders:
- Buys:1109.4-1116.1 [Tentative – confirmation required] (Stop loss: 1107.80).
- Sells: 1135.1 [Tentative – confirmation required] (Stop loss: dependent on where one confirms this level) 1147.7-1144.5[Tentative – confirmation required] (Stop loss: dependent on where one confirms this area).
