
DXY (US Dollar Index):
Potential Direction: Bearish
Overall momentum of the chart: Bearish
Price could potentially make a bearish reaction off the pivot and drop to the 1st support.
Pivot: 2505.56
Supporting reasons: An overlap resistance, aligned with the 50% Fibonacci Retracement, indicating potential selling pressure at this level.
1st support: 2472.86
Supporting reasons: An overlap support, marking a significant area where previous declines have found support.
1st resistance: 2530.26
Supporting reasons: Multi-swing high resistance, suggesting a potential area where the price may face resistance after rallies.

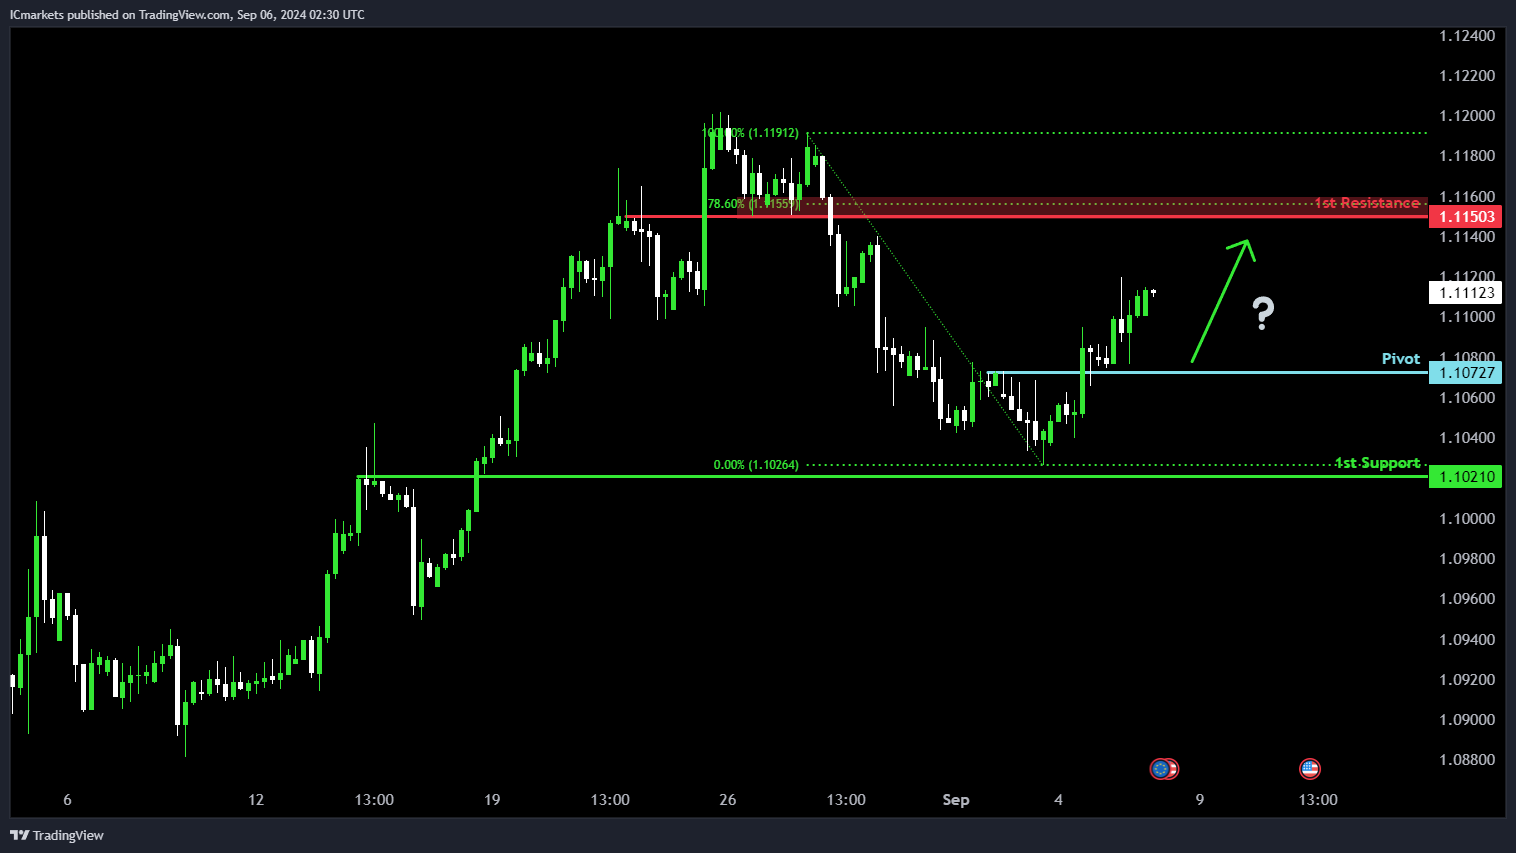
EUR/USD:
Potential Direction: Bullish
Overall momentum of the chart: Bullish
Price could potentially make a bullish continuation towards the 1st resistance.
Pivot: 1.1072
Supporting reasons: An overlap support, indicating a key level where price has shown buying interest.
1st support: 1.1021
Supporting reasons: Another overlap support level, suggesting an area where buyers might step in to prevent further declines.
1st resistance: 1.1150
Supporting reasons: Pullback resistance, aligned with the 78.60% Fibonacci Retracement, indicating a potential area where price may face resistance after an upward move.
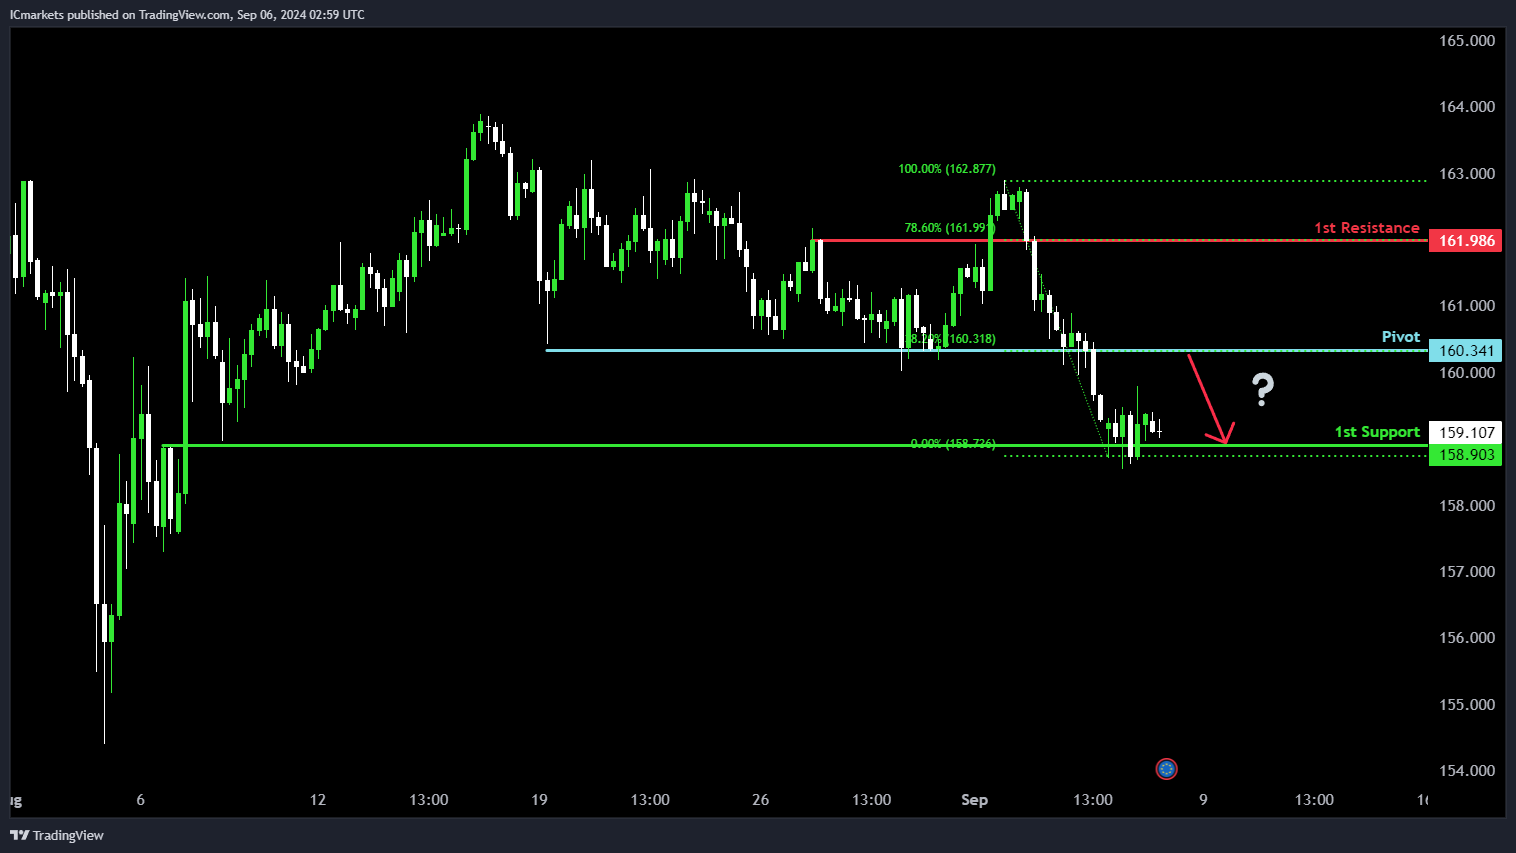
EUR/JPY:
Potential Direction: Bearish
Overall momentum of the chart: Bearish
Price could potentially make a bearish reaction off the pivot and drop to the 1st support.
Pivot: 160.34
Supporting reasons: Identified as pullback resistance, reinforced by the 38.20% Fibonacci Retracement, indicating a potential level where selling pressure could re-enter.
1st support: 158.90
Supporting reasons: Recognized as an overlap support, suggesting a strong area where previous declines have found a floor.
1st resistance: 161.98
Supporting reasons: Marked as pullback resistance, supported by the 78.60% Fibonacci Retracement, where prior upward movements have been halted.
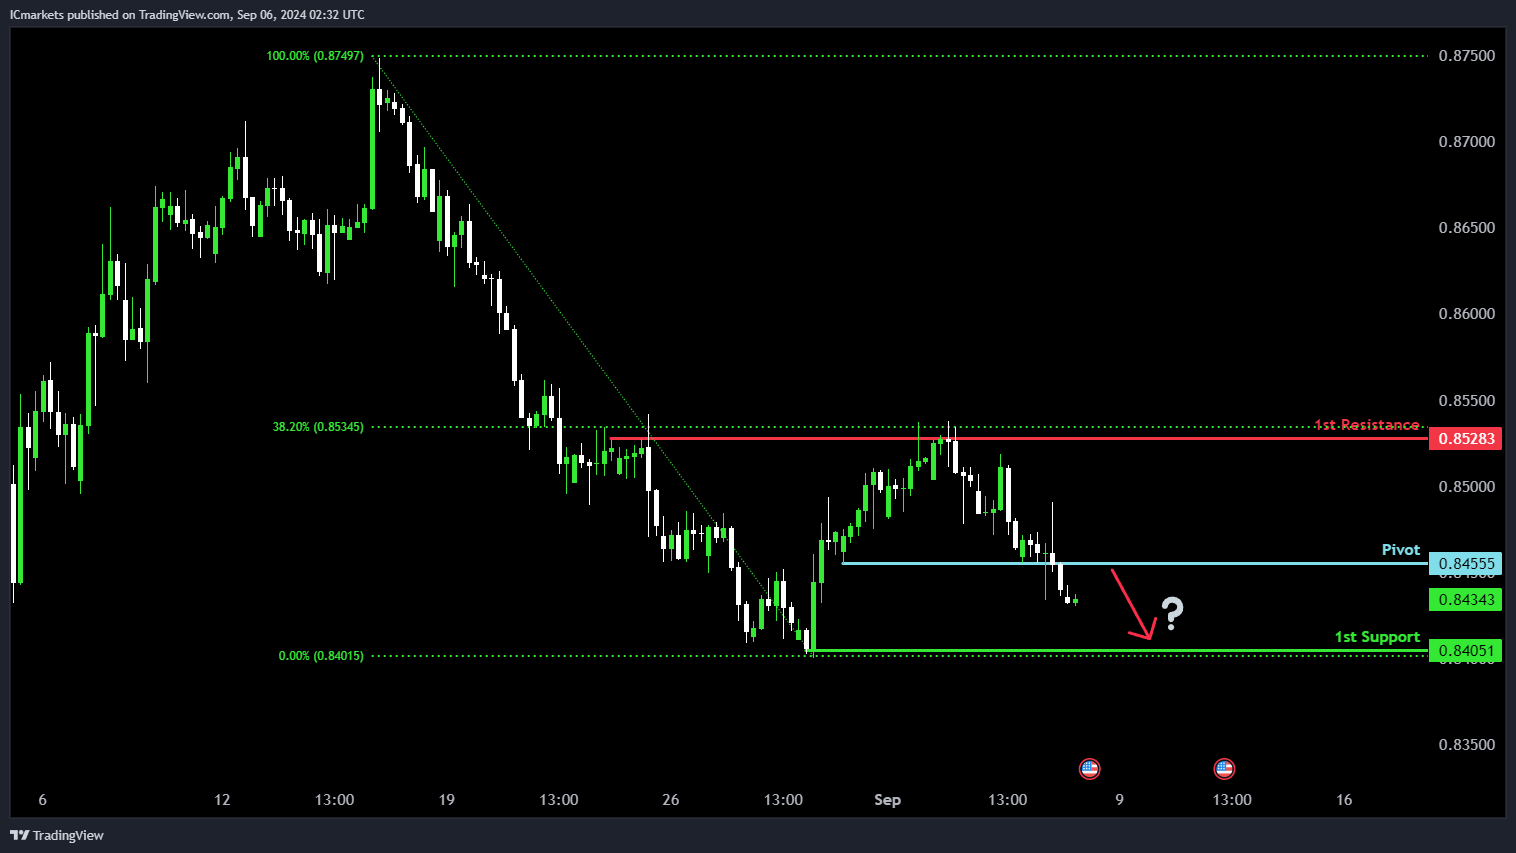
EUR/GBP:
Potential Direction: Bearish
Overall momentum of the chart: Bearish
Price could potentially make a bearish reaction off the pivot and drop to 1st support.
Pivot: 0.8453
Supporting reasons: Identified as pullback support, reinforced by the 23.60% Fibonacci Retracement, indicating a potential area where the price might stall before continuing downward.
1st support: 0.8384
Supporting reasons: Marked as swing low support, suggesting a significant area where previous declines have found a buying interest.
1st resistance: 0.8490
Supporting reasons: Recognized as pullback resistance, supported by the 38.20% Fibonacci Retracement, indicating a potential level where the price may face selling pressure if it retraces upward.

GBP/USD:
Potential Direction: Bullish
Overall momentum of the chart: Bullish
Price could potentially make a bullish continuation towards the 1st resistance.
Pivot: 1.3148
Supporting reasons: An overlap support, suggesting a key level where price has found previous buying interest.
1st support: 1.3117
Supporting reasons: Another overlap support level, indicating an area where buyers may step in to prevent further declines.
1st resistance: 1.3226
Supporting reasons: An overlap resistance, aligned with the 78.60% Fibonacci Retracement, indicating a potential area where price may face selling pressure during the upward move.

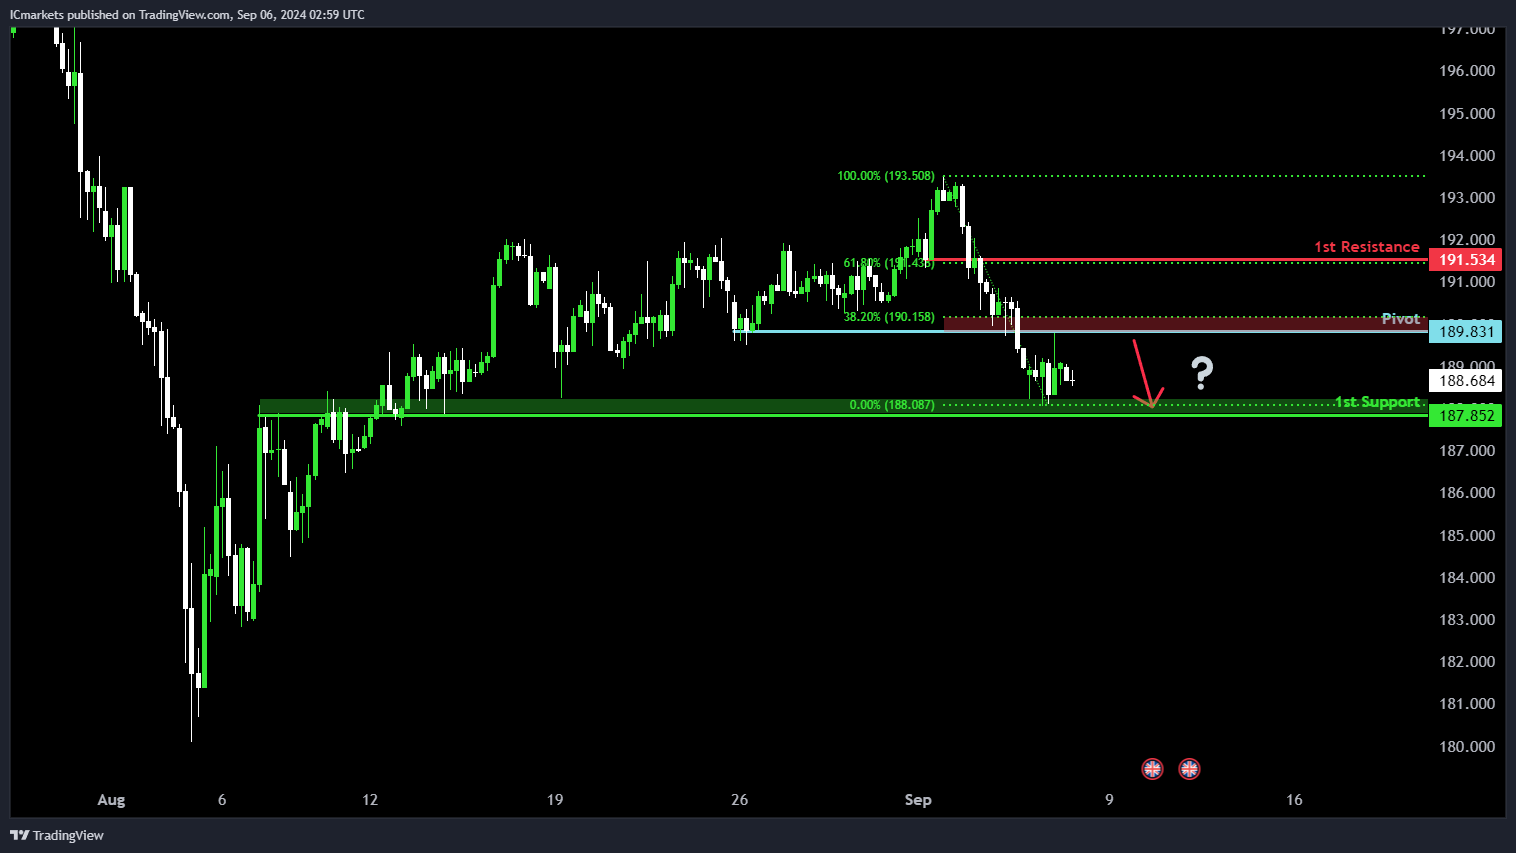
GBP/JPY:
Potential Direction: Bullish
Overall momentum of the chart: Bullish
Price could potentially make a bullish continuation towards the 1st resistance.
Pivot: 1.3148
Supporting reasons: An overlap support, suggesting a key level where price has found previous buying interest.
1st support: 1.3117
Supporting reasons: Another overlap support level, indicating an area where buyers may step in to prevent further declines.
1st resistance: 1.3226
Supporting reasons: An overlap resistance, aligned with the 78.60% Fibonacci Retracement, indicating a potential area where price may face selling pressure during the upward move.
USD/CHF:
Potential Direction: Bearish
Overall momentum of the chart: Bearish
Price could potentially make a bearish reaction off the pivot and drop to the 1st support.
Pivot: 0.8455
Supporting reasons: Pullback resistance, indicating a key level where price may face selling pressure.
1st support: 0.8405
Supporting reasons: Swing low support, suggesting a key level where price may find buying interest to prevent further declines.
1st resistance: 0.8528
Supporting reasons: Multi-swing high resistance, aligned with the 38.20% Fibonacci Retracement, indicating a potential area where price may face resistance during an upward move.
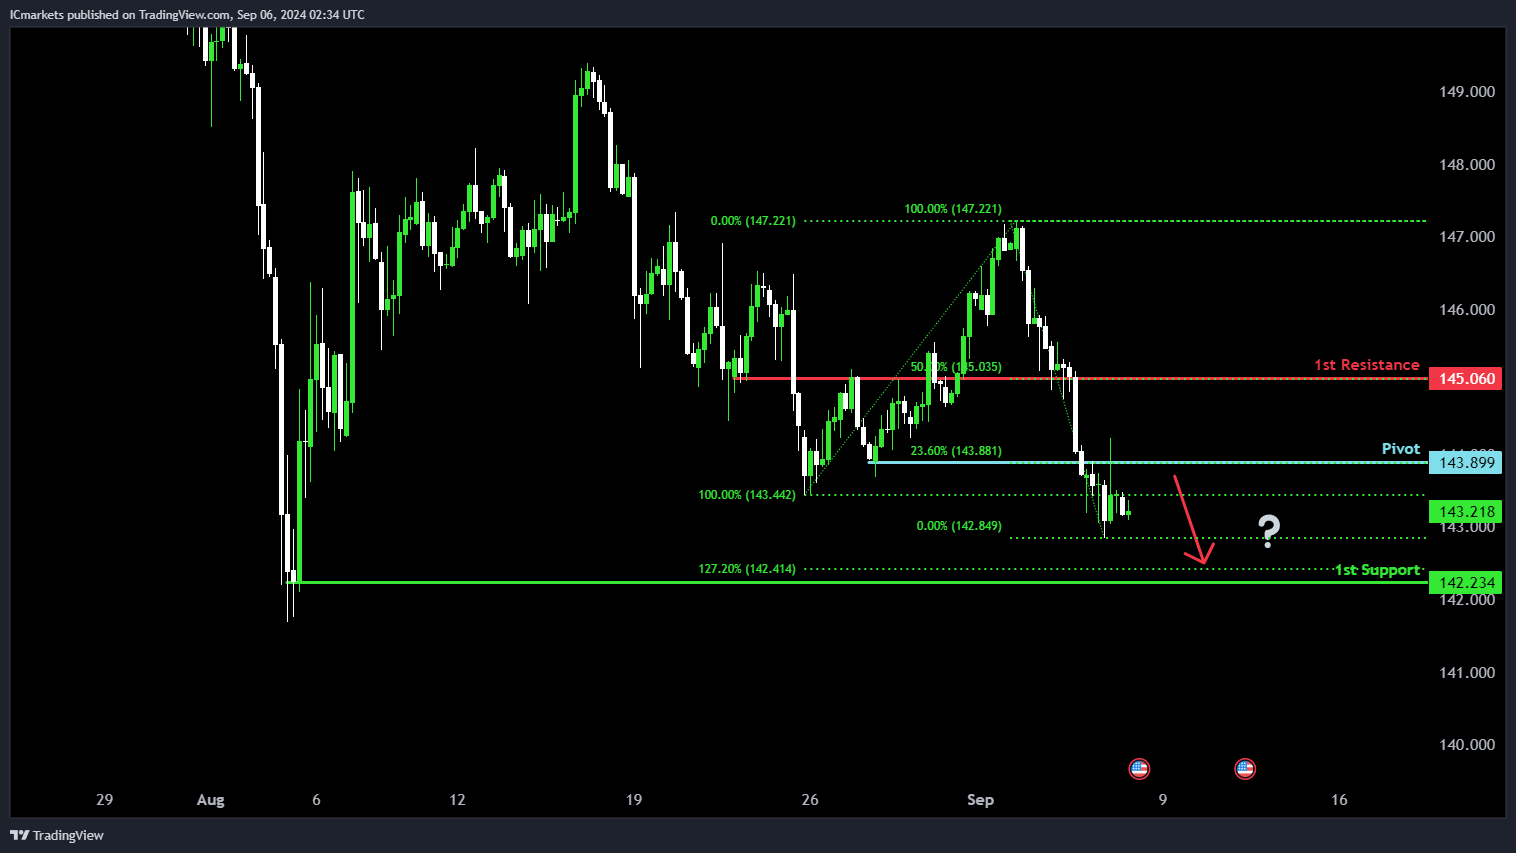
USD/JPY:
Potential Direction: Bearish
Overall momentum of the chart: Bearish
Price could potentially make a bearish reaction off the pivot and drop to the 1st support.
Pivot: 143.89
Supporting reasons: An overlap resistance, aligned with the 50% Fibonacci Retracement, suggesting a key level where price may face selling pressure.
1st support: 142.23
Supporting reasons: Swing low support, aligned with the 127.20% Fibonacci Extension, indicating a potential level where price may find buying interest to prevent further declines.
1st resistance: 143.89
Supporting reasons: An overlap resistance, aligned with the 38.20% Fibonacci Retracement, suggesting a potential area where price may face resistance during any upward move.
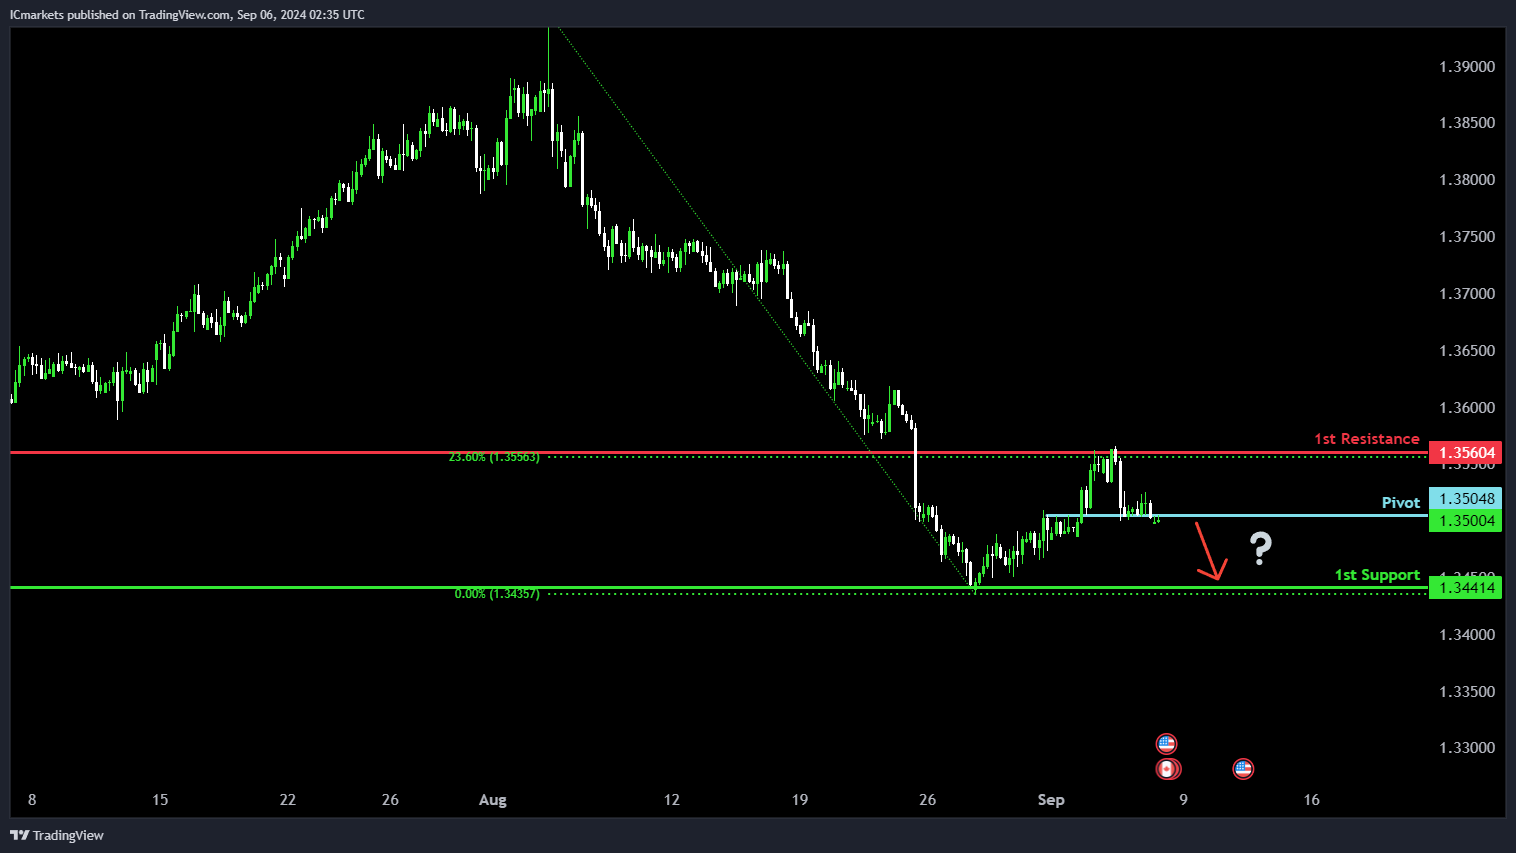
USD/CAD:
Potential Direction: Bearish
Overall momentum of the chart: Bearish
Price could potentially make a bearish reaction off the pivot and drop to the 1st support.
Pivot: 1.3504
Supporting reasons: An overlap resistance, suggesting a key level where price may face selling pressure.
1st support: 1.3441
Supporting reasons: Swing low support, indicating a potential area where price may find buying interest to prevent further declines.
1st resistance: 1.3560
Supporting reasons: An overlap resistance, aligned with the 38.20% Fibonacci Retracement, indicating a potential area where price may face resistance during an upward move.
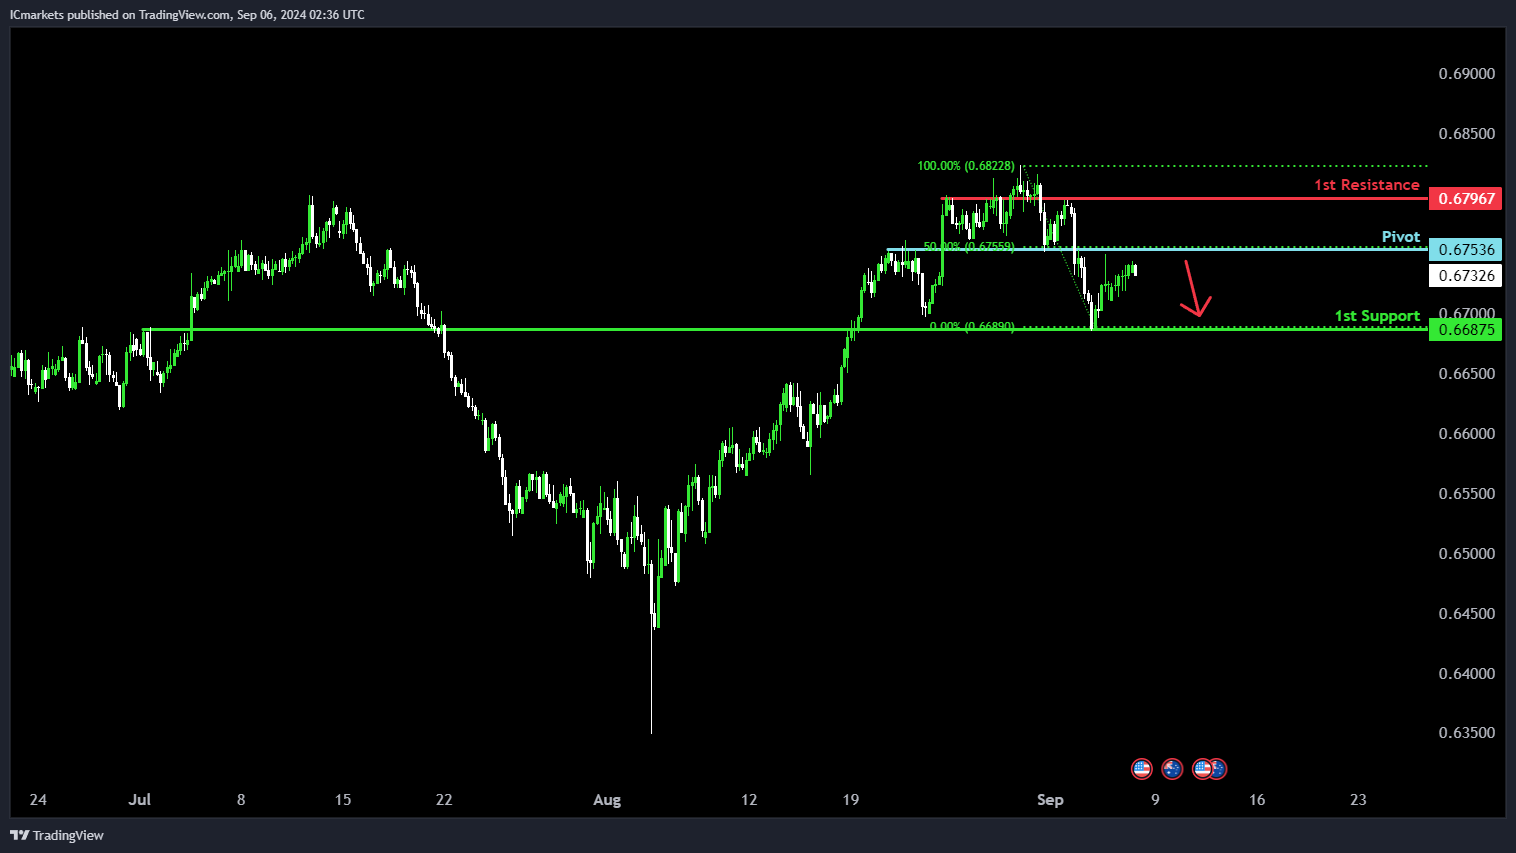
AUD/USD:
Potential Direction: Bearish
Overall momentum of the chart: Bearish
Price could potentially make a bearish reaction off the pivot and drop to the 1st support.
Pivot: 0.6753
Supporting reasons: Pullback resistance, aligned with the 50% Fibonacci Retracement, suggesting a key level where price may face selling pressure.
1st support: 0.6687
Supporting reasons: An overlap support, indicating a potential level where price may find buying interest to prevent further declines.
1st resistance: 0.6796
Supporting reasons: An overlap resistance, suggesting a potential area where price may encounter resistance during an upward move.
NZD/USD
Potential Direction: Bearish
Overall momentum of the chart: Bearish
Factors contributing to the momentum is that price is: Below the bearish Ichimoku cloud
Price could potentially make a bearish reaction off the pivot and drop to 1st support.
Pivot: 0.6234
Supporting reasons: An overlap resistance, aligned with the 50% Fibonacci Retracement, suggesting a key level where price may face selling pressure.
1st support: 0.6163
Supporting reasons: Pullback support, indicating a potential level where price may find buying interest to prevent further declines.
1st resistance: 0.6272
Supporting reasons: Swing high resistance, aligned with the 78.60% Fibonacci Retracement, suggesting a potential area where price may face resistance during an upward move.
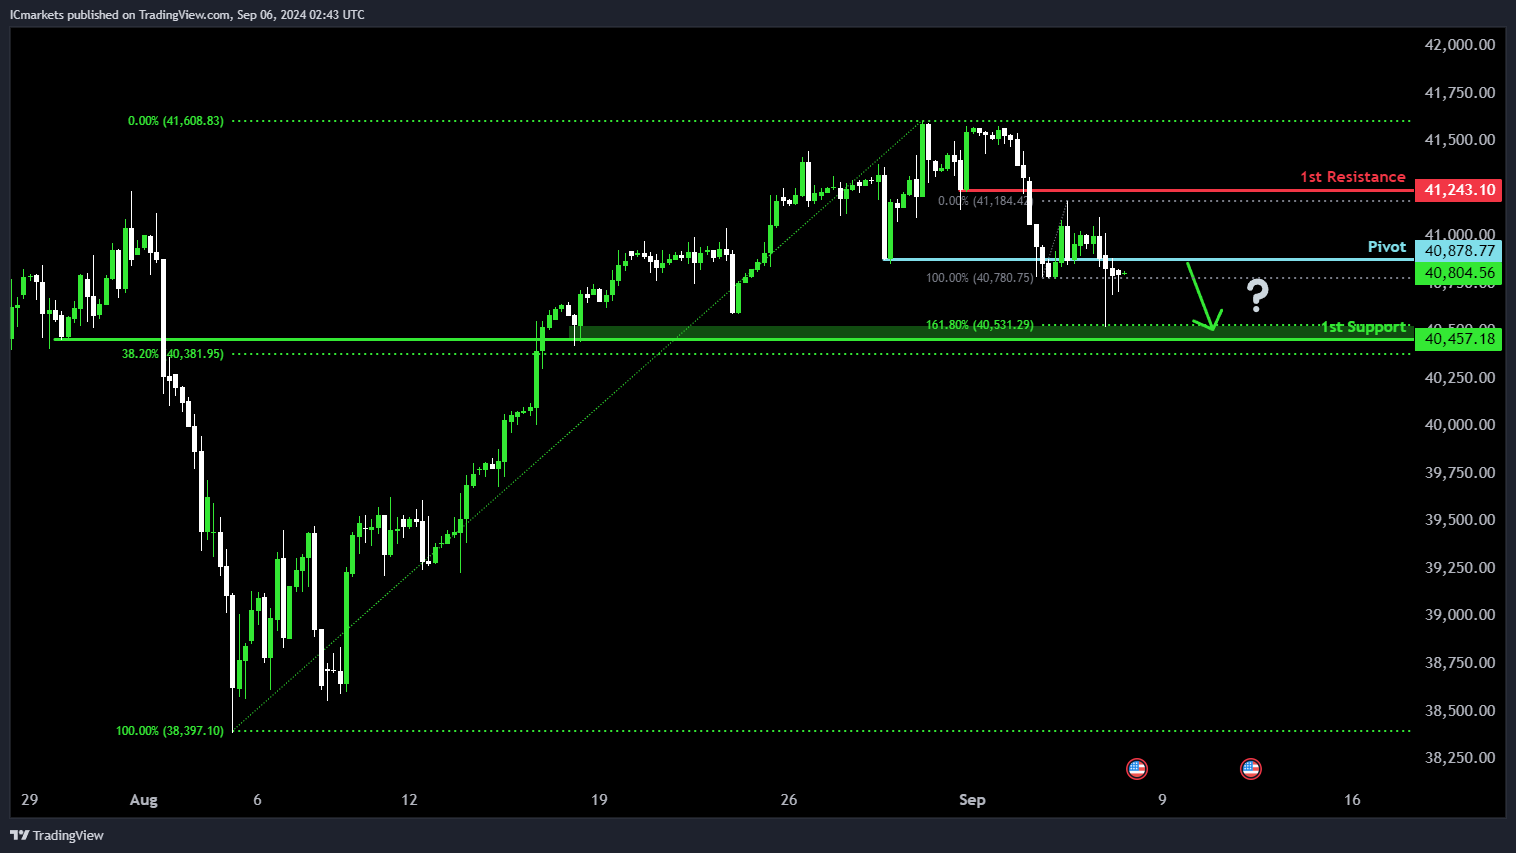
US30 (DJIA):
Potential Direction: Bearish
Overall momentum of the chart: Bearish
Price could potentially make a bearish continuation towards 1st support.
Pivot: 40878.77
Supporting reasons: An overlap support, suggesting a key level where price may face selling pressure.
1st support: 40457.18
Supporting reasons: An overlap support, aligned with the 38.20% Fibonacci Retracement and 161.80% Fibonacci Extension, indicating Fibonacci confluence where price may find significant buying interest.
1st resistance: 41243.10
Supporting reasons: Pullback resistance, suggesting a potential area where price may face selling pressure during an upward move.
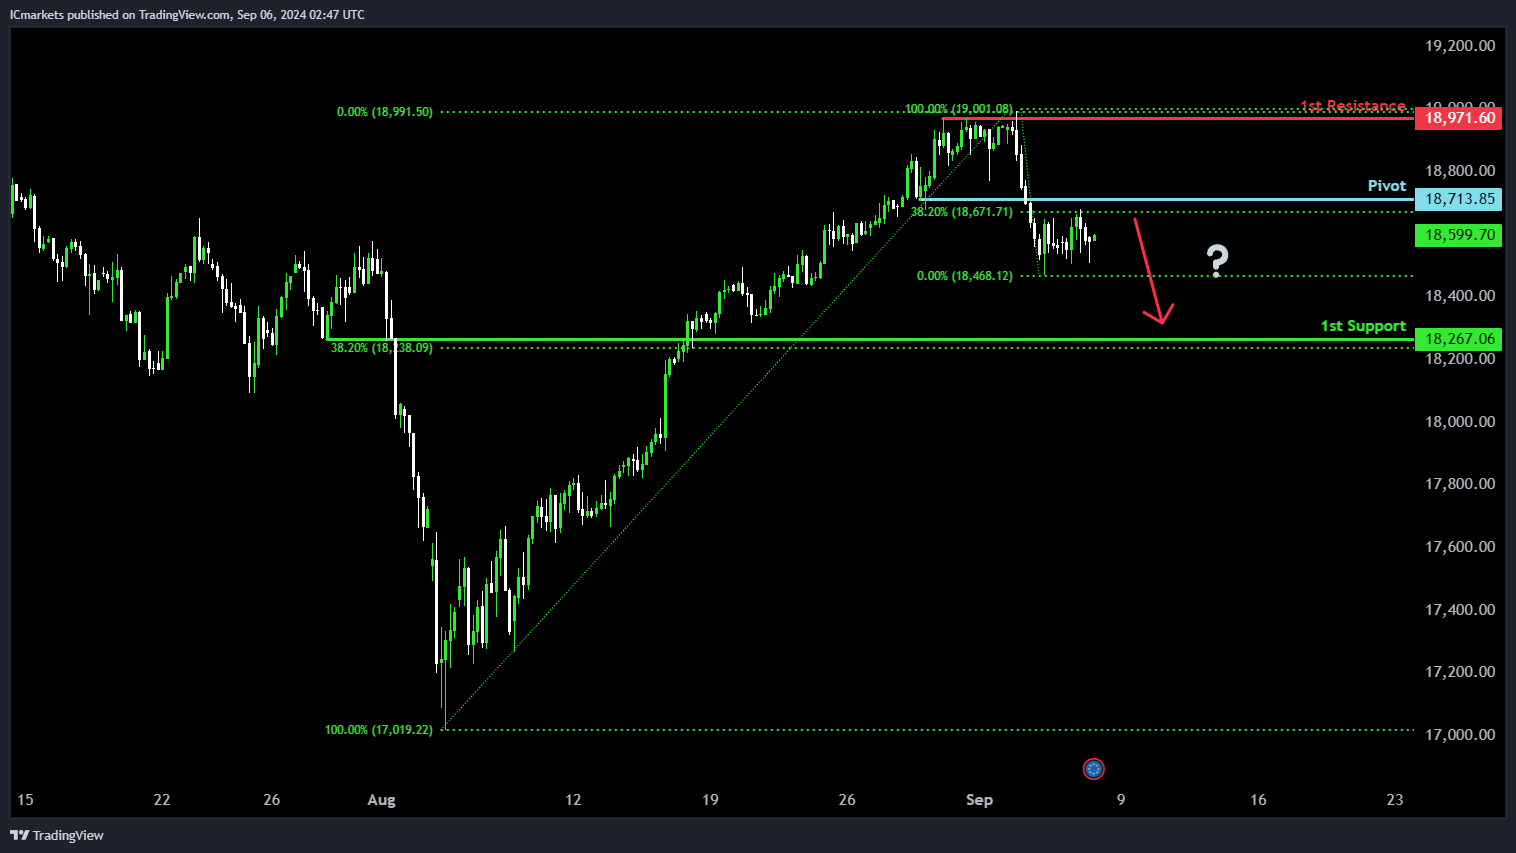
DE40 (DAX):
Potential Direction: Bearish
Overall momentum of the chart: Bearish
Price could potentially make a bearish reaction off the pivot and drop to 1st support.
Pivot: 18713.85
Supporting reasons: An overlap resistance, aligned with the 38.20% Fibonacci Retracement, suggesting a key level where price may face selling pressure.
1st support: 18267.06
Supporting reasons: Pullback support, aligned with the 38.20% Fibonacci Retracement, indicating a potential level where price may find buying interest to prevent further declines.
1st resistance: 18971.60
Supporting reasons: Multi-swing high resistance, suggesting a potential area where price may face resistance during an upward move.
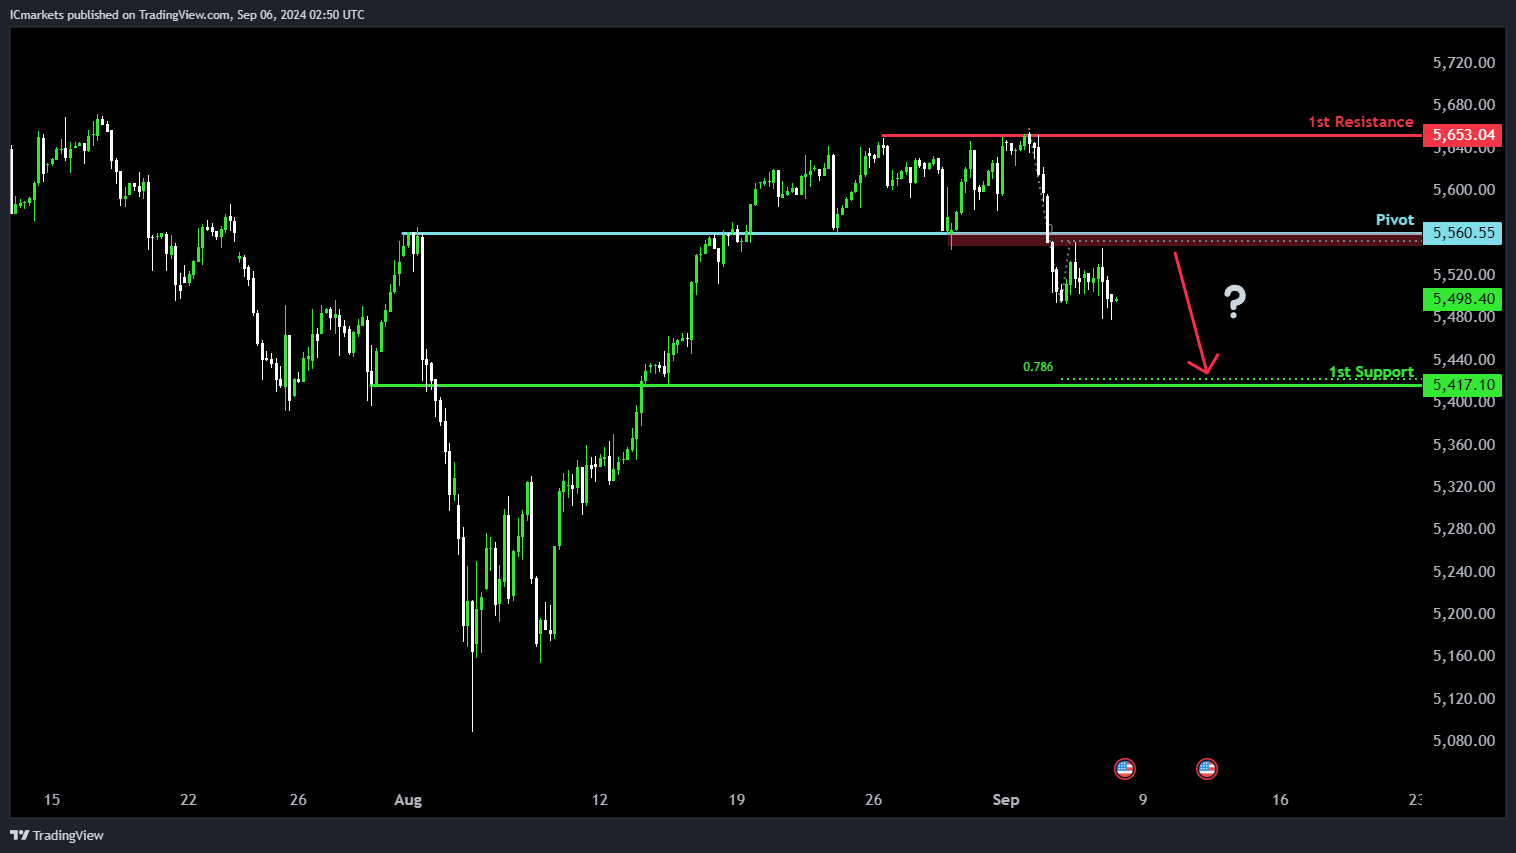
US500 (S&P 500):
Potential Direction: Bearish
Overall momentum of the chart: Bearish
Price could potentially make a bearish continuation towards 1st support.
Pivot: 5560.55
Supporting reasons: An overlap resistance, suggesting a key level where price may face selling pressure.
1st support: 5417.10
Supporting reasons: An overlap support, indicating a potential level where price may find buying interest to prevent further declines.
1st resistance: 5653.04
Supporting reasons: Multi-swing high resistance, suggesting a potential area where price may encounter resistance during an upward move.
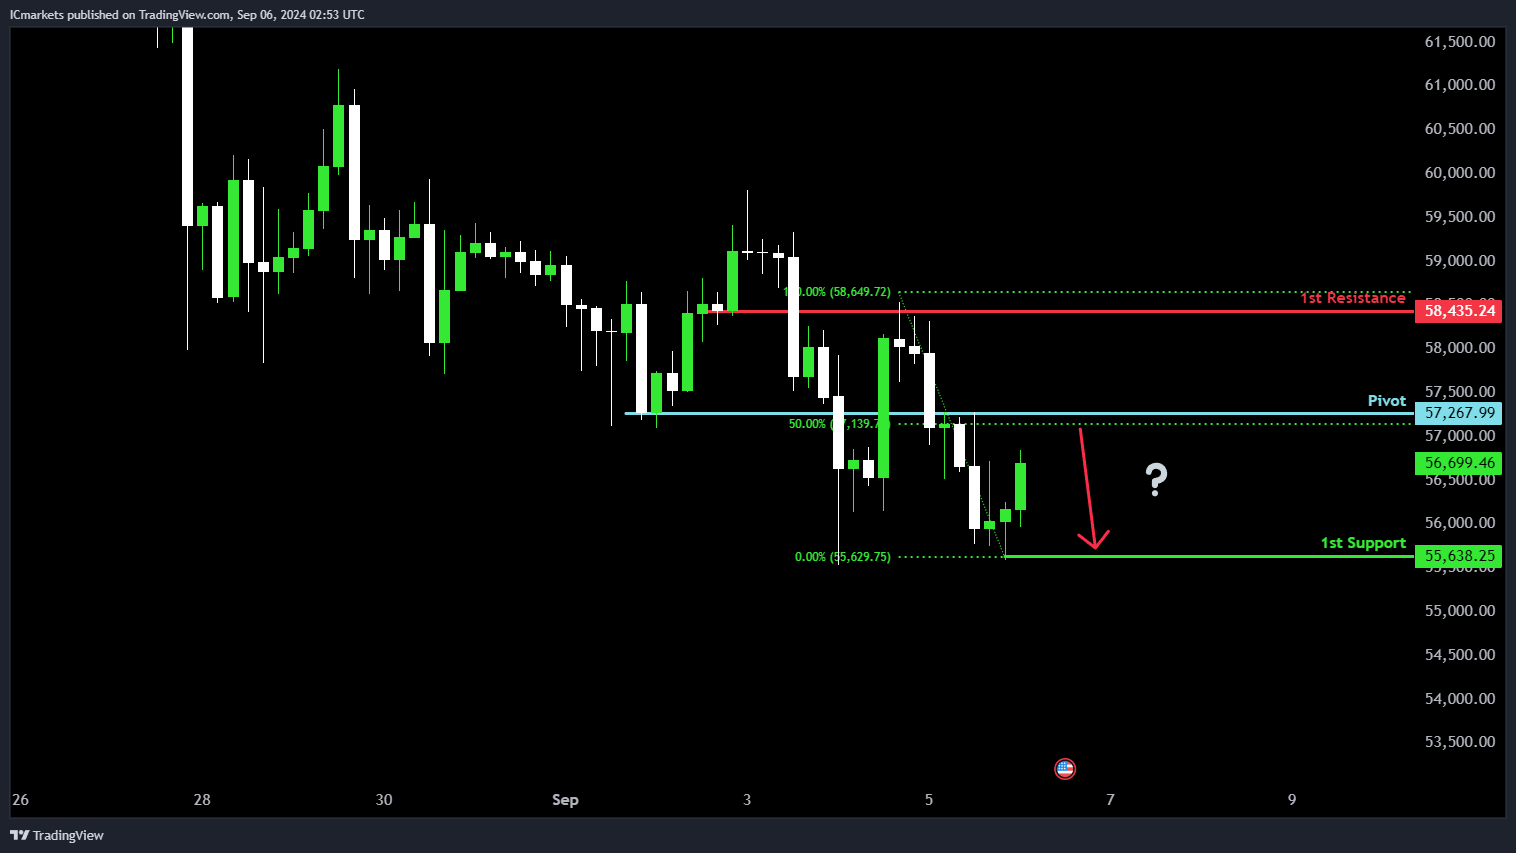
BTC/USD (Bitcoin):
Potential Direction: Bearish
Overall momentum of the chart: Bearish
Price could potentially make a bearish reaction off the pivot and drop to 1st support.
Pivot: 57267.99
Supporting reasons: An overlap support, aligned with the 50% Fibonacci Retracement, suggesting a key level where price may face selling pressure.
1st support: 55638.25
Supporting reasons: Swing low support, indicating a potential level where price may find buying interest to prevent further declines.
1st resistance: 58435.24
Supporting reasons: An overlap resistance, suggesting a potential area where price may face resistance during an upward move.
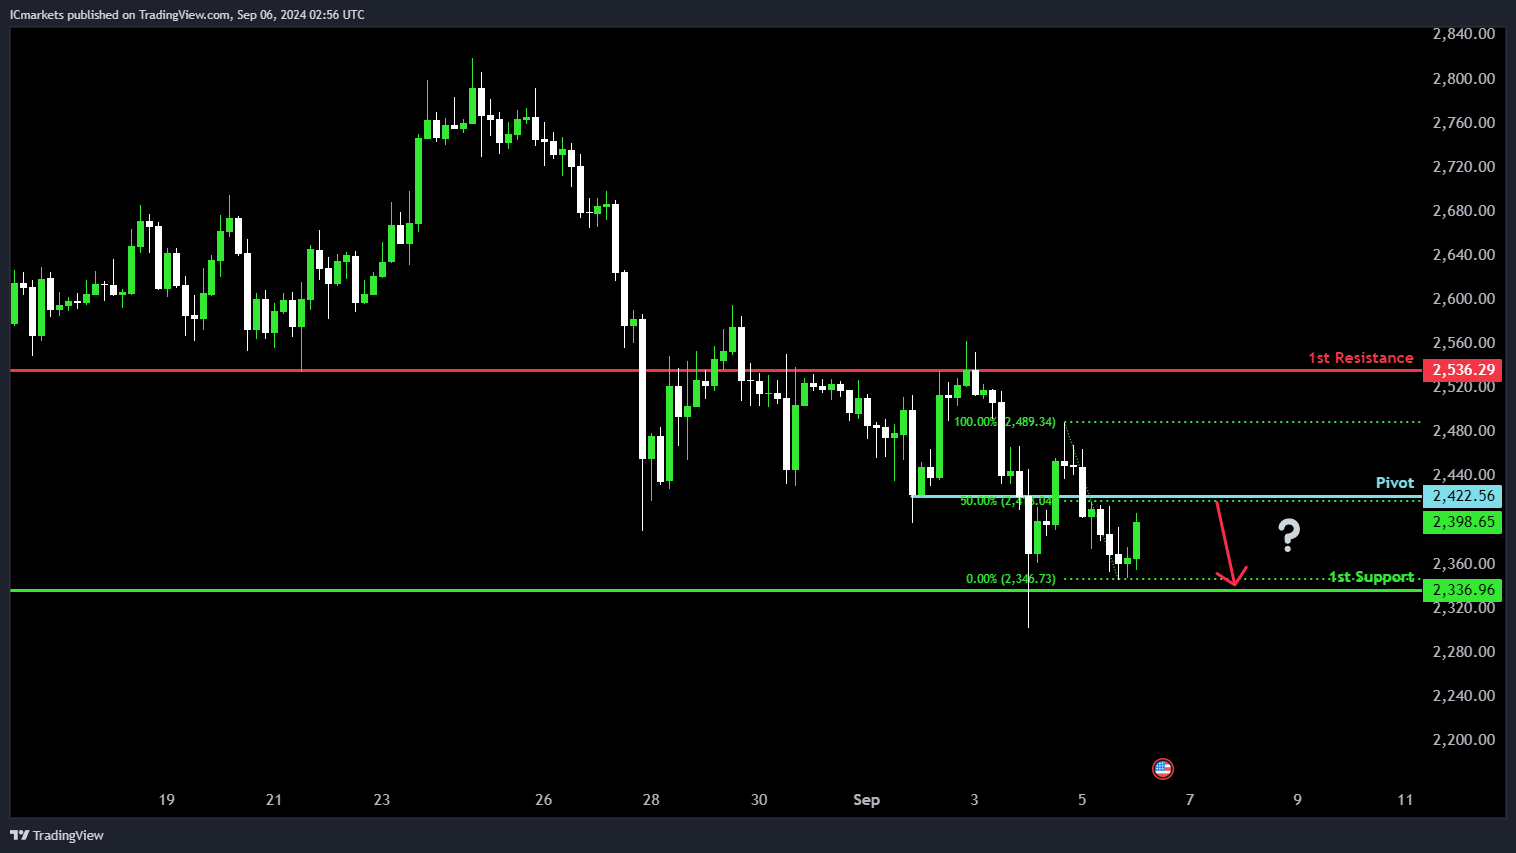
ETH/USD (Ethereum):
Potential Direction: Bearish
Overall momentum of the chart: Bearish
Price could potentially make a bearish reaction off the pivot and drop to 1st support.
Pivot: 3422.56
Supporting reasons: Pullback resistance, aligned with the 50% Fibonacci Retracement, suggesting a key level where price may face selling pressure.
1st support: 2336.96
Supporting reasons: Multi-swing low support, indicating a potential level where price may find buying interest to prevent further declines.
1st resistance: 2536.29
Supporting reasons: An overlap resistance, suggesting a potential area where price may encounter resistance during an upward move.
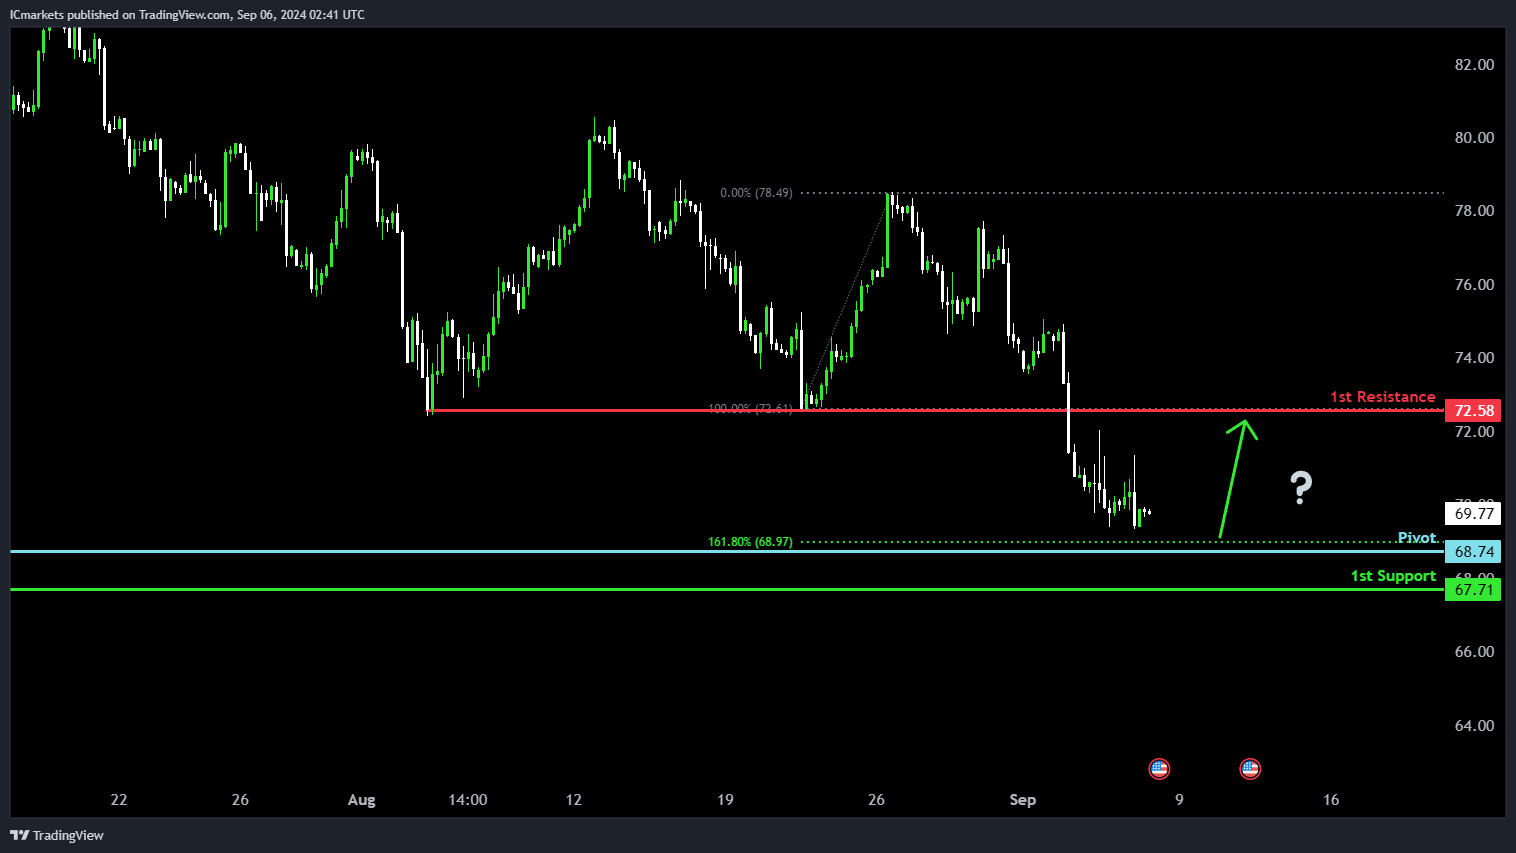
WTI/USD (Oil):
Potential Direction: Bullish
Overall momentum of the chart: Bearish
Price could potentially make a bullish bounce off the pivot and head towards 1st resistance.
Pivot: 68.74
Supporting reasons: Swing low support, aligned with the 161.80% Fibonacci Extension, suggesting a potential level where price might bounce back.
1st support: 67.71
Supporting reasons: Swing low support, indicating a potential level where price might find buying interest to prevent further declines.
1st resistance: 72.58
Supporting reasons: Pullback resistance, suggesting a key level where price might face selling pressure during an upward move.
XAU/USD (GOLD):
Potential Direction: Bullish
Overall momentum of the chart: Bullish
Price could potentially make a bullish continuation towards 1st resistance.
Pivot: 2504.56
Supporting reasons: An overlap support, suggesting a key level where price may find buying interest.
1st support: 2472.86
Supporting reasons: An overlap support, indicating a potential level where price might prevent further declines.
1st resistance: 2530.26
Supporting reasons: Multi-swing high resistance, suggesting a key level where price may face selling pressure during an upward move.

The accuracy, completeness and timeliness of the information contained on this site cannot be guaranteed. IC Markets does not warranty, guarantee or make any representations, or assume any liability regarding financial results based on the use of the information in the site.
News, views, opinions, recommendations and other information obtained from sources outside of www.icmarkets.com.au, used in this site are believed to be reliable, but we cannot guarantee their accuracy or completeness. All such information is subject to change at any time without notice. IC Markets assumes no responsibility for the content of any linked site.
The fact that such links may exist does not indicate approval or endorsement of any material contained on any linked site. IC Markets is not liable for any harm caused by the transmission, through accessing the services or information on this site, of a computer virus, or other computer code or programming device that might be used to access, delete, damage, disable, disrupt or otherwise impede in any manner, the operation of the site or of any user’s software, hardware, data or property.


