
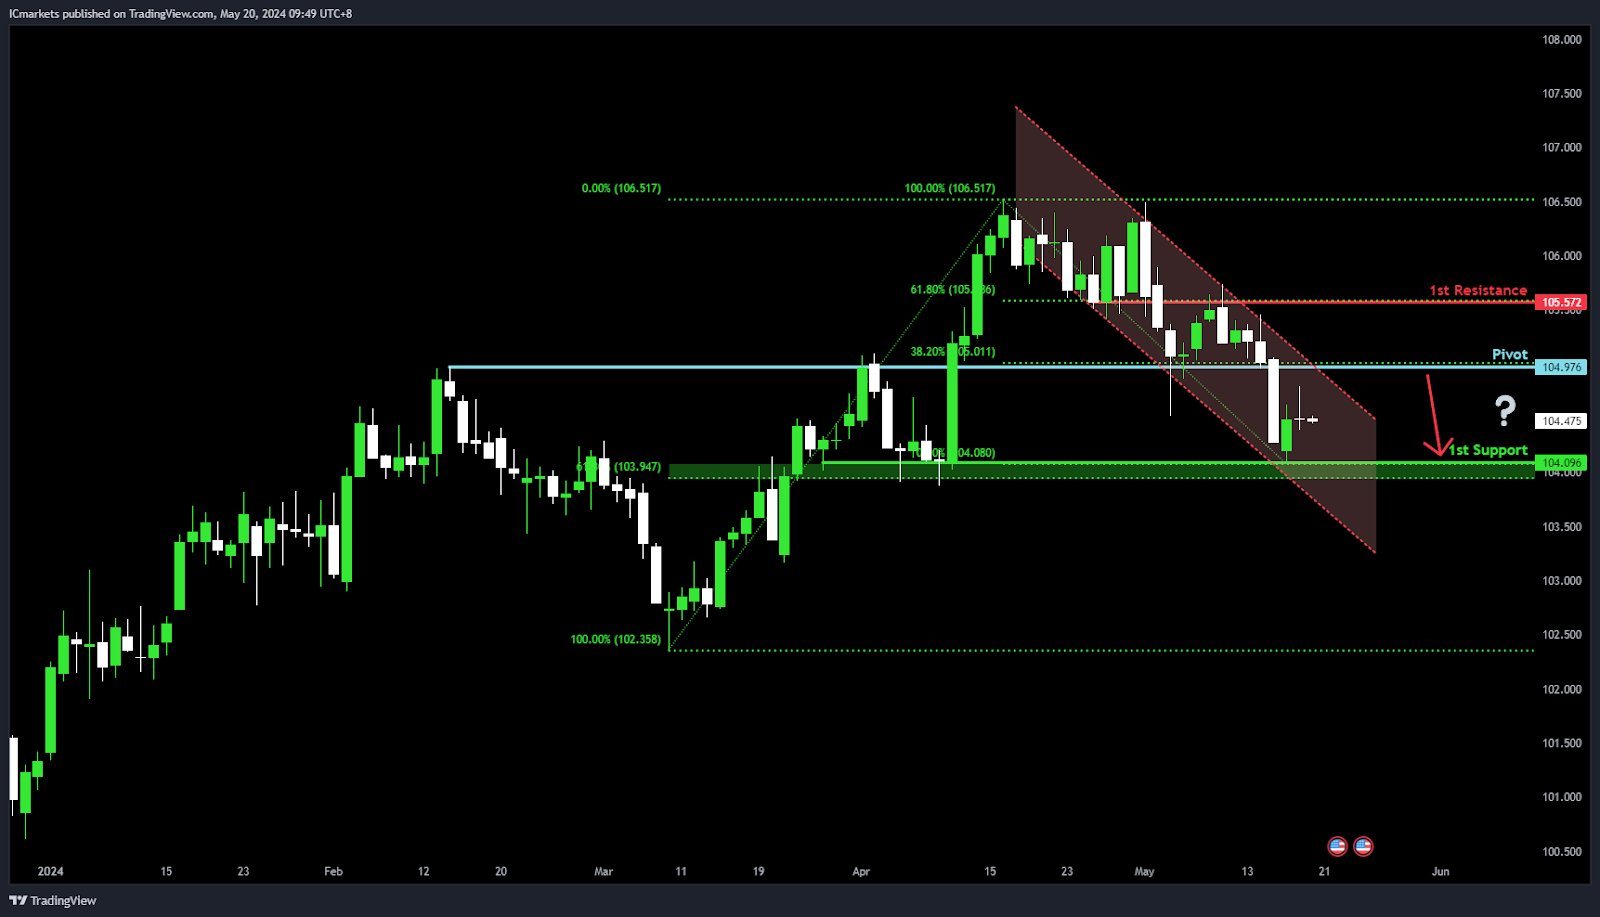
DXY (US Dollar Index):
Potential Direction: Bearish
Overall momentum of the chart: Bearish
Factors contributing to the momentum is that price is: In a bearish descending channel
Price could potentially make a: Bearish reaction off pivot and drop to 1st support
Pivot: 104.97
Supporting reasons: Identified as a pullback resistance, with confluence from the 38.20% Fibonacci Retracement, suggesting a level where selling pressure may intensify, potentially leading to a bearish reaction.
1st support: 104.09
Supporting reasons: Recognized as an overlap support, indicating a historical level where buying interest has emerged, potentially acting as a support for downward movement.
1st resistance: 105.57
Supporting reasons: Noted as an overlap resistance with confluence from the 61.80% Fibonacci Retracement, suggesting a significant area where selling pressure may be present, potentially hindering further upward movement.
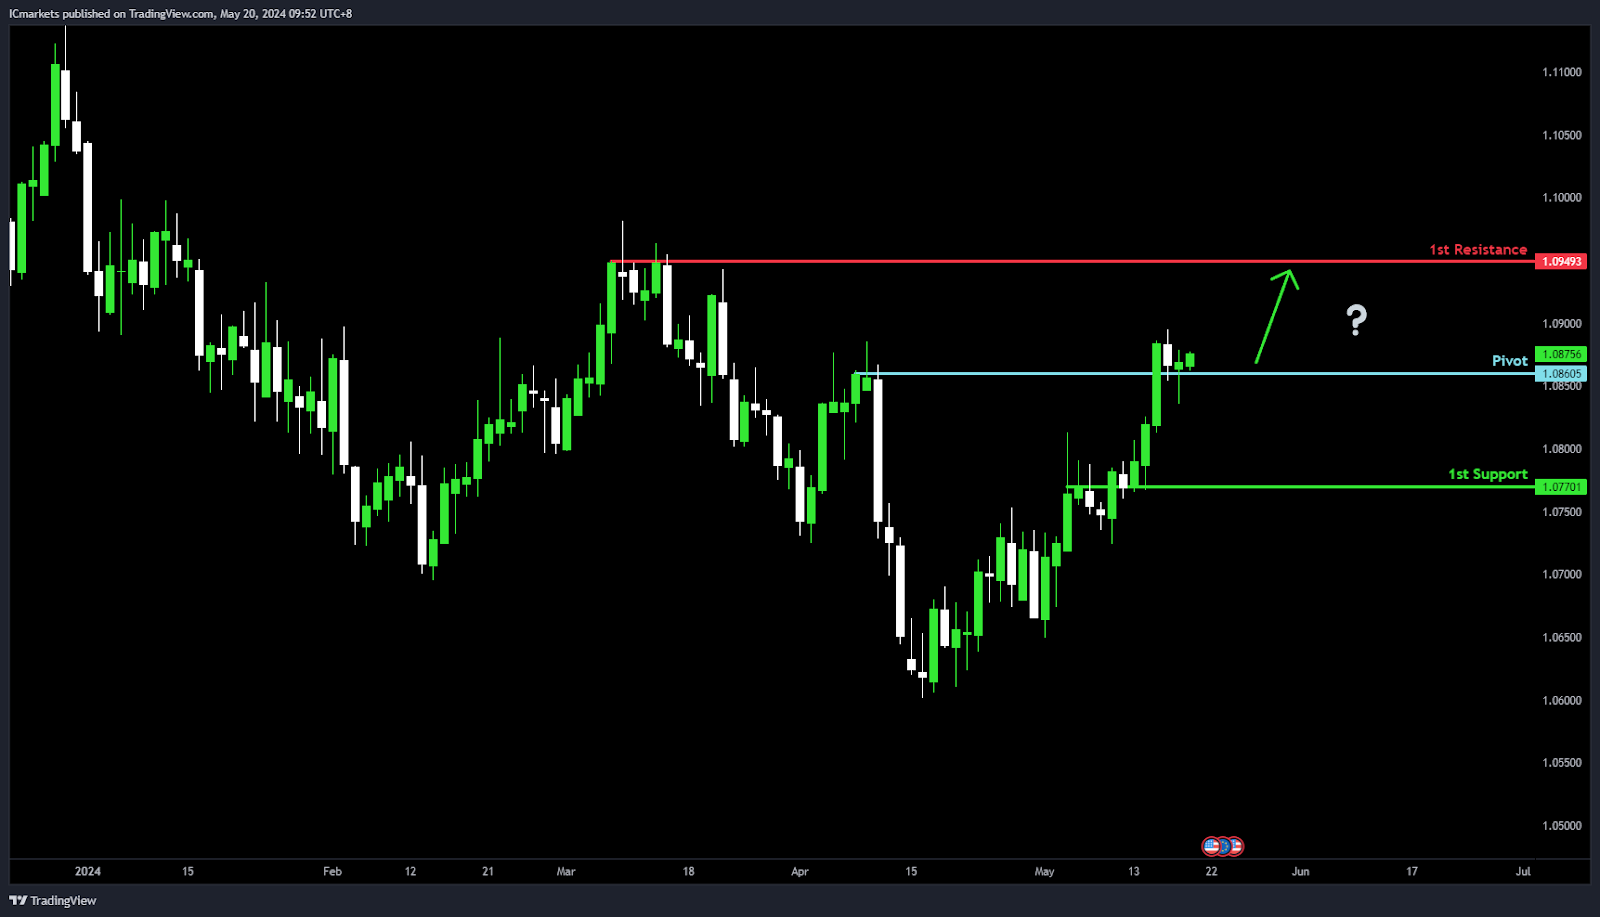
EUR/USD:
Potential Direction: Bullish
Overall momentum of the chart: Bullish
Price could potentially make a: Bullish bounce off pivot and heads toward 1st resistance
Pivot: 1.0860
Supporting reasons: Identified as an overlap support, indicating a historical level where buying interest has emerged, potentially acting as a pivot for bullish movement.
1st support: 1.0770
Supporting reasons: Recognized as an overlap support, suggesting another historical level where buying interest may emerge, potentially providing additional support for upward movement.
1st resistance: 1.0949
Supporting reasons: Noted as a multi-swing high resistance, indicating a significant historical level where selling pressure may be present, potentially hindering further upward movement. However, in this case, the momentum appears bullish, suggesting a potential breakthrough.
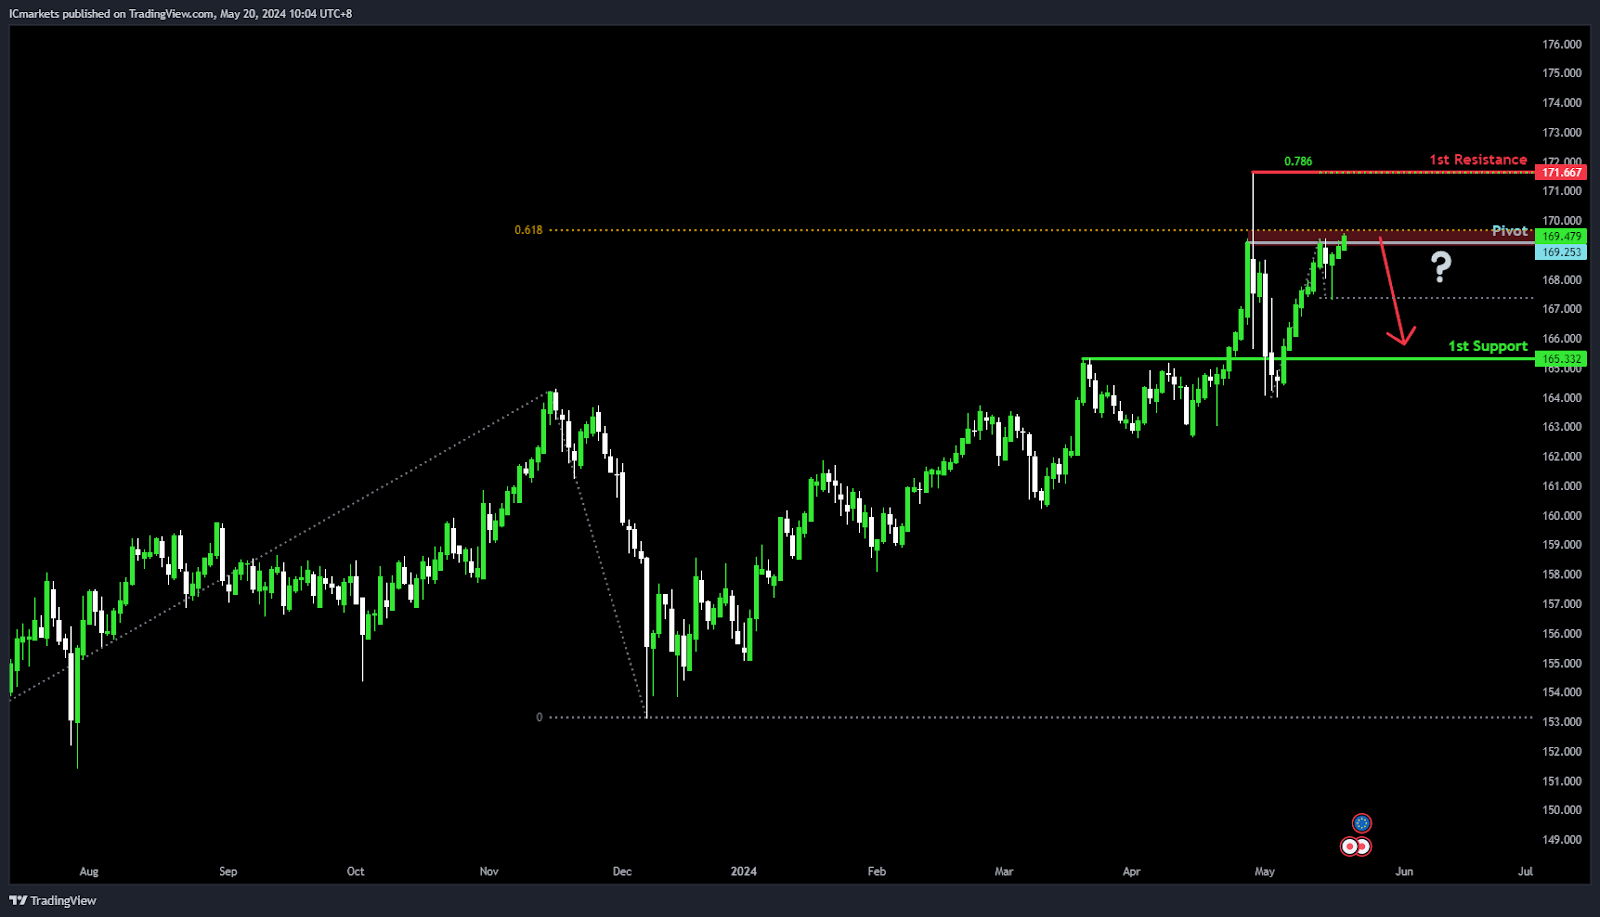
EUR/JPY:
Potential Direction: Bearish
Overall momentum of the chart: Bullish
Price could potentially make a: Bearish reaction off pivot and drop to 1st support
Pivot: 169.47
Supporting reasons: Identified as a pivot with confluence from the swing high resistance and the 61.80% Fibonacci Projection, suggesting a significant area where selling pressure may intensify, potentially leading to a bearish reaction.
1st support: 165.33
Supporting reasons: Recognized as a pullback support, indicating a level where buying interest may emerge, potentially acting as a support for downward movement.
1st resistance: 171.66
Supporting reasons: Noted as a swing high resistance with confluence from the 78.60% Fibonacci Projection, indicating a significant historical level where selling pressure may be present, potentially hindering further upward movement.
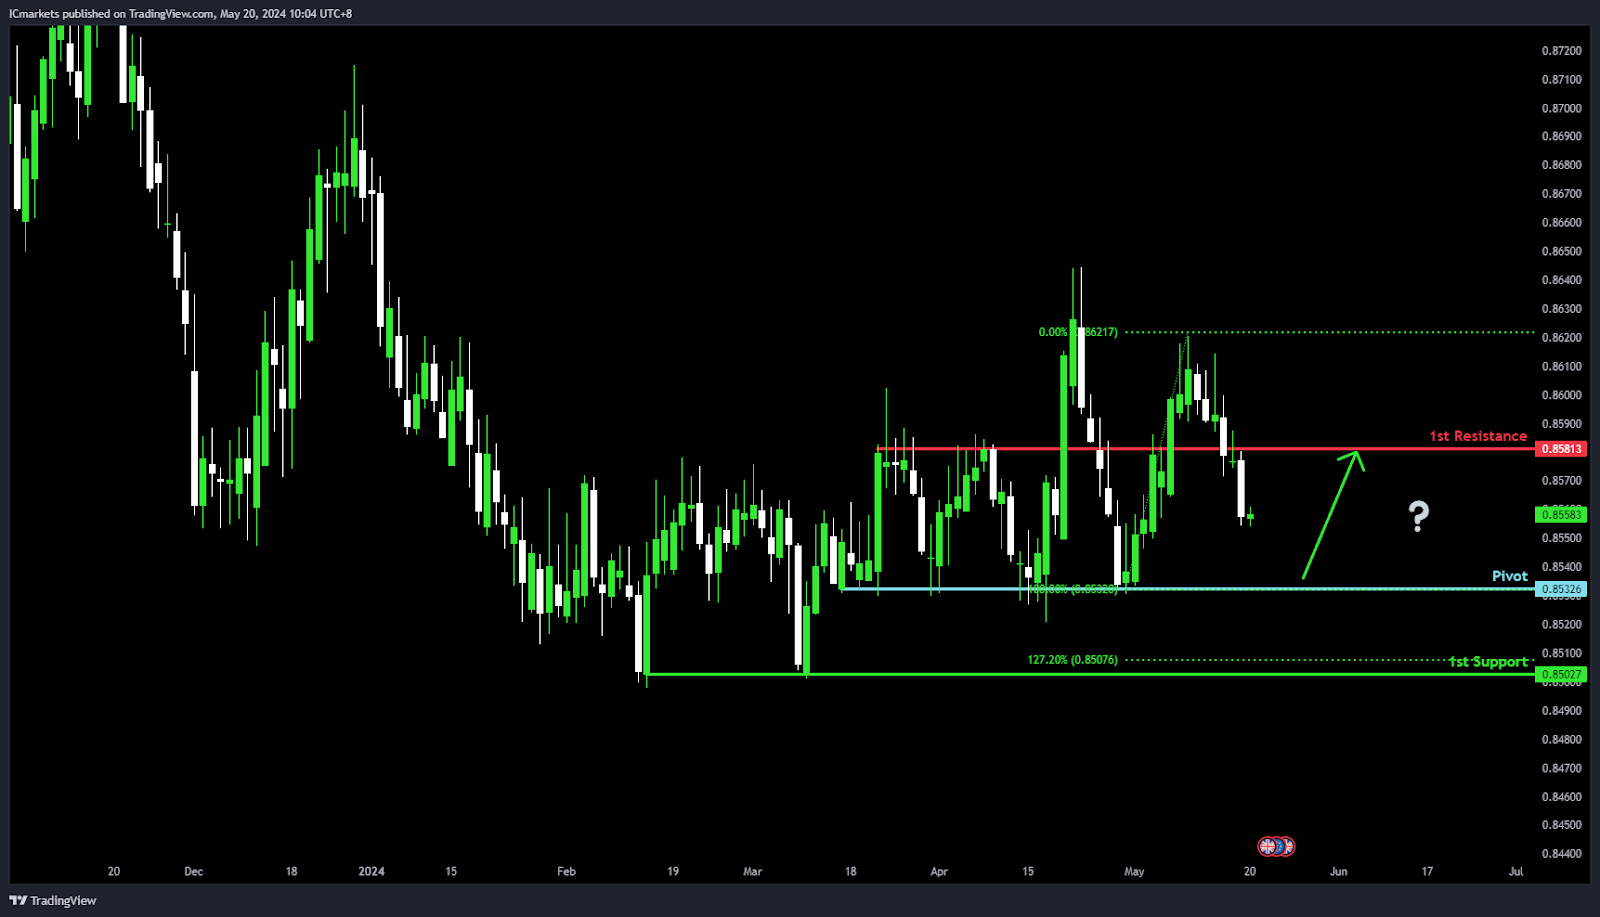
EUR/GBP:
Potential Direction: Bullish
Overall momentum of the chart: Bullish
Price could potentially make a: Bullish bounce off pivot and heads towards 1st resistance
Pivot: 0.8532
Supporting reasons: Identified as a multi-swing low support, suggesting a historical level where buying interest has emerged, potentially acting as a pivot for bullish movement.
1st support: 0.8502
Supporting reasons: Recognized as a multi-swing low support with confluence from the 127.20% Fibonacci Extension, indicating a significant area where buying pressure may intensify, potentially providing additional support for upward movement.
1st resistance: 0.8581
Supporting reasons: Noted as a pullback resistance, suggesting a level where selling pressure may intensify, potentially hindering further upward movement.
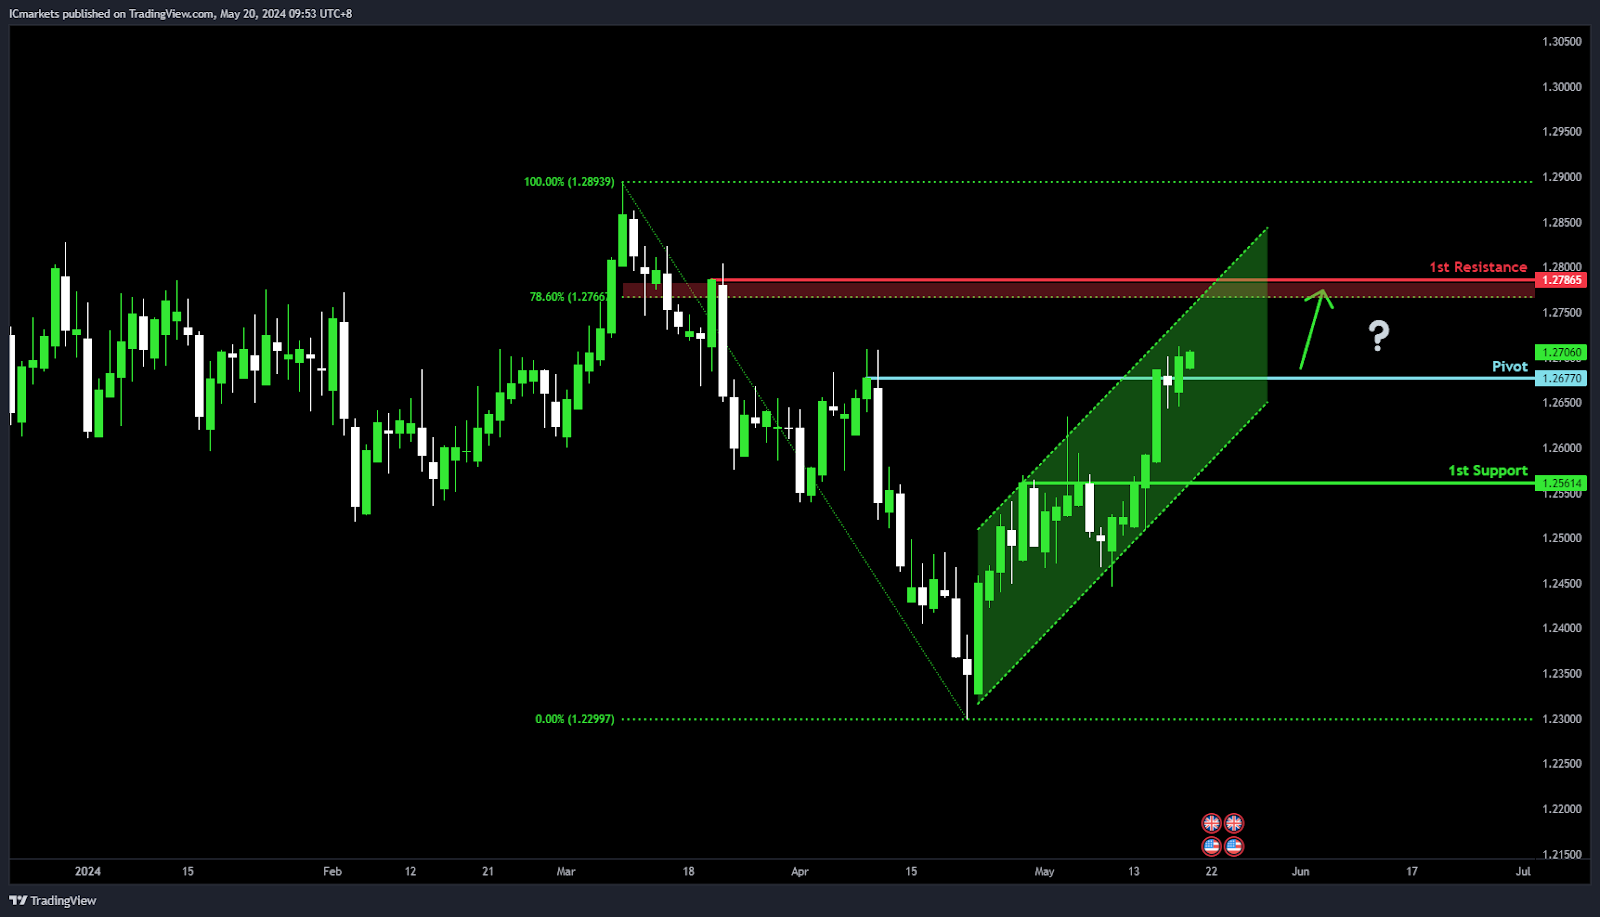
GBP/USD:
Potential Direction: Bullish
Overall momentum of the chart: Bullish
Factors contributing to the momentum is that price is: In a bullish ascending channel
Price could potentially make a: Bullish bounce off pivot and heads towards 1st resistance
Pivot: 1.2677
Supporting reasons: Identified as a pullback support, suggesting a level where buying interest may emerge, potentially acting as a pivot for bullish movement.
1st support: 1.2561
Supporting reasons: Recognized as a pullback support, indicating another level where buying interest may emerge, potentially providing additional support for upward movement.
1st resistance: 1.2786
Supporting reasons: Noted as a pullback resistance with confluence from the 78.60% Fibonacci Retracement, suggesting a significant area where selling pressure may intensify, potentially hindering further upward movement.
GBP/JPY:
Potential Direction: Bullish
Overall momentum of the chart: Bullish
Factors contributing to the momentum is that price is: Above the bullish Ichimoku cloud
Price could potentially make a: Bullish breakthrough of pivot and rise to 1st resistance
Pivot: 198.03
Supporting reasons: Identified as a pivot with confluence from the swing high resistance, indicating a significant area where buying pressure may intensify, potentially leading to a bullish breakthrough.
1st support: 193.43
Supporting reasons: Recognized as an overlap support, suggesting a historical level where buying interest has emerged, potentially acting as a support for upward movement.
1st resistance: 203.01
Supporting reasons: Noted as a significant resistance level with confluence from the 127.20% Fibonacci Extension, suggesting a potential target for bullish movement.

USD/CHF:
Potential Direction: Bearish
Overall momentum of the chart: Bearish
Price could potentially make a: Bearish reaction off pivot and drop to 1st support
Pivot: 0.9098
Supporting reasons: Identified as an overlap resistance with confluence from the 50% Fibonacci Retracement, suggesting a significant area where selling pressure may intensify, potentially leading to a bearish reaction.
1st support: 0.8994
Supporting reasons: Recognized as an overlap support, indicating a historical level where buying interest has emerged, potentially acting as a support for downward movement.
1st resistance: 0.9193
Supporting reasons: Noted as a swing high resistance, indicating a significant historical level where selling pressure may be present, potentially hindering further upward movement.
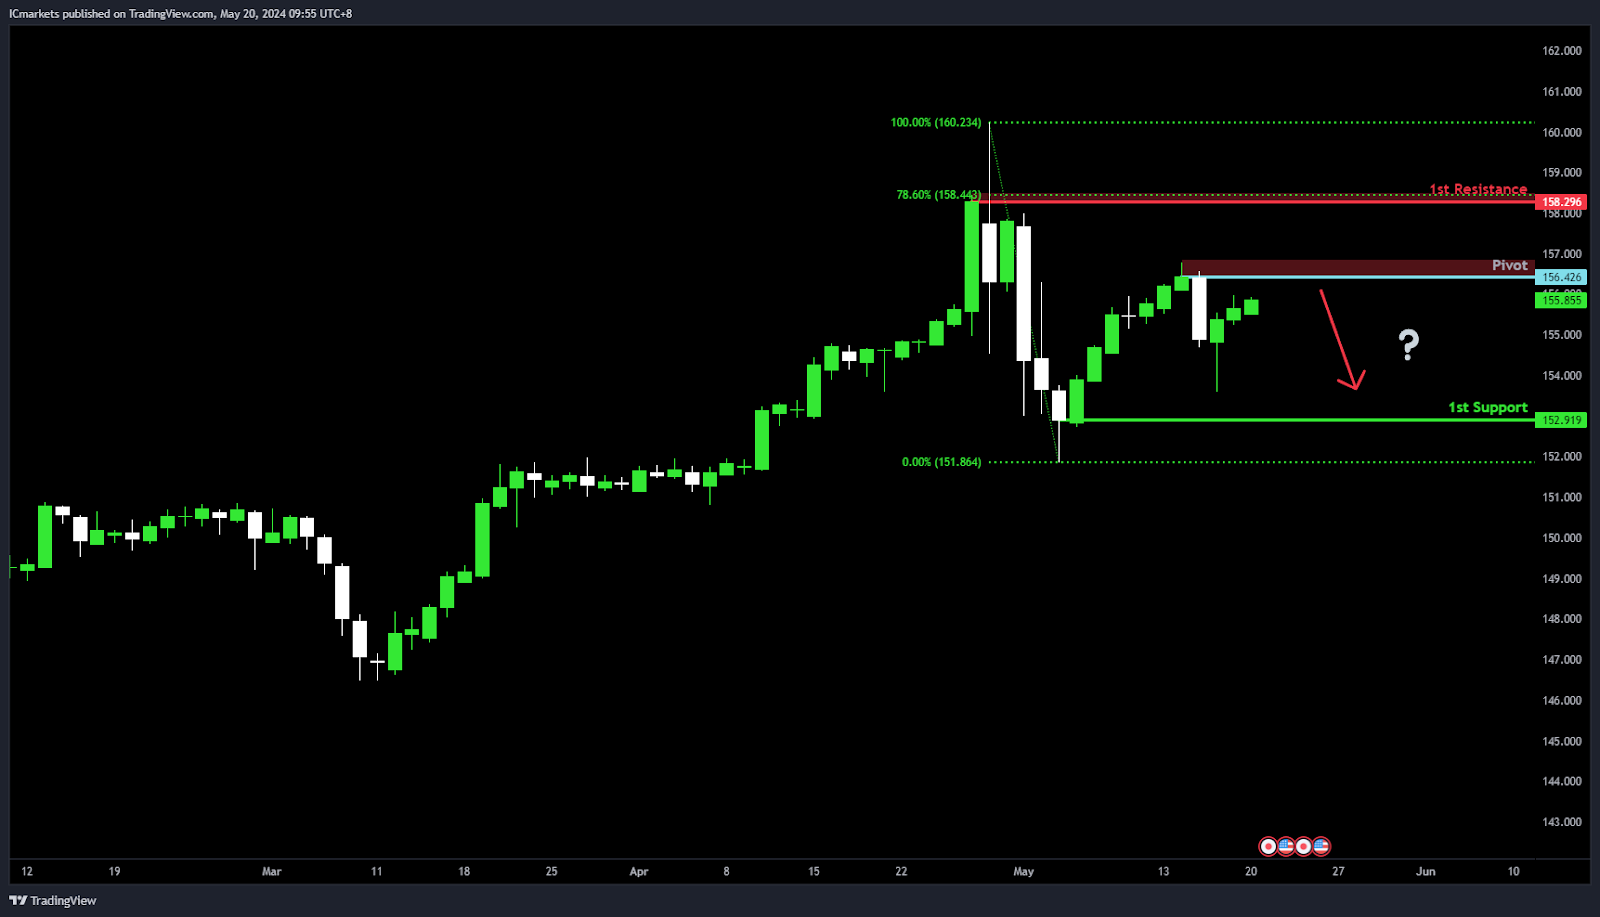
USD/JPY:
Potential Direction: Bearish
Overall momentum of the chart: Bearish
Price could potentially make a: Bearish reaction off pivot and drop to 1st support
Pivot: 156.42
Supporting reasons: Identified as a pivot with confluence from the swing high resistance, indicating a significant area where selling pressure may intensify, potentially leading to a bearish reaction.
1st support: 152.91
Supporting reasons: Recognized as a swing low support, suggesting a historical level where buying interest has emerged, potentially acting as a support for downward movement.
1st resistance: 158.29
Supporting reasons: Noted as a swing high resistance with confluence from the 78.60% Fibonacci Retracement, indicating a significant historical level where selling pressure may be present, potentially hindering further upward movement.

USD/CAD:
Potential Direction: Bearish
Overall momentum of the chart: Bearish
Price could rise towards the pivot and potentially make a bearish reaction off this level to resume the downtrend and drop towards the 1st support.
Pivot: 1.3650
Supporting reasons: Identified as an overlap resistance, suggesting a significant area where price could stall and reverse to resume the downtrend.
1st support: 1.3519
Supporting reasons: Identified as a pullback support that aligns close to a 50% Fibonacci retracement level, suggesting an area where price has found strong buying interests in the past to potentially halt any further downward movement.
1st resistance: 1.3725
Supporting reasons: Identified as a pullback resistance that aligns close to a 50% Fibonacci retracement level, marking a significant barrier that could cap further upward movements.

AUD/USD:
Potential Direction: Bearish
Overall momentum of the chart: Bullish
Price is rising towards the pivot and could potentially make a bearish reaction off this level to drop towards the 1st support.
Pivot: 0.6721
Supporting reasons: Acts as an overlap resistance that aligns with a 127.2% Fibonacci extension level, suggesting an area where selling pressures could intensify.
1st support: 0.6640
Supporting reasons: Acts as a pullback support that aligns with a 23.6% Fibonacci retracement level, suggesting a significant area where price has found strong support recently to provide a basis to halt further downward movement.
1st resistance: 0.6762
Supporting reasons: Identified as an overlap resistance that aligns with a 78.6% Fibonacci retracement level, marking a barrier that has previously capped upward movements.

NZD/USD
Potential Direction: Bearish
Overall momentum of the chart: Bullish
Price is rising towards the pivot and could potentially make a bearish reaction off this level to drop towards the 1st support.
Pivot: 0.6176
Supporting reasons: Acts as a pullback resistance that aligns with a 61.8% Fibonacci retracement level, suggesting an area where selling pressures have intensified in the past.
1st support: 0.6081
Supporting reasons: Acts as an overlap support, suggesting a potential area where price could find strong support to halt further downward movement.
1st resistance: 0.6247
Supporting reasons: Identified as an overlap resistance that aligns close to a 78.6% Fibonacci retracement level, marking a barrier that has previously capped upward movements.

US30 (DJIA):
Potential Direction: Bullish
Overall momentum of the chart: Bullish
Price could make a bullish reaction off the pivot to extend the uptrend momentum and rise towards the 1st resistance.
Pivot: 39,993.29
Supporting reasons: Identified as a breakout level where the bullish momentum could potentially cause prices to break above this level and climb higher.
1st support: 39,427.69
Supporting reasons: Identified as an overlap support, suggesting a significant area where price could find strong buying interests to provide a solid foundation to halt further downward movement.
1st resistance: 40,801.76
Supporting reasons: Identified as a resistance that aligns with a 127.2% Fibonacci extension level, indicating a potential barrier that could cap any upward movements.

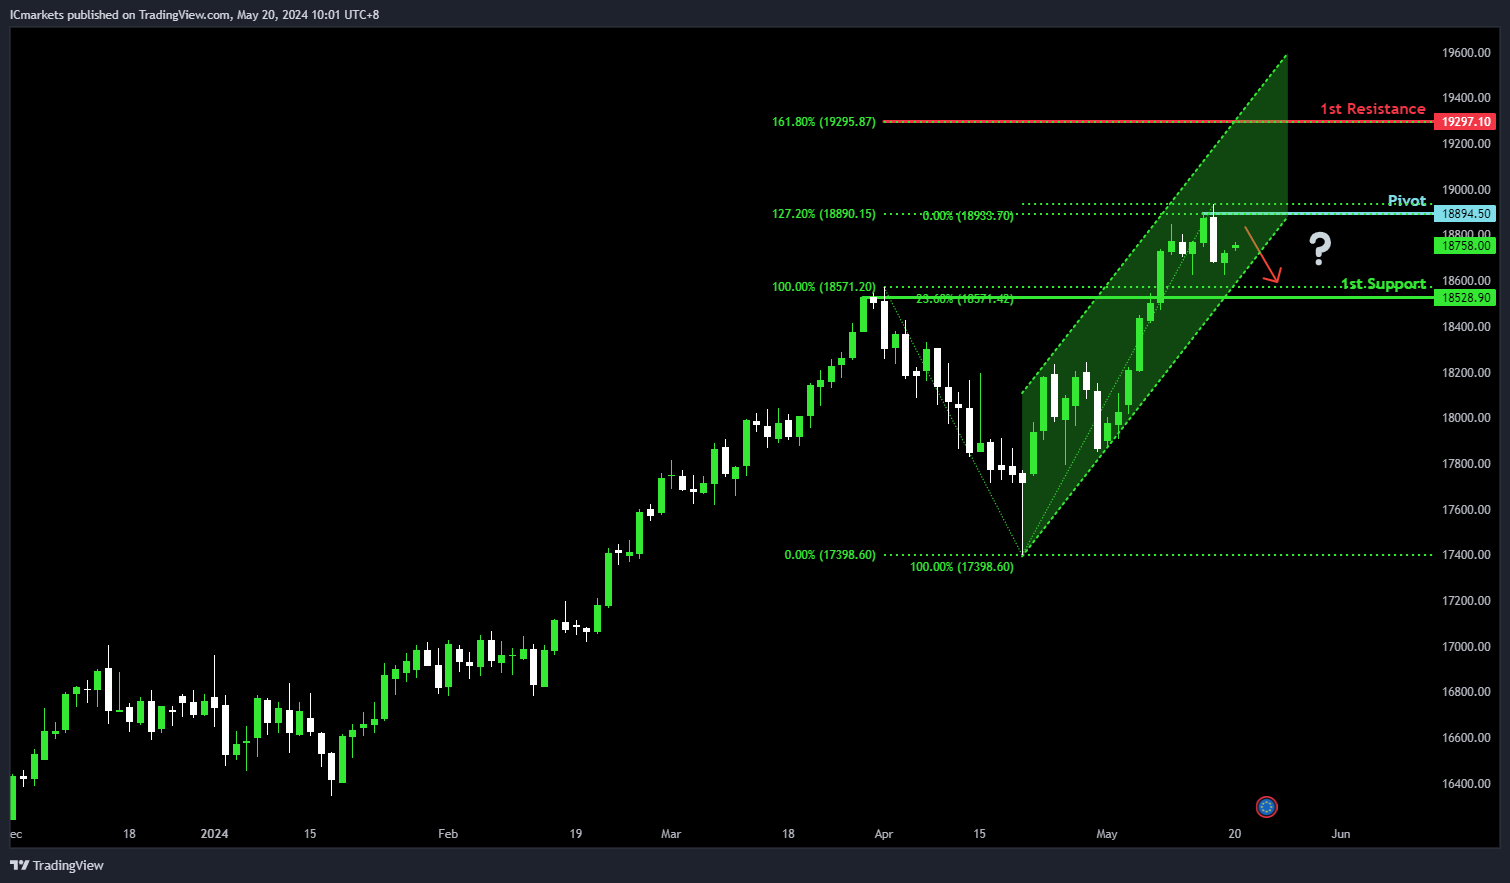
DE40 (DAX):
Potential Direction: Bearish
Overall momentum of the chart: Bullish
Price is rising towards the pivot and could potentially make a bearish reaction off this level to pull back towards the 1st support.
Pivot: 18,894.50
Supporting reasons: Identified as a pullback resistance that aligns with a 127.2% Fibonacci extension level, suggesting an area where selling pressures could intensify.
1st support: 18,528.90
Supporting reasons: Acts as a pullback support that aligns with a 23.6% Fibonacci retracement level, suggesting an area where buying interests could pick up to halt further downward movement.
1st resistance: 19,297.10
Supporting reasons: Identified as a resistance that aligns with a 161.8% Fibonacci extension level, potentially functioning as a barrier that could cap any upward movements.
US500 (S&P 500):
Potential Direction: Bearish
Overall momentum of the chart: Bullish
Price is rising towards the pivot and could potentially make a bearish reaction off this level to pull back towards the 1st support.
Pivot: 5,381.03
Supporting reasons: Identified as a resistance that aligns with a 127.2% Fibonacci extension level; suggesting an area where selling pressures could intensify.
1st support: 5,263.47
Supporting reasons: Acts as a pullback support, suggesting a significant area where price could find strong buying interest to provide a solid foundation to halt further downward movement.
1st resistance: 5,504.20
Supporting reasons: Acts as a resistance that aligns with a 161.8% Fibonacci extension level, suggesting a significant area where selling pressures could intensify.

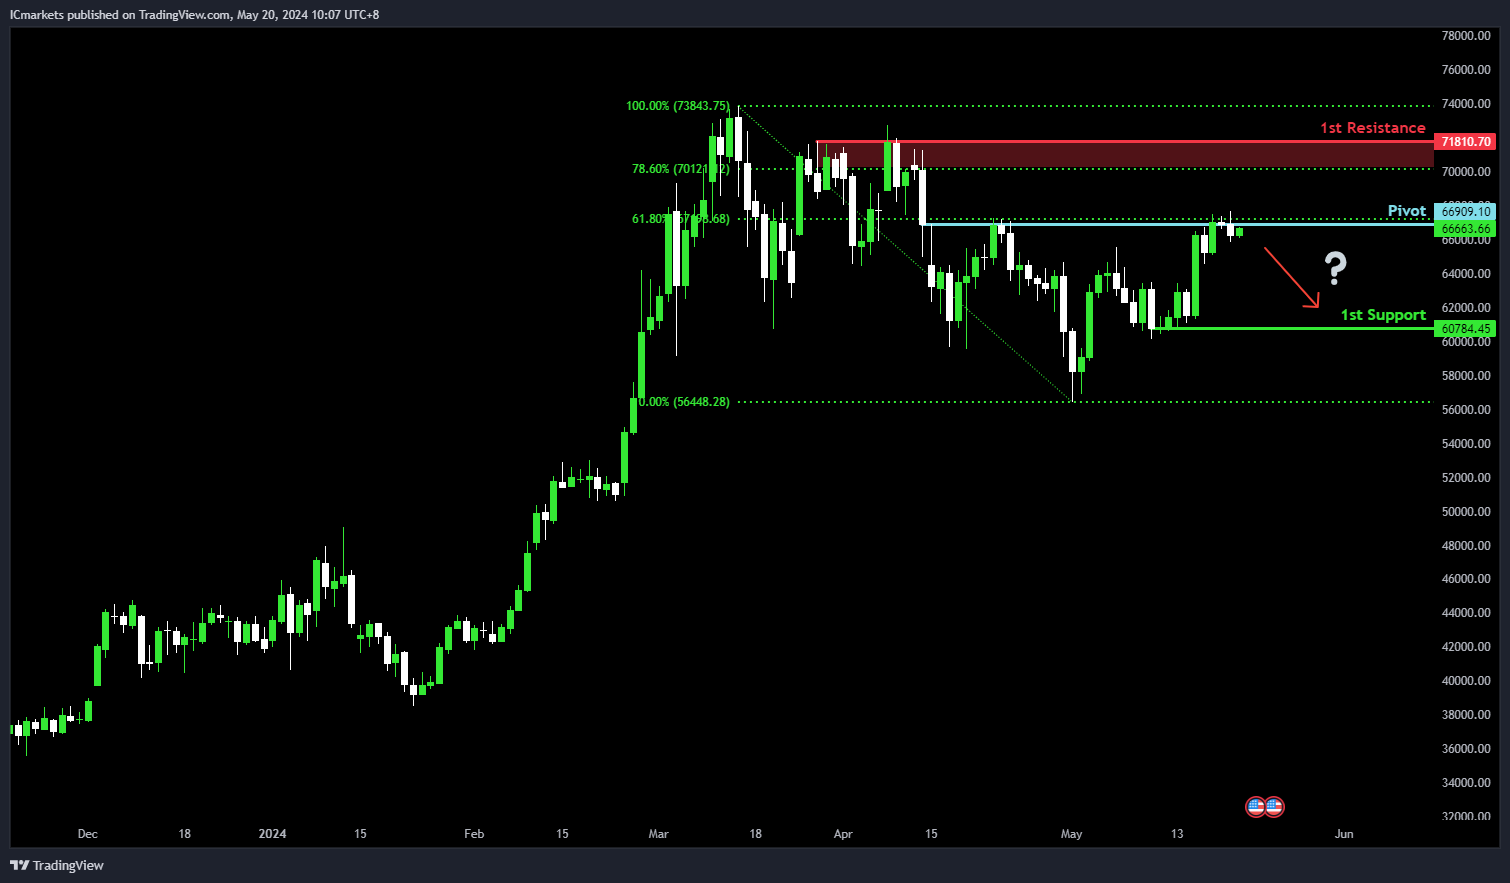
BTC/USD (Bitcoin):
Potential Direction: Bearish
Overall momentum of the chart: Neutral
Price is trading close to the pivot and could potentially make a bearish reaction off this level to drop towards the 1st support.
Pivot: 66,909.10
Supporting reasons: Identified as an overlap resistance that aligns with a 61.8% Fibonacci retracement level, suggesting an area where selling pressures have intensified in the past.
1st support: 60,784.45
Supporting reasons: Acts as a pullback support, suggesting an area where buying interests could pick up to halt further downward movements.
1st resistance: 71,810.70
Supporting reasons: Marked by a pullback resistance that aligns close to a 78.6% Fibonacci retracement level, indicating a significant barrier that could cap further upward movements.
ETH/USD (Ethereum):
Potential Direction: Bearish
Overall momentum of the chart: Neutral
Price is trading close to the pivot and could potentially make a bearish reaction off this level to drop towards the 1st support.
Pivot: 3,135.34
Supporting reasons: Identified as a pullback resistance, suggesting an area where selling pressures have intensified in the past.
1st support: 2,863.34
Supporting reasons: Identified as a pullback support, suggesting a significant area which could provide a strong foundation to halt further downward movements.
1st resistance: 3,283.31
Supporting reasons: Identified as an overlap resistance that aligns with a 38.2% Fibonacci retracement level, marking a significant barrier that could cap further upward movements.

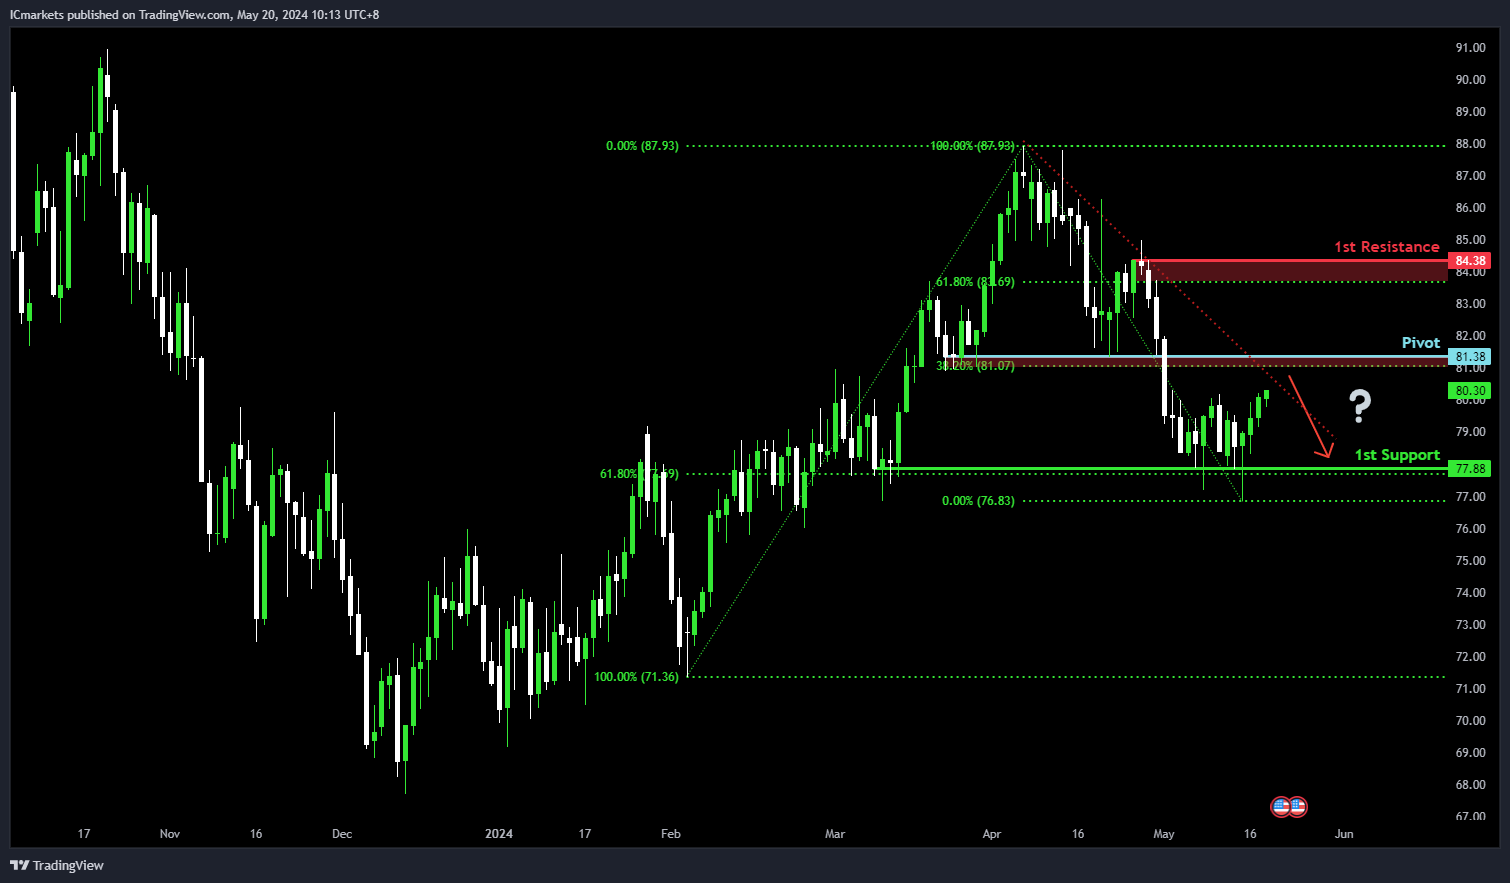
WTI/USD (Oil):
Potential Direction: Bearish
Overall momentum of the chart: Neutral
Price is rising towards the pivot and could potentially make a bearish reaction off this level to drop towards the 1st support.
Pivot: 81.38
Supporting reasons: Acts as a pullback resistance that aligns close to a 38.2% Fibonacci retracement level, suggesting a significant area where selling pressures could intensify. The presence of a descending trendline also adds further significance to a major resistance zone.
1st support: 77.88
Supporting reasons: Identified as a pullback support that aligns with a 61.8% Fibonacci retracement level, suggesting a significant area where price has previously found strong buying interest recently and could provide a solid foundation to halt further downward movements.
1st resistance: 84.38
Supporting reasons: Identified as a pullback resistance that aligns close to a 61.8% Fibonacci retracement level, marking a significant barrier that could cap further upward movements.
XAU/USD (GOLD):
Potential Direction: Bullish
Overall momentum of the chart: Bullish
Factors contributing to the momentum is that price is: Above the bullish Ichimoku cloud
Price could potentially make a: Bullish bounce off pivot and heads towards 1st resistance
Pivot: 2396.50
Supporting reasons: Identified as a pullback support, suggesting a level where buying interest may emerge, potentially acting as a pivot for bullish movement.
1st support: 2338.16
Supporting reasons: Recognized as an overlap support, indicating a historical level where buying interest has emerged, potentially providing additional support for upward movement.
1st resistance: 2474.00
Supporting reasons: Noted as a significant resistance level with confluence from the 127.20% Fibonacci Extension, suggesting a potential target for bullish movement.

The accuracy, completeness and timeliness of the information contained on this site cannot be guaranteed. IC Markets does not warranty, guarantee or make any representations, or assume any liability regarding financial results based on the use of the information in the site.
News, views, opinions, recommendations and other information obtained from sources outside of www.icmarkets.com.au, used in this site are believed to be reliable, but we cannot guarantee their accuracy or completeness. All such information is subject to change at any time without notice. IC Markets assumes no responsibility for the content of any linked site.
The fact that such links may exist does not indicate approval or endorsement of any material contained on any linked site. IC Markets is not liable for any harm caused by the transmission, through accessing the services or information on this site, of a computer virus, or other computer code or programming device that might be used to access, delete, damage, disable, disrupt or otherwise impede in any manner, the operation of the site or of any user’s software, hardware, data or property.


