A note on lower timeframe confirming price action…
Waiting for lower timeframe confirmation is our main tool to confirm strength within higher timeframe zones, andhas really been the key to our trading success. It takes a little time to understand the subtle nuances, however, as each trade is never the same, but once you master the rhythm so to speak, you will be saved from countless unnecessary losing trades. The following is a list of what we look for:
- A break/retest of supply or demand dependent on which way you’re trading.
- A trendline break/retest.
- Buying/selling tails – essentially we look for a cluster of very obvious spikes off of lower timeframe support and resistance levels within the higher timeframe zone.
- Candlestick patterns. We tend to only stick with pin bars and engulfing bars as these have proven to be the most effective.
EUR/USD:
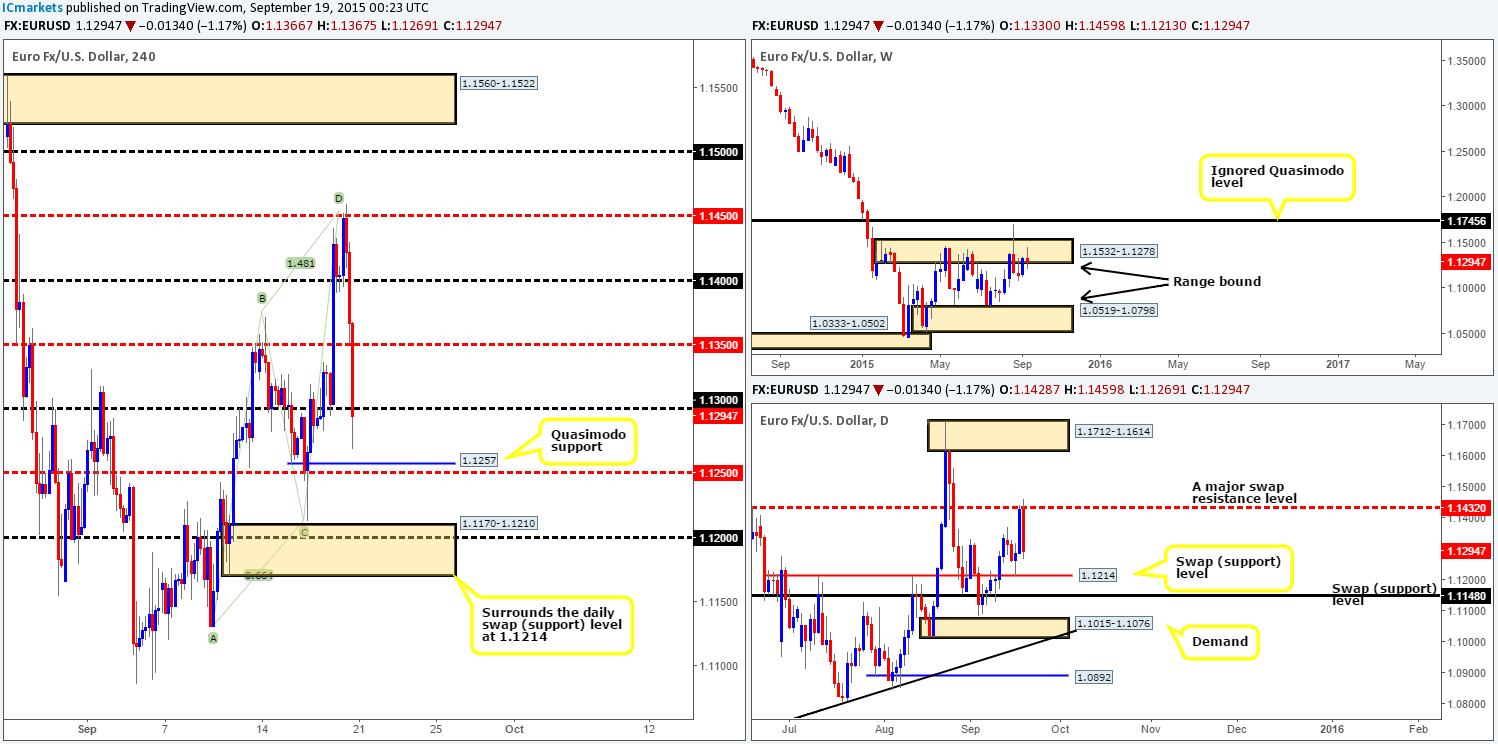
Weekly view:From this angle, we can see that despite the EUR/USD reaching highs of 1.1459 last week; price ended the week in negative territory losing forty or so pips into the close 1.1294. Technically, we’re not really surprised by this since let’s not forget that price has been seen loitering within supply at 1.1532-1.1278 for over three weeks now. Should we see a break above this barrier, we can likely expect the EUR to head north towards an ignored Quasimodo level at 1.1745.
Weekly levels to watch this week fall in at: 1.1532-1.1278/1.1745.
Daily view:From the daily scale, it’s clear to see that last week’s sell-off came from the underside of a historically proven swap resistance level seen at 1.1432. This was an area we completely missed in our previous report! From here, the next downside target to keep an eye on is a swap support level at 1.1214, followed closely by another swap support level at 1.1148.
Daily levels to watch this week fall in at: 1.1432/1.1214/1.1148.
4hr view:Friday’s 4hr action saw price initially retest the 1.1400 handle as support during early trade, which, as you can see, pressured the EUR up to mid-level resistance at 1.1450. Ultimately, we were looking to enter long from 1.1400, but unfortunately found little price action on the lower timeframes to confirm bullish strength.
Upon reaching 1.1450, price tanked over 150 pips, closing the week out just below 1.1300! Now, fundamentally, we have no idea why the EUR dropped so hard from here. However, from a technical standpoint, it was an almost perfect sell zone: A bearish Harmonic AB=CD completion point, 1.1450 mid-level resistance and not forgetting where price was positioned at that point on the higher timeframes (see above)!
On account of the points made above, our team ultimately believes the EUR has the potential to decline further this week. Assuming 1.1300 holds as resistance, it’s likely we’ll see bids around the Quasimodo support level at 1.1257 tagged in sometime today. Although this hurdle could provide a bounce for an intraday long, we believe it will eventually give way as traders will be looking to connect with the daily swap (support) level at 1.1214. This daily number not only trades close to psychological support 1.1200, but is also surrounded by a nice-looking 4hr demand zone at 1.1170-1.1210 as well. However, we have no intention in placing pending orders at the above said 4hr areas today/this week, since weekly selling pressure could possibly overwhelm any bids sitting here. Therefore, we’ll opt to wait for lower timeframe confirming price action before considering longs in this market.
Levels to watch/live orders:
- Buys:1.1257 [Tentative – confirmation required] (Stop loss: dependent on where one confirms this level) 1.1170-1.1210[Tentative – confirmation required] (Stop loss: dependent on where one confirms this area).
- Sells:Flat (Stop loss: N/A).
GBP/USD:
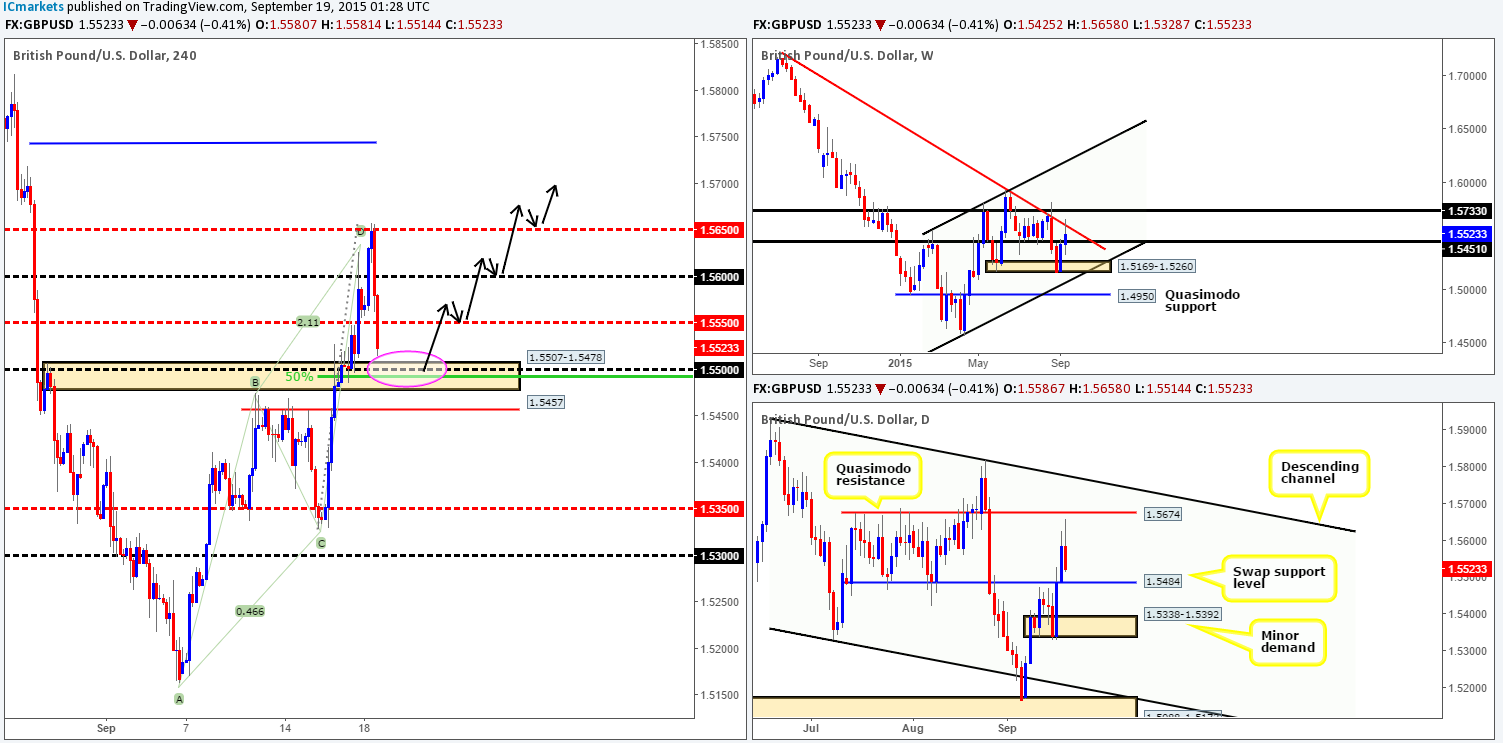
Weekly view:Although Pound Sterling posted gains of close to 100 pips last week; the pair actually reacted bearishlyto the underside of a major down trendline taken from the high1.7166. Nevertheless, before we start looking to short this market, we also have to take into account the fact that price also closed above a swap resistance level at 1.5451. It will be interesting to see what the lower timeframes have to offer…
Weekly levels to watch this week fall in at: The weekly down trendline/1.5451.
Daily view:Daily action shows that the GBP was reinforced during mid-week trade from minor demand coming in at 1.5338-1.5392, which saw this market continue to advance into Thursday’s sessions. However, going into Friday’s trade, the pair sold off from less than twenty pips below a Quasimodo resistance level at 1.5674, reaching lows of 1.5514 into the close 1.5523. The next downside target we have our eye on is seen at 1.5484 – a swap support level.
Daily levels to watch this week fall in at: 1.5674/1.5484/1.5338-1.5392.
4hr view:Like most major pairs on Friday, U.S. dollar strength saw Cable decline over 100 pips in value from the mid-level number 1.5650 – only a few pips above an AB=CD completion point at 1.5635. This move south took out both 1.5600/1.5550 and came within shouting distance of hitting a swap demand zone at 1.5507-1.5478 by the weeks end.
The structure of this pair can be boiled down to the following in our opinion:
- Weekly action shows price lodged tightly in between support at 1.5451 and a major down trendline (1.7166).
- Nearby support seen on the daily chart at 1.5484 could put a halt on any further selling, but could also be a nice barrier in which to look for longs potentially.
- Price on the 4hr timeframe is currently trading close to a possible buy zone (pink circle) in the form of a swap demand zone at 1.5507-1.5478.
Considering the above, our team is swaying more to the long side this week, mainly due to clear oncoming support being seen on the daily timeframe (see above). Therefore, we may, dependent on how the lower timeframe action responds to the current 4hr swap demand area,look to enter long, as it converges nicely with both 1.5500 and 50% Fibonacci support (1.5492). Should all go to plan, partial profits would immediately be taken at 1.5550, and from thereon we’d look to trail price behind lower timeframe supports in the event the market continued to push north.
Opportunities to pyramid long position may be seen during the week should price break above and retest the following numbers: 1.5500/1.5600/1.5650 (black arrows).
Levels to watch/ live orders:
- Buys: 1.5507-1.5478 [Tentative – confirmation required] (Stop loss: 1.5469).
- Sells: Flat (Stop loss: N/A).
AUD/USD:
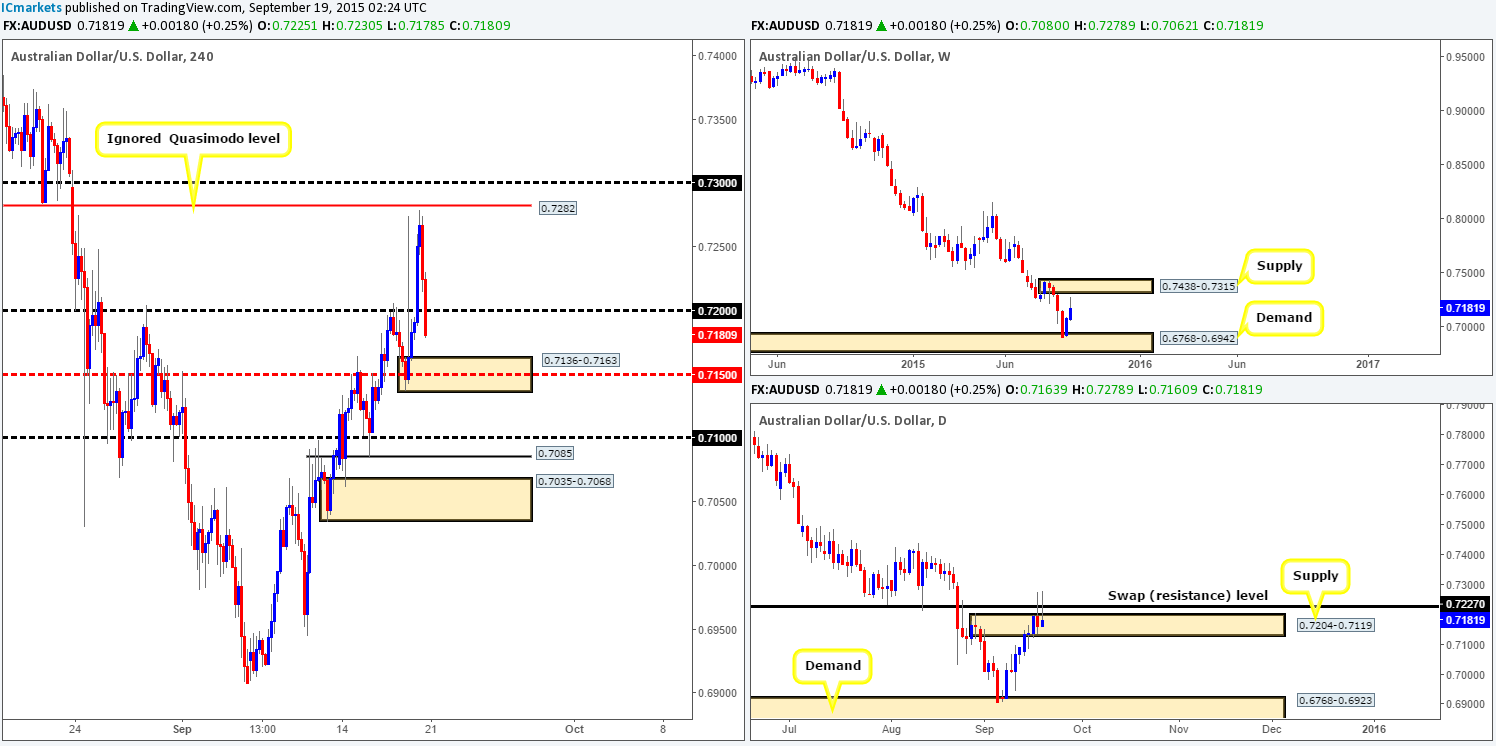
Weekly view:Following the rebound from demand at 0.6768-0.6942, price continued to extend higher last week gaining about ninety pips in value into the close 0.7181. In addition to this, the Aussie dollar came so very close to connecting with supply at 0.7438-0.7315. In fact, it came within forty pips, which is absolutely nothing considering that this is the weekly timeframe.
Weekly levels to watch this week fall in at:0.7438-0.7315/0.6768-0.6942.
Daily view:Rolling a page lower to the daily timeframe, we can see that Thursday and Friday’s action painted back-to-back selling wicks that pierced through both supply at 0.7204-0.7119, and a swap resistance level at 0.7227. Could this, coupled with a near hit of weekly supply, be enough to send this market lower this week? Let’s see what the 4hr timeframe has to say…
Daily levels to watch this week fall in at:0.7204-0.7119/0.7227.
4hr view:Going into Friday’s sessions, the bulls began strong. However, mid-way through London trade, this buying interest dried up and a heavy round of selling was seen from just below 0.7282 – a nice-looking ignored Quasimodo level. This, as you can see, printed two (near) full-bodied bearish candles, pushing price back below 0.7200 to end the week. The next downside target to watch comes in around demand at 0.7136-0.7163.
So, let’s see what we have here:
- Moderate selling seen from just below weekly supply at 0.7438-0.7315.
- Selling wicks seen on the daily scale that have on two occasions stabbed through two significant resistances (0.7204-0.7119/0.7227).
- Little room for price to continue lower on the 4hr timeframe as demand sits just below at 0.7136-0.7163.
Given the above, we have little interest buying from the current 4hr demand zone. Instead, what we’re going to be looking for early on in the week is a deep push into this zone and a break below/retest of the mid-level hurdle seen within at 0.7150. This will, in effect, be our cue to begin watching for lower timeframe selling confirmation to enter short. The reason for why we are looking to short within this demand rather than enter long should be obvious from the above. The higher timeframes are indicating further selling could be on the cards this week and we’re simply looking to take advantage of this potential momentum.
Levels to watch/ live orders:
- Buys: Flat (Stop loss: N/A).
- Sells: Watch for bids at 0.7150 to be consumed and then look to enter on any retest seen at this number (confirmation required).
USD/JPY:
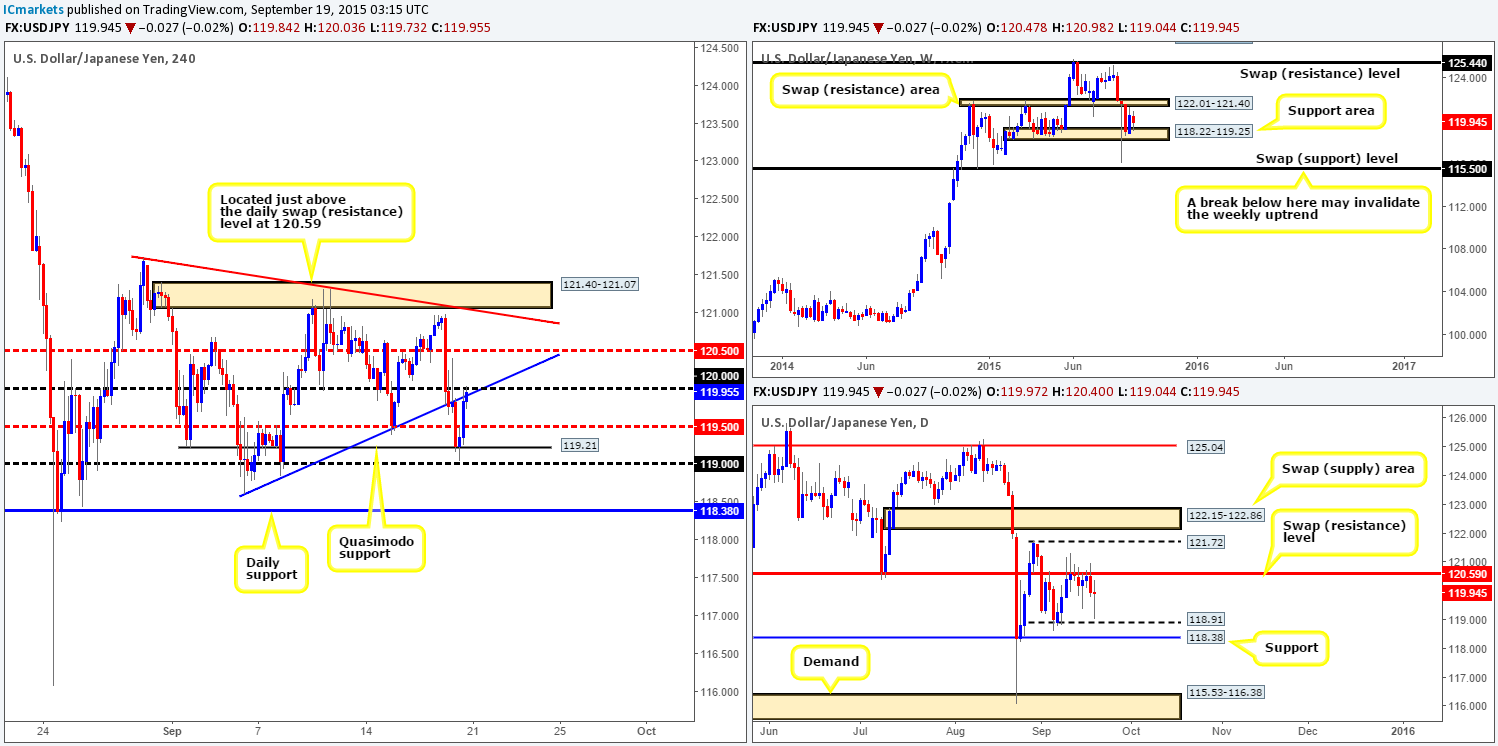
Weekly view:As can be seen from the chart, price continued to trade in between a swap resistance zone at 122.01-121.40 and a support area drawn from 118.22-119.25 last week. As such, despite this pair losing a little over sixty pips into the close 119.94, there’s little change to report from this timeframe.
Weekly levels to watch this week fall in at:122.01-121.40/118.22-119.25.
Daily view:Turning our attention to the daily chart, however, it easy enough to see that price has been held lower by a swap resistance level at 120.59 since the 09/09/15. Following Thursday’s solid response to this swap level, the bears attempted to drag this pair lower on Friday, but failed after coming within shouting distance of support at 118.91. Consequent to this, the two above said levels continue to be areas to keep an eye on this week.
Daily levels to watch this week fall in at: 120.59/118.91.
4hr view:During the course of Friday’s sessions price sold off, breaking out of the 4hr compressing pennant formation (121.72/118.83), and ending the week with this market hitting and slightly extending past a Quasimodo support at 119.21. This level clearly interested buyers, since a counter-attack back up 120.00 was quickly seen thereafter.
Now, with 120.00 boasting additional resistance from the underside of what was the lower limit of the aforementioned pennant formation, would we deem this a valid platform in which to look to sell from? Technically, from the 4hr timeframe, we would. However, looking at the higher timeframes, we see very little resistance backing 120.00, thus this number may be good for an intraday bounce lower, but anything other than that, we’d be hesitant.
Levels to watch/ live orders:
- Buys:Flat (Stop loss: N/A).
- Sells: 120.00[Tentative – confirmation required] (Stop loss: dependent on where one confirms this level).
USD/CAD:
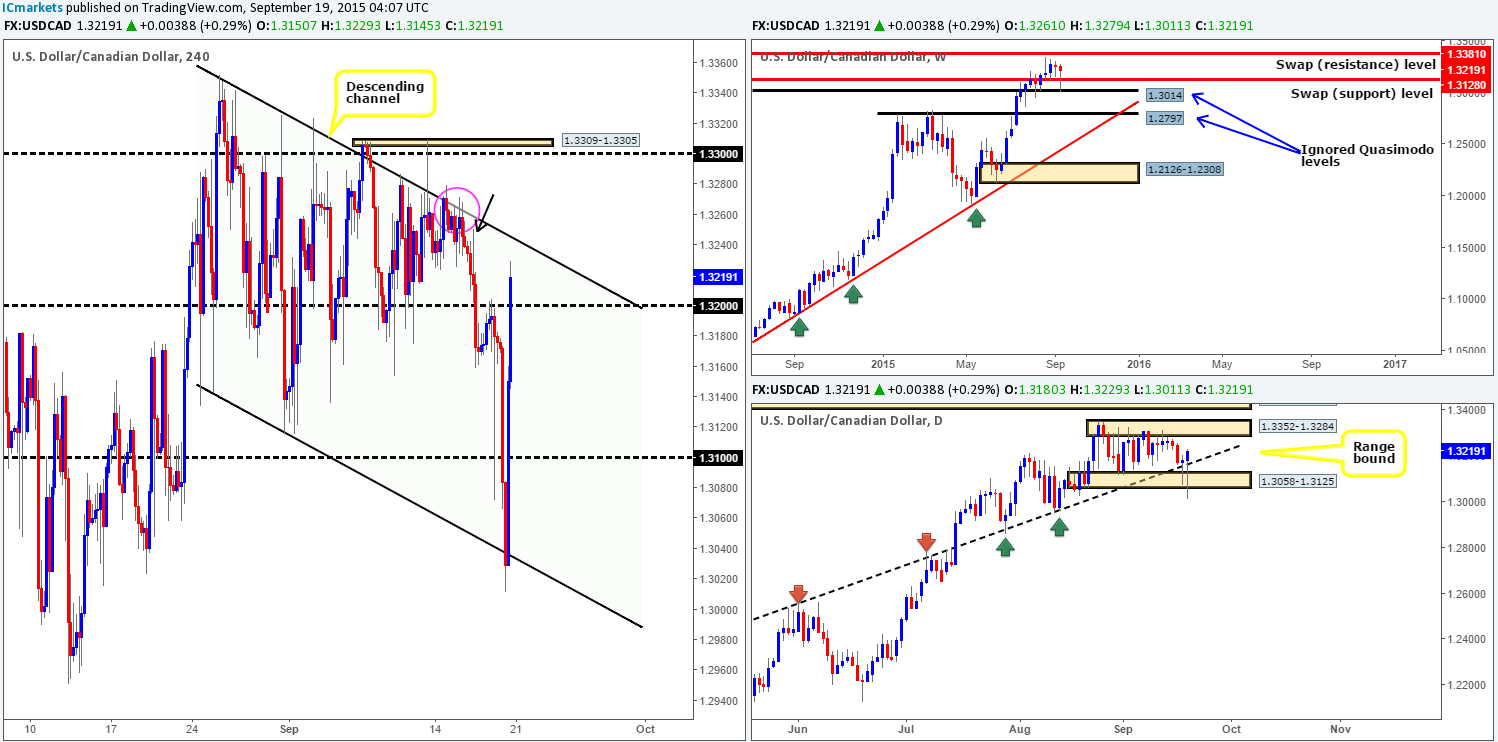
Weekly view:From the pits of the weekly timeframe, the USD/CAD closed the week (1.3219) painting a relatively nice-looking bullish pin off the back of an ignored Quasimodo barrier at 1.3014. Despite the fact that this pair actually lost a little over forty pips of value during trade last week, we believe this recent pin may suggest the bulls are intending to take things higher this week. Anyone see price hitting the swap resistance level at 1.3381?
Weekly levels to watch this week fall in at: 1.3014/1.3128/1.3381.
Daily view:Looking at the daily chart, it’s clear that supportive bids at the current daily range support (1.3058-1.3125) are still active – just look at those two buying tails printed during Thursday and Friday’s sessions! This, at least to us, indicates price will likely continue rallying this week up to range supply coming in at 1.3352-1.3284.
Daily levels to watch this week fall in at:1.3058-1.3125/1.3352-1.3284.
4hr view: The 4hr timeframe shows that the USD/CAD came alive as European traders entered the market on Friday. An aggressive sell-off took place, which, as a result, took out 1.1300 and drove price even lower to connect with the descending channel support taken from the low 1.3142. U.S traders wasted no time in getting in on the action as they collectively were seen buying into all those sells planted in the market during the European/London morning sessions.
With priceclosing twenty pips above the 1.3200 on Friday, coupled with room being seen for the market to move higher on both the weekly and daily charts, where do we see this market headed today/this week? Well, a retest of 1.3200 that does not hit the 4hr upper channel resistance (1.3352) would likely provide a stable enough platform to consider intraday longs from today (confirmation required). Other than this though, we’d need to see a break above the aforementioned 4hr channel resistance in order for us to be confident to buy this market further this week. The space above here is very nice indeed. We see a clear run up to 1.3300, since supply has likely been consumed at the 4hr supply marked with a pink circle at 1.3271-1.3249 by the wick marked with a black arrow (16/09/2015) at 1.3250. In the event price does indeed take out nearby channel resistance this week, we’d be looking for price to retest this barrier, and show some form of lower timeframe buying confirmation to enter long. It will be interesting to see how this plays out!
Levels to watch/ live orders:
- Buys:1.3200 [Tentative – confirmation required] (Stop loss: dependent on where one confirms this level). Watch for offers at the 4hr descending channel resistance to be consumed and then look to enter on any retest seen at this barrier (confirmation required).
- Sells: Flat (Stop loss: N/A).
USD/CHF:
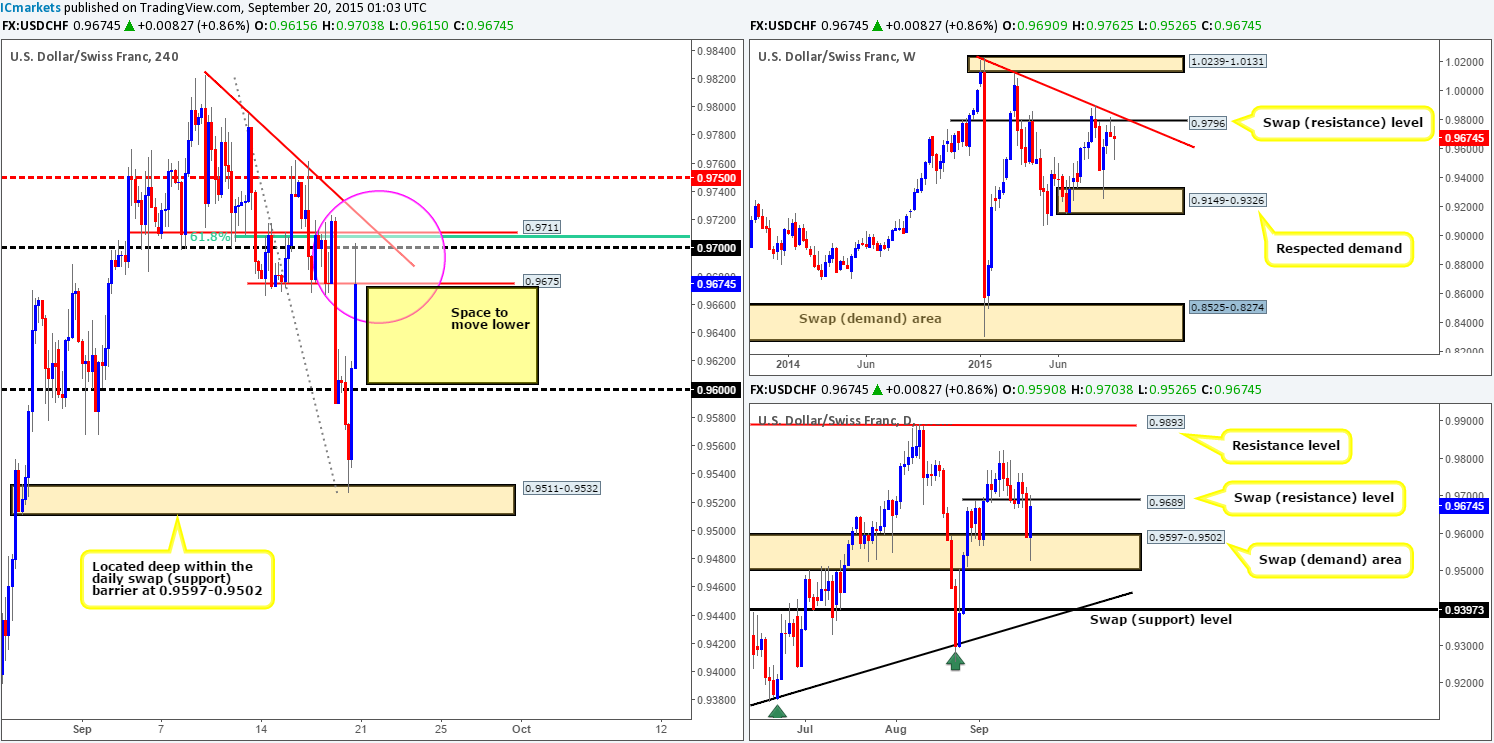
Weekly view:Following the bearish pin at the underside of the swap resistance level at 0.9796, price initially extended south reaching a low of 0.9527 on the week. However, the week ended closing only sixteen pips lower than the previous close (0.9691) at 0.9675. Do keep an eye on the 0.9796 barrier this week as price may retest this level to take out traders who shorted the weekly pin. Other than this though, we still see room for this market to sell-off down to at least weekly demand coming in at 0.9149-0.9326.
Weekly levels to watch this week fall in at: 0.9796/0.9149-0.9326.
Daily view:From this angle, however, it’s clear, at least from a technical standpoint, why buying interest was seen on the weekly timeframe last week. Friday’s daily action responded beautifully to a swap demand area at 0.9597-0.9502, which, as you can see, brought this market back up to a swap resistance level given at 0.9689 by the weeks end. A break above here this week, could pave the way north all the way back up to either the swing high 0.9822, or resistance seen at 0.9893 (positioned above the aforementioned weekly swap resistance level). Conversely, a push below the swap demand zone could set the stage for a continuation move down to the swap support level at 0.9373 (located just above the aforementioned weekly demand).
Daily levels to watch this week fall in at:0.9689/0.9597-0.9502/0.9893/0.9397.
4hr view: Amid Friday’s trade, price began the day relatively bearishly. The psychological support 0.9600 was taken out and a fresh 4hr demand zone at 0.9511-0.9532 was tagged into the action. It was only once price reached this area did we see this market explode around 170 pips north, consequently connecting with offers at 0.9700 forcing price to close the week slightly below a swap resistance level at 0.9675.
Taking into account the above, we certainly believe a continuation sell-off is possible from either 0.9675 or the 0.9700 number just above it due to the following:
- Daily swap (resistance) sitting at 0.9689.
- 4hr swap (resistance) given at 0.9711.
- 4hr down trendline taken from the high 0.9822.
- 61.8% Fibonacci resistance at 0.9708.
- Space to move lower down to at least 0.9600.
Therefore, given the above, our team will be watching for lower timeframe selling confirmation around 0.9675 today. Should this level fail to hold, we’ll then switch our attention to looking for a confirmed sells above around the 0.9700 area. The reason we still require lower timeframe confirmation in such a confluent sell zone is because price may yet rally to retest the aforementioned weekly swap (resistance) barrier (see above).
Levels to watch/ live orders:
- Buys:Flat (Stop loss: N/A).
- Sells:0.9675 [Tentative – confirmation required] (Stop loss: dependent on where one finds confirmation) 0.9700 [Tentative – confirmation required] (Stop loss: dependent on where one finds confirmation).
DOW 30:
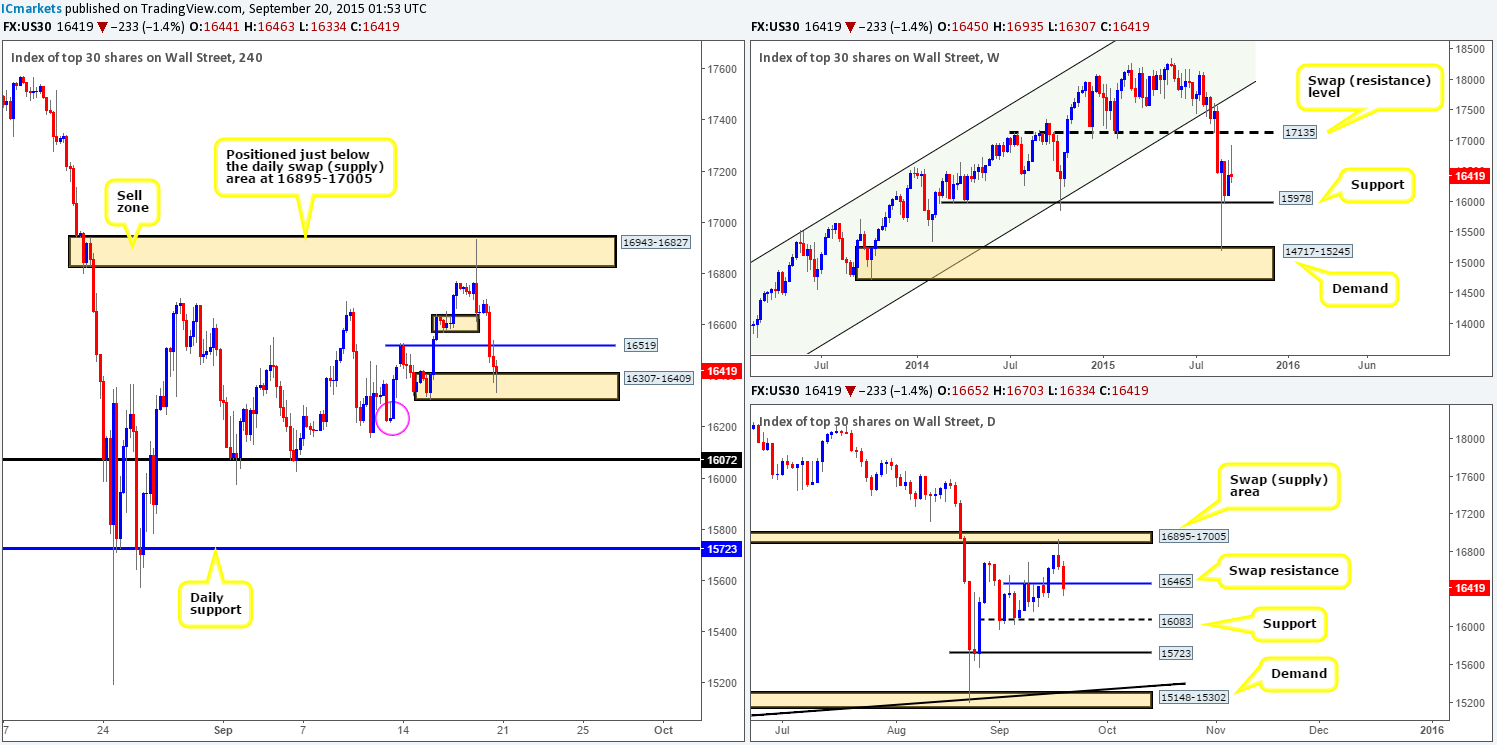
Weekly view: As can be seen from the chart, support at 15978 continues to provide a ‘floor’ to this market, but really, how long will this last? The reason we say this is because a huge amount of bids were likely removed from this level by that humongous bullish pinthree weeks ago. On top of that, a bearish pin also printed last week into the close 16419.Therefore, do note this level down in your watchlists this week since if price retests this barrier, we may see this level engulfed.
Weekly levels to watch this week fall in at: 15978.
Daily view:Following Thursday’s (near) to-the-pip reaction from the underside of a swap supply area at 16895-17005. Price continued to extend lower going into Friday’s trade. This forced the DOW to close the week out just below a swap support level coming in at 16465. In the event that 16465 holds as resistance this week, it is likely we’ll see a push down to 16083 (located just above the aforementioned weekly support), since we see little active demand to the left of current price on this timeframe.
Daily levels to watch this week fall in at: 16465/16083.
4hr view:As we already know from the above, the DOW continued to plunge going into Friday’s trade. Demand at 16570-16635 and a minor swap support level at 16519 were both consumed during this onslaught. The week ended with price colliding with a demand zone coming in at 16307-16409, which, as you can see, held relatively firm.
In respect to the above, the overall structure of this market can be summed up as follows:
- Weekly action shows little buying interest from support at 15978, which could eventually see the DOW decline in value.
- Price on the daily chart shows support at 16465 was taken out, which has likely cleared the path south for further downside towards the 16083 region.
- Active bids seem to be so far holding this market higher from 4hr demand at 16307-16409, but with the above points in mind, the most we see this market rallying to from here is 16519.
To that end, we’re not going to be looking to buy from the current 4hr demand today. Rather, we’re going to be looking for this area to be consumed and look to trade any retest (with confirmation) seen at this barrier as supply. Granted, one could say, ‘well, what about demand lurking just below current demand at 16216-16298 (pink circle)?’ This point is certainly valid, and they could very well be correct, demand could still be active here. Nonetheless, with the weekly and daily charts showing little bullish emphasis at the moment (see above), we’d say this demand will likely get taken out.
Should our analysis work out to be correct, and we manage to spot a sell on opportunity on the retest of 16307-16409, we’ll ultimately be eyeing the support level seen at 16072 as our take-profit level (only a few points below the aforementioned daily support level).
Levels to watch/ live orders:
- Buys: Flat (Stop loss: N/A).
- Sells:Watch for bids at 16307-16409 to be consumed and then look to enter on any retest seen at this area (confirmation required).
XAU/USD: (Gold)
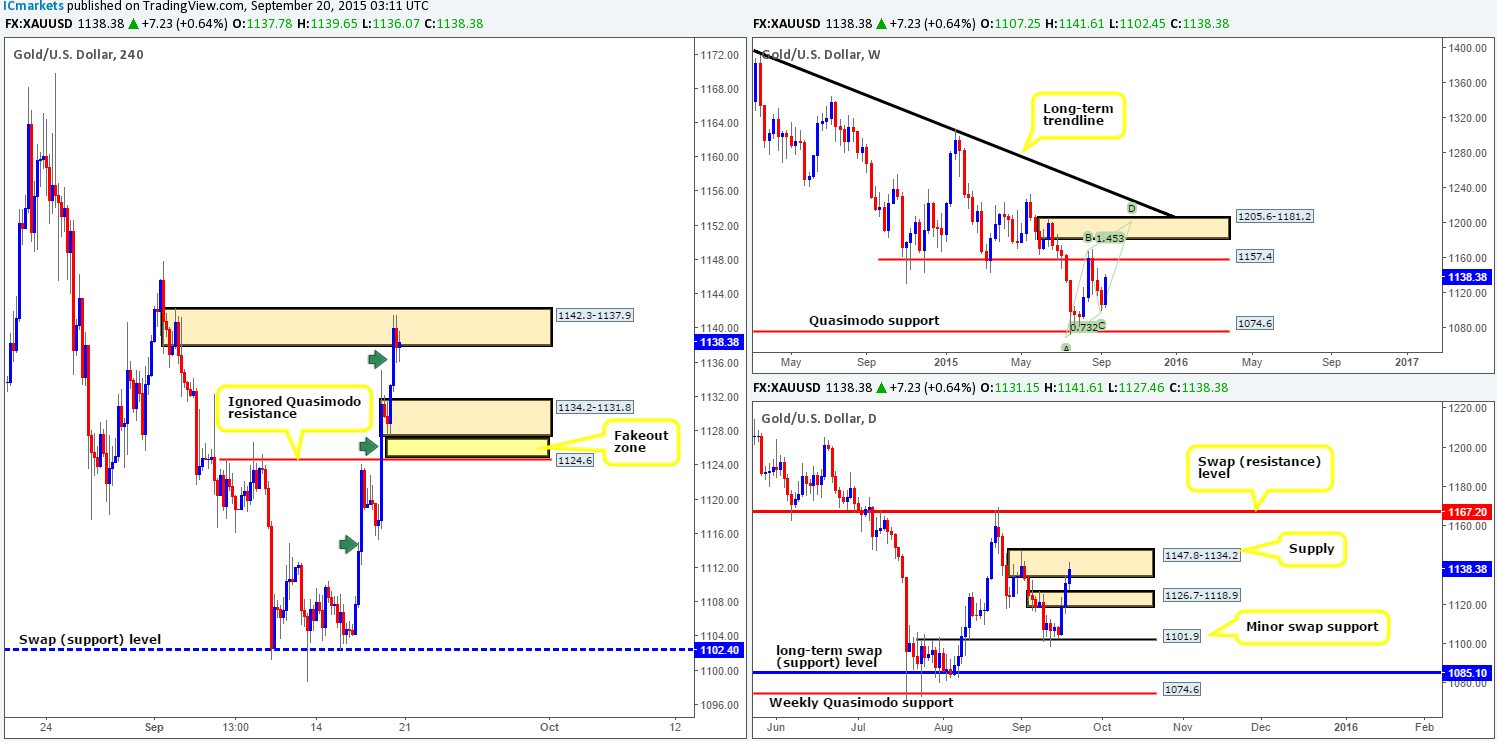
Weekly view:Following a three-week decline from 1157.4, last week’s action saw a heavy round of buying come into this market from the open 1107.2. Consequent to this, the price of Gold increased a little over $31 into the close 1138.3. Assuming that offers are now weak around the 1157.4 region, it is quite possible we may see Gold continue to rally up to supply at 1205.6-1181.2. This area, in our opinion, is a perfect sell zone, as it not only converges with a bearish Harmonic AB=CD completion point at 1199.4, but also with the underside of a long-term down trendline (1488.0).
Weekly levels to watch this week fall in at: 1157.4/1205.6-1181.2/1074.6.
Daily view:Turning our attention to the daily timeframe reveals that Gold only began climbing higher from Wednesday onwards last week. Supply at 1126.7-1118.9 was taken out and offers were triggered in at supply just above it at 1147.8-1134.2, which is where price concluded trade for the week. A break above current supply would likely force this market to challenge the swap resistance level coming in at 1167.2. Selling from the current supply on the other hand is tricky, as there is possibly a floor of active bids sitting just below at the recently broken supply, which, of course, is now demand. It will be interesting to see what the 4hr timeframe has to offer…
Daily levels to watch this week fall in at: 1147.8-1134.2/1126.7-1118.9/1167.2.
4hr view: From the pits of the 4hr timeframe, we can see a nice-looking three-drive pattern printed last week (green arrows) from the swap support level at 1102.4, which appears to have terminated at supply coming in at 1142.3-1137.9.
Selling from the current supply is certainly tempting considering that this base not only sits within the daily supply mentioned above at 1147.8-1134.2, but also shows room to move lower to at least demand at 1134.2-1131.8. On top of this, let’s not forget the approach – a three-drive reversal pattern!
However, selling from this barrier could potentially put you against weekly flow since there is little weekly resistance backing our 4hr supply area up. Therefore, we’d highly recommend only entering short at this zone should lower timeframe selling confirmation also be present.
Should our analysis be correct, and Gold does indeed decline in value, we would be interested in looking for confirmed buys at 1124.6 – an ignored Quasimodo level. Why this level, and not the demand at 1134.2-1131.8? Well, for starters, this area has ‘fakeout’ written all over it. It may look fresh, but this may be to tempt traders to buy here, and place their stops where? You guessed it! Right below the zone – a perfect pool of liquidity to buy into, hence the fakeout zone. In addition to this, if you scan across to the daily timeframe, you will notice that this ignored Quasimodo level sits nicely within the recently broken supply at 1126.7-1118.9, and the fresh 4hr demand is not! Which area would you rather buy at???
Levels to watch/ live orders:
- Buys: 1124.6 [Tentative – confirmation required] (Stop loss: dependent on where one confirms this level).
- Sells:1142.3-1137.9 [Tentative – confirmation required] (Stop loss: dependent on where one confirms this area).

