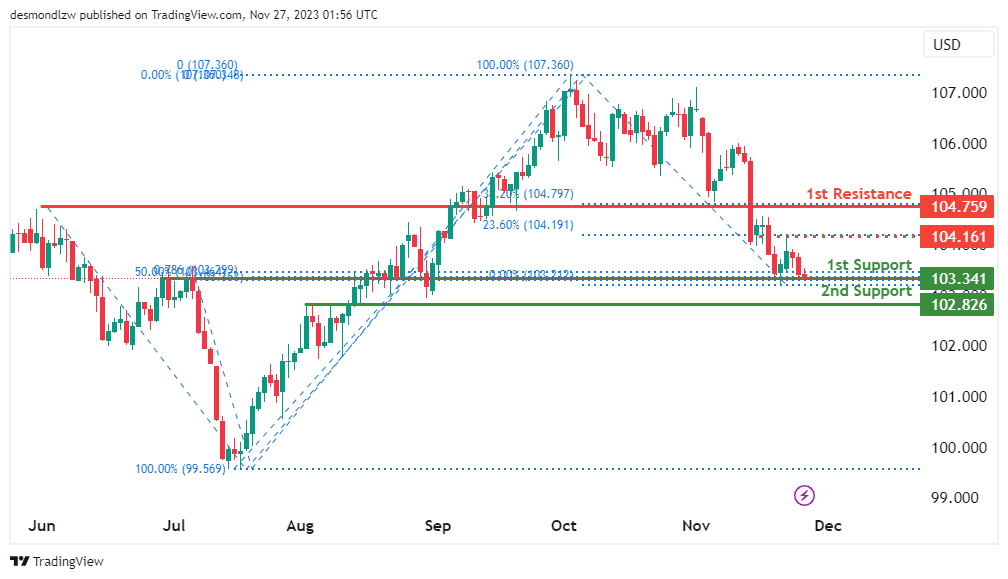
DXY:
The DXY (Dollar Index), the overall momentum of the chart is weak bullish with low confidence, suggesting a tentative upward bias. There’s a potential scenario where price could experience a bullish bounce off the 1st support and head towards the 1st resistance.
The 1st support at 103.34 is considered an overlap support, and it’s notable that there is a confluence of Fibonacci levels (50% Fibonacci Retracement and 78.60% Fibonacci Projection) at this level. This indicates that it’s a significant level where buying interest may emerge.
The 2nd support at 102.82 is also identified as an overlap support, reinforcing the idea that buyers could be active in this vicinity.
On the resistance side, the 1st resistance at 104.75 is categorized as pullback resistance and is associated with the 38.20% Fibonacci Retracement. This level could act as a barrier to further upward price movement.
There is also an intermediate resistance at 104.16, characterized as an overlap resistance and associated with the 23.60% Fibonacci Retracement.
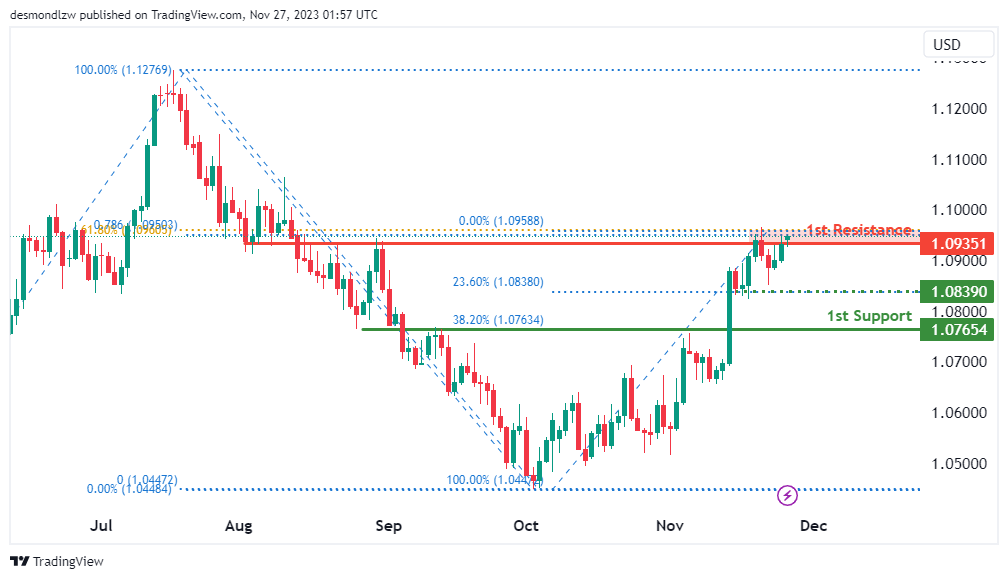
EUR/USD:
The EUR/USD, the overall momentum of the chart is bearish, indicating a downward trend. There’s a potential scenario where price could experience a bearish reaction off the 1st resistance and drop towards the 1st support.
The 1st support at 1.0765 is considered a pullback support and is associated with the 38.20% Fibonacci Retracement level. This level suggests that it’s a significant area where buyers might come in to support the price.
An intermediate support at 1.0839 is also identified, and it’s characterized as a swing low support. It aligns with the 23.60% Fibonacci Retracement, adding to its significance as a potential support level.
On the resistance side, the 1st resistance at 1.0935 is noted as a multi-swing high resistance. Importantly, there is Fibonacci confluence at this level, with both the 61.80% and 78.60% Fibonacci Retracement levels, making it a substantial barrier to upward movement.
EUR/JPY:
The analyzed instrument is EUR/JPY, and the overall momentum of the chart is currently bearish.
There is a potential for the price to make a bearish continuation towards the 1st support.
The 1st support level is identified at 161.78, and its favorable characteristics include being a swing low support, coinciding with the 78.60% Fibonacci Retracement, and aligning with the 61.80% Fibonacci Projection, indicating Fibonacci confluence.
The 2nd support level is situated at 159.86, and its favorable aspect is derived from being a pullback support.
On the resistance side, the 1st resistance is positioned at 164.21, and it is considered significant due to being an overlap resistance.
.

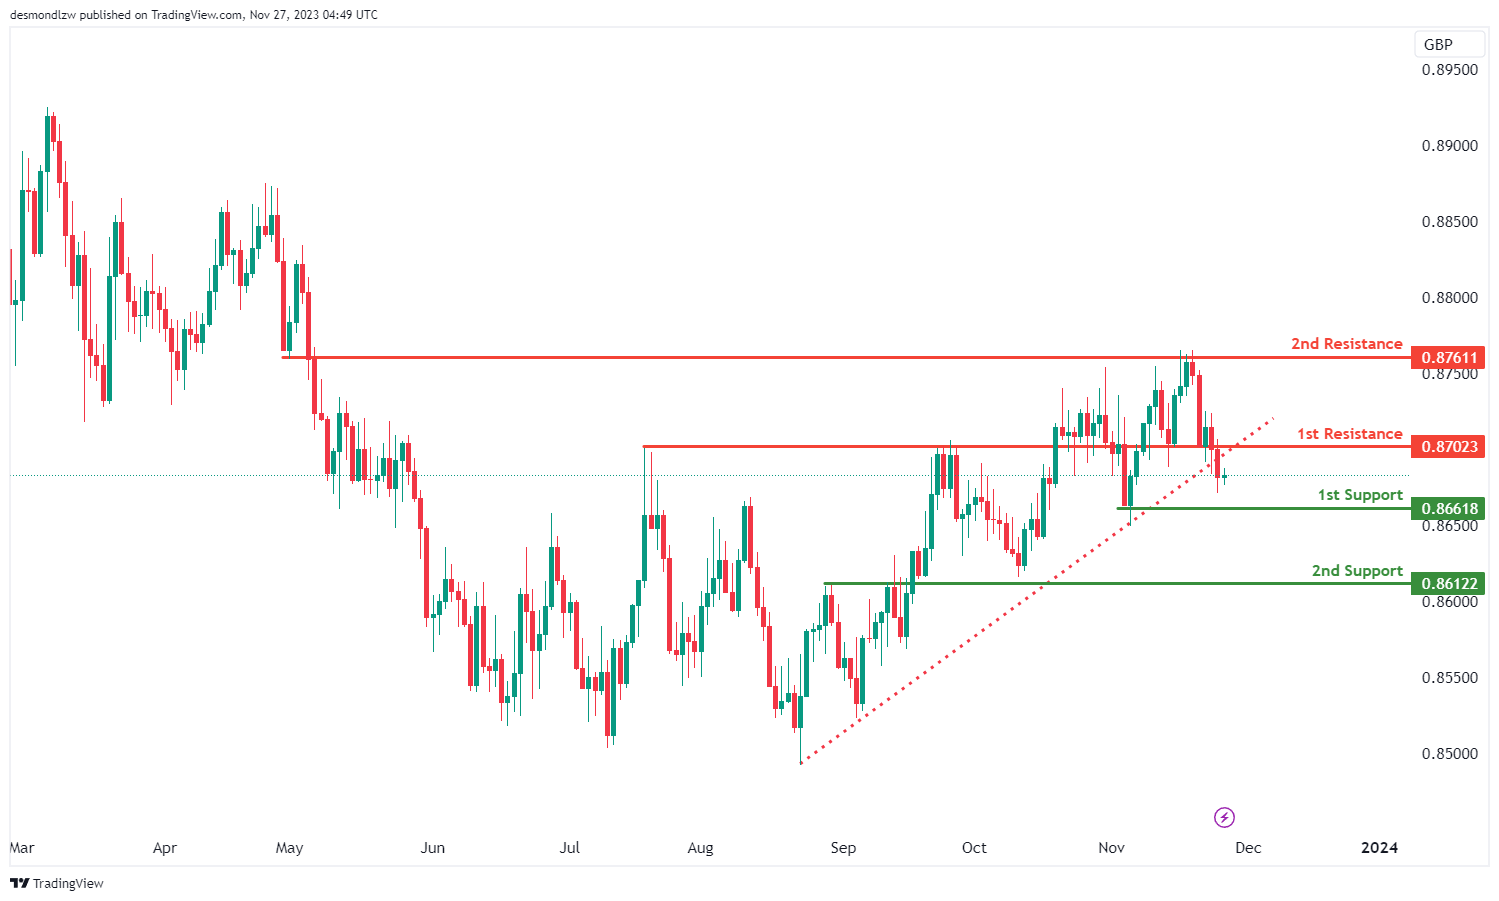
EUR/GBP:
The analyzed instrument is EUR/GBP, and the overall momentum of the chart is currently bearish. This bearish momentum is attributed to the fact that the price has broken below an ascending support line, triggering the potential for a bearish move.
There is a potential for the price to make a bearish continuation towards the 1st support.
The 1st support level is identified at 0.8661, and its favorable characteristic is attributed to being a swing low support.
The 2nd support level is situated at 0.8612, and its favorable aspect is derived from being a pullback support.
On the resistance side, the 1st resistance is positioned at 0.8702, and it is considered significant due to being a pullback resistance.
The 2nd resistance is located at 0.8761, and its significance is derived from being an overlap resistance.
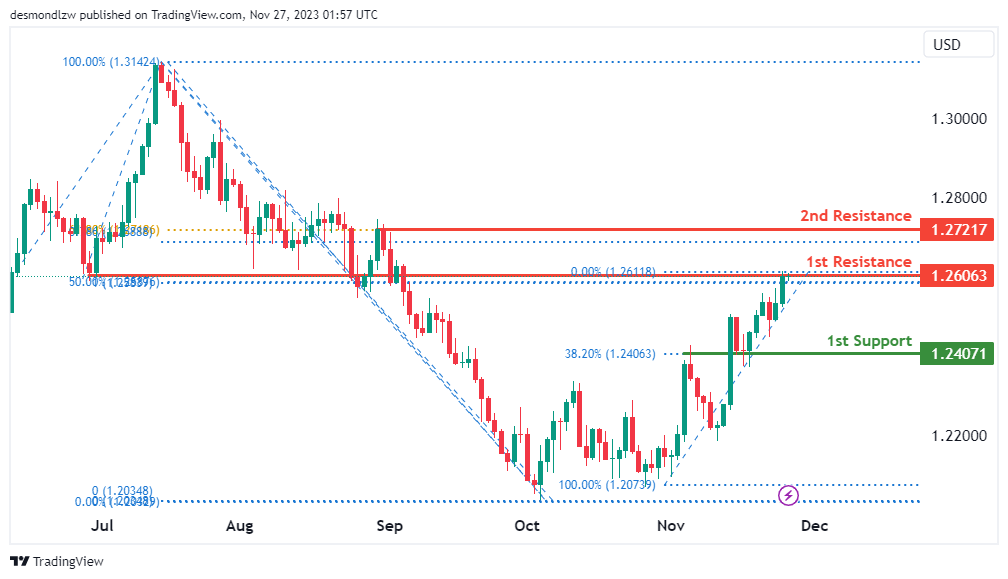
GBP/USD:
The GBP/USD, the overall momentum of the chart is bearish, indicating a downward trend. There’s a potential scenario where the price could experience a bearish reaction off the 1st resistance and drop to the 1st support.
The 1st support at 1.2407 is considered an overlap support level. It’s associated with the 38.20% Fibonacci Retracement, adding to its significance as a potential support area.
On the resistance side, the 1st resistance at 1.2606 is categorized as pullback resistance and is linked to the 50% Fibonacci Retracement level. This level suggests that it could act as a barrier to further upward movement.
Additionally, there’s a 2nd resistance at 1.2721, which is characterized as a swing high resistance. Notably, there is Fibonacci confluence at this level, with both the 61.80% Fibonacci Retracement and the 78.60% Fibonacci Projection indicating Fibonacci confluence. This makes it a strong resistance zone.
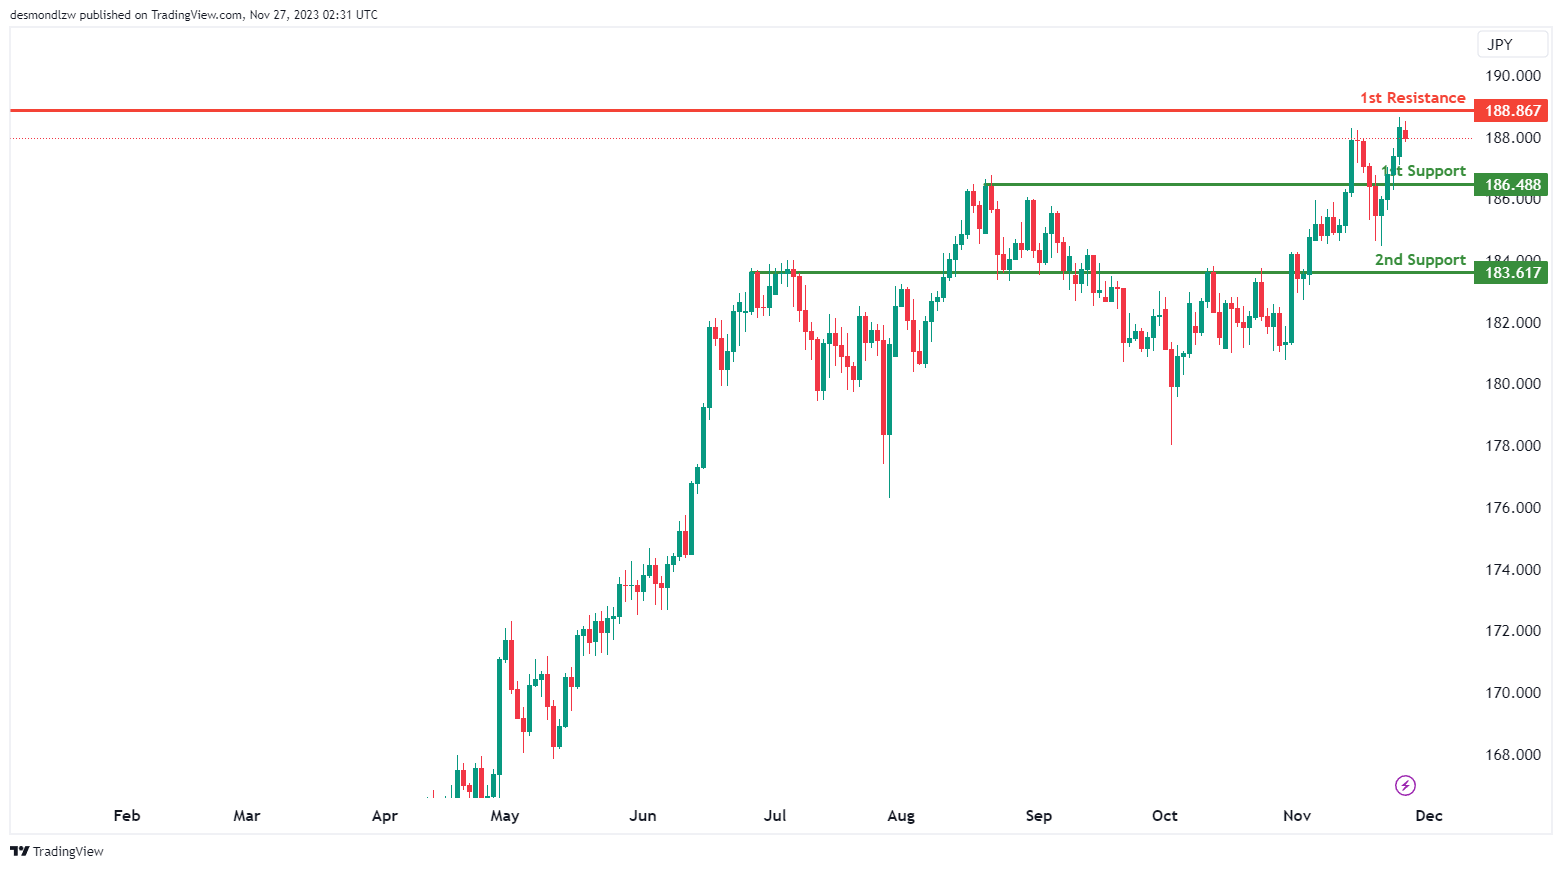
GBP/JPY:
The analyzed instrument is GBP/JPY, the overall momentum of the chart is bearish, indicating a downward trend. The price could potentially continue its bearish movement towards the 1st support.
The 1st support at 186.49 is considered a pullback support, suggesting that it’s a level where buyers may be inclined to step in. This level is where a bounce-back in price might occur.
The 2nd support at 183.62 is categorized as a multi-swing low support, implying that it has historically provided significant support to the currency pair. It represents another potential area where buyers might become active.
The 1st resistance at 188.87 is characterized as a pullback resistance, signifying that it’s a level where selling pressure may increase, acting as a potential obstacle to further upward price movement.
USD/CHF:
The USD/CHF, the overall momentum of the chart is bullish, indicating an upward trend. There’s a potential scenario where the price could experience a bullish bounce off the 1st support and move towards the 1st resistance.
The 1st support at 0.8777 is considered an overlap support level. Notably, there is Fibonacci confluence at this level, with both the 78.60% Fibonacci Projection and the -27% Fibonacci Expansion indicating Fibonacci confluence. This suggests that it’s a strong support zone where buying interest may emerge.
On the resistance side, the 1st resistance at 0.8892 is categorized as an overlap resistance. It’s a level where selling interest may be concentrated and could act as a barrier to further upward movement.

USD/JPY:
The USD/JPY, the overall momentum of the chart is bearish, indicating a downward trend. There’s a potential scenario where the price could experience a bearish reaction off the 1st resistance and drop towards the 1st support.
The 1st support at 147.29 is considered an overlap support level, suggesting it’s a zone where buying interest may emerge and provide support for the currency pair.
The 2nd support at 144.73 is also an overlap support level, indicating another potential area where buyers could become active.
On the resistance side, the 1st resistance at 152.93 is significant as it coincides with the 100% Fibonacci Projection. This level could act as a strong barrier to further upward movement.
Additionally, there’s an intermediate resistance at 151.97, which is noted as a swing high resistance.

USD/CAD:
The USD/CAD, the overall momentum of the chart is bullish, indicating an upward trend. There’s a potential scenario where the price could bounce bullishly off the 1st support level and head towards the 1st resistance.
The 1st support at 1.3575 is identified as a swing low support and is particularly significant as it aligns with the 100% Fibonacci Projection. This suggests a strong support level where buying interest may emerge and drive the currency pair higher.
On the resistance side, the 1st resistance at 1.3864 is categorized as a multi-swing high resistance. This level could act as a significant barrier to further upward price movement, as it has historically attracted selling pressure.
Additionally, the 2nd resistance at 1.3976 is marked as a swing high resistance, further reinforcing its potential to hinder the currency pair’s upward progress.

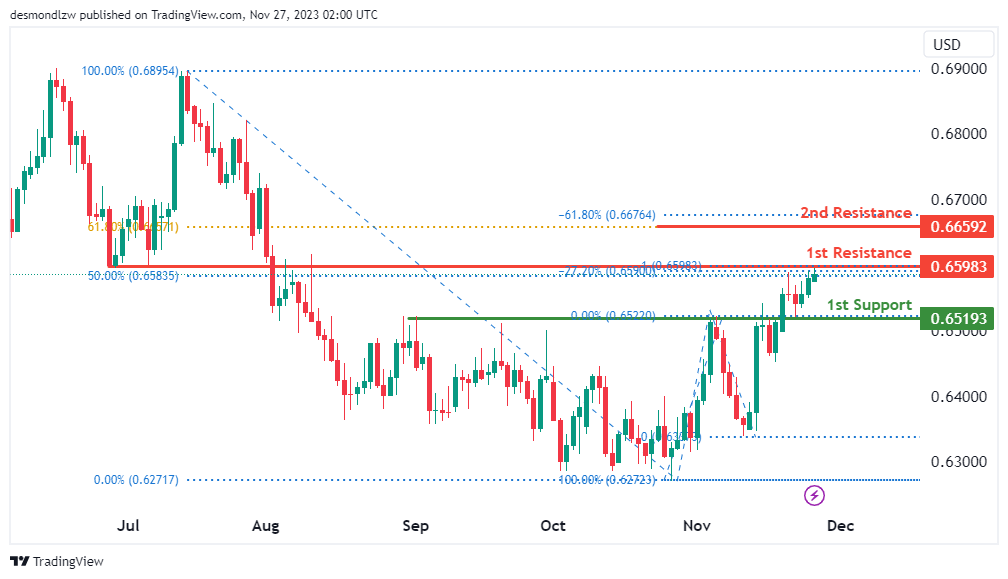
AUD/USD:
The AUD/USD, the overall momentum of the chart is bearish, indicating a downward trend. There’s a potential scenario where the price could react bearishly at the 1st resistance level and move lower towards the 1st support.
The 1st support at 0.6519 is identified as an overlap support, suggesting that it’s a level where buying interest may emerge and provide support for the currency pair.
On the resistance side, the 1st resistance at 0.6598 is also categorized as an overlap resistance. This level is significant because it coincides with the 50% Fibonacci Retracement and the -27% Fibonacci Expansion, indicating Fibonacci confluence. Such confluence levels often act as strong resistance points, where selling pressure may intensify.
Additionally, the 2nd resistance at 0.6659 is marked by the 61.80% Fibonacci Retracement and the -61.8% Fibonacci Retracement, further reinforcing its potential as a strong resistance level.
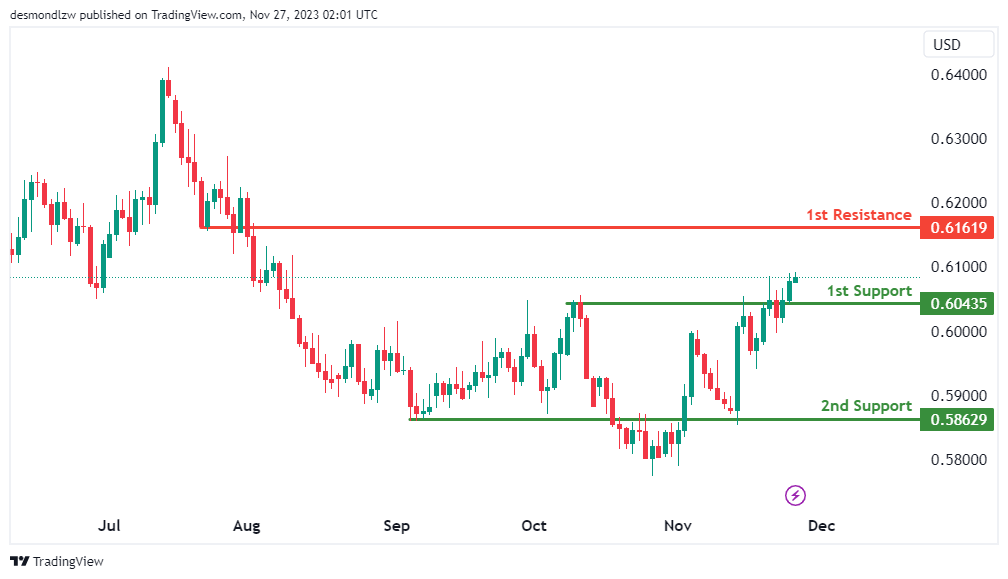
NZD/USD
The NZD/USD, the overall momentum of the chart is bullish, suggesting an upward trend. There’s a potential scenario where the price could continue in a bullish direction towards the 1st resistance.
The 1st support at 0.6043 is identified as a pullback support level. This level is significant because it represents a point where buyers might be inclined to step in and provide support for the currency pair, potentially leading to a bounce in prices.
Furthermore, the 2nd support at 0.5862 is considered an overlap support level. This suggests that it’s another area where buying interest may emerge, reinforcing the potential for support.
On the resistance side, the 1st resistance at 0.6161 is categorized as a pullback resistance. This level is likely to be associated with increased selling pressure, potentially acting as a barrier to further price advances.

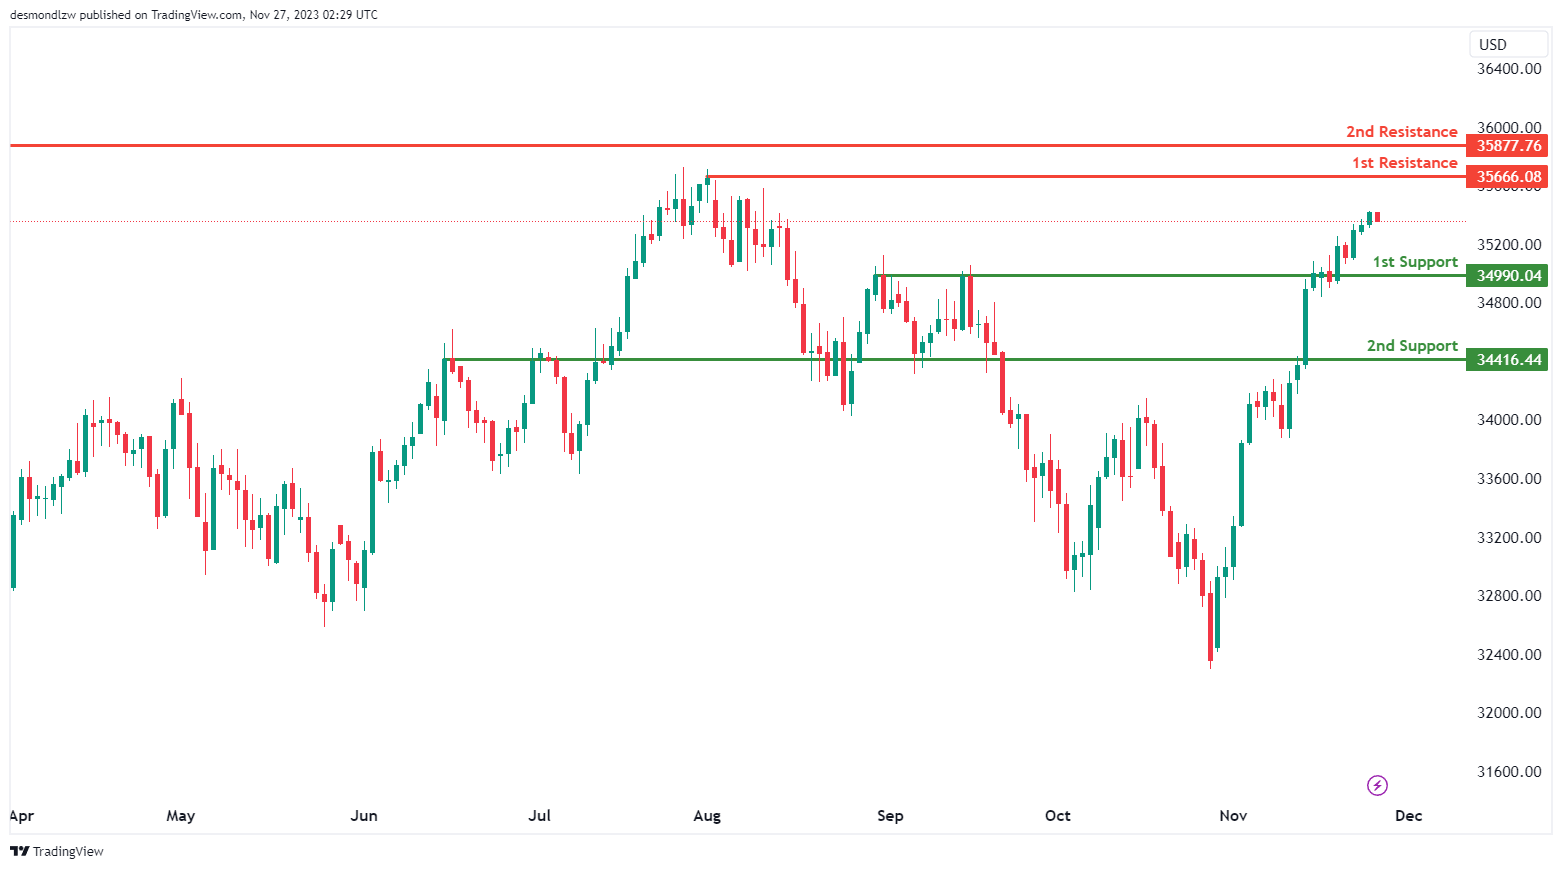
DJ30:
The DJ30, the overall momentum of the chart is bullish, indicating a positive sentiment in the market. The price could potentially continue its bullish movement towards the 1st resistance.
The 1st support at 34990.04 is identified as a multi-swing low support, implying that it’s a level where buyers have previously stepped in, making it a potentially strong support area.
The 2nd support at 34416.44 is categorized as an overlap support, suggesting that it aligns with previous price levels where buying interest emerged. This adds to its significance as a potential support level.
The 1st resistance at 35666.08 is considered a pullback resistance, signifying that it’s a level where selling pressure may increase, possibly acting as a barrier to further upward price movement.
The 2nd resistance at 35877.76 is noted as a swing high resistance, indicating that it’s a point where selling interest has historically been concentrated, potentially limiting price advances.
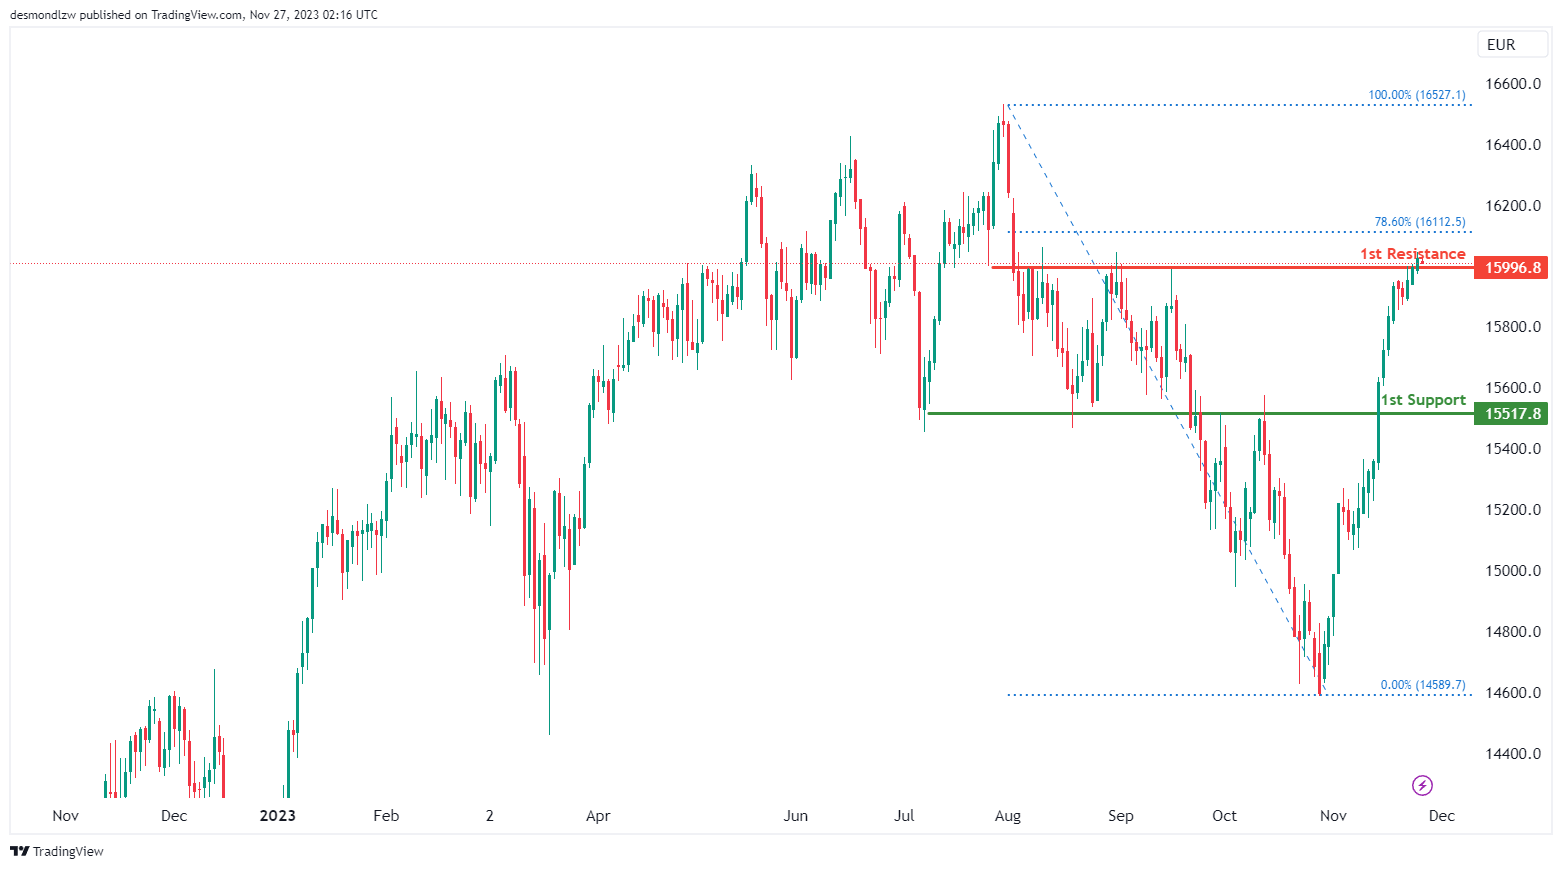
GER40:
The analyzed instrument is GER40,the overall momentum of the chart is currently bullish, suggesting a tendency for upward price movement. However, there’s a potential short-term scenario where price could drop further to the 1st support before bouncing and heading towards the 1st resistance.
The 1st support at 15517.8 is categorized as pullback support, indicating it’s a level where buyers might come in to support the price in the short term.
Regarding the 2nd support and 2nd resistance, specific levels and reasons for their significance are not provided in the given information.
The 1st resistance at 15996.8 is noted as an overlap resistance, suggesting that it’s a level where selling interest may be concentrated and could act as a barrier to further upward movement.
The 2nd resistance at 16112.5 is associated with the 78.60% Fibonacci Retracement, adding significance to this resistance level.
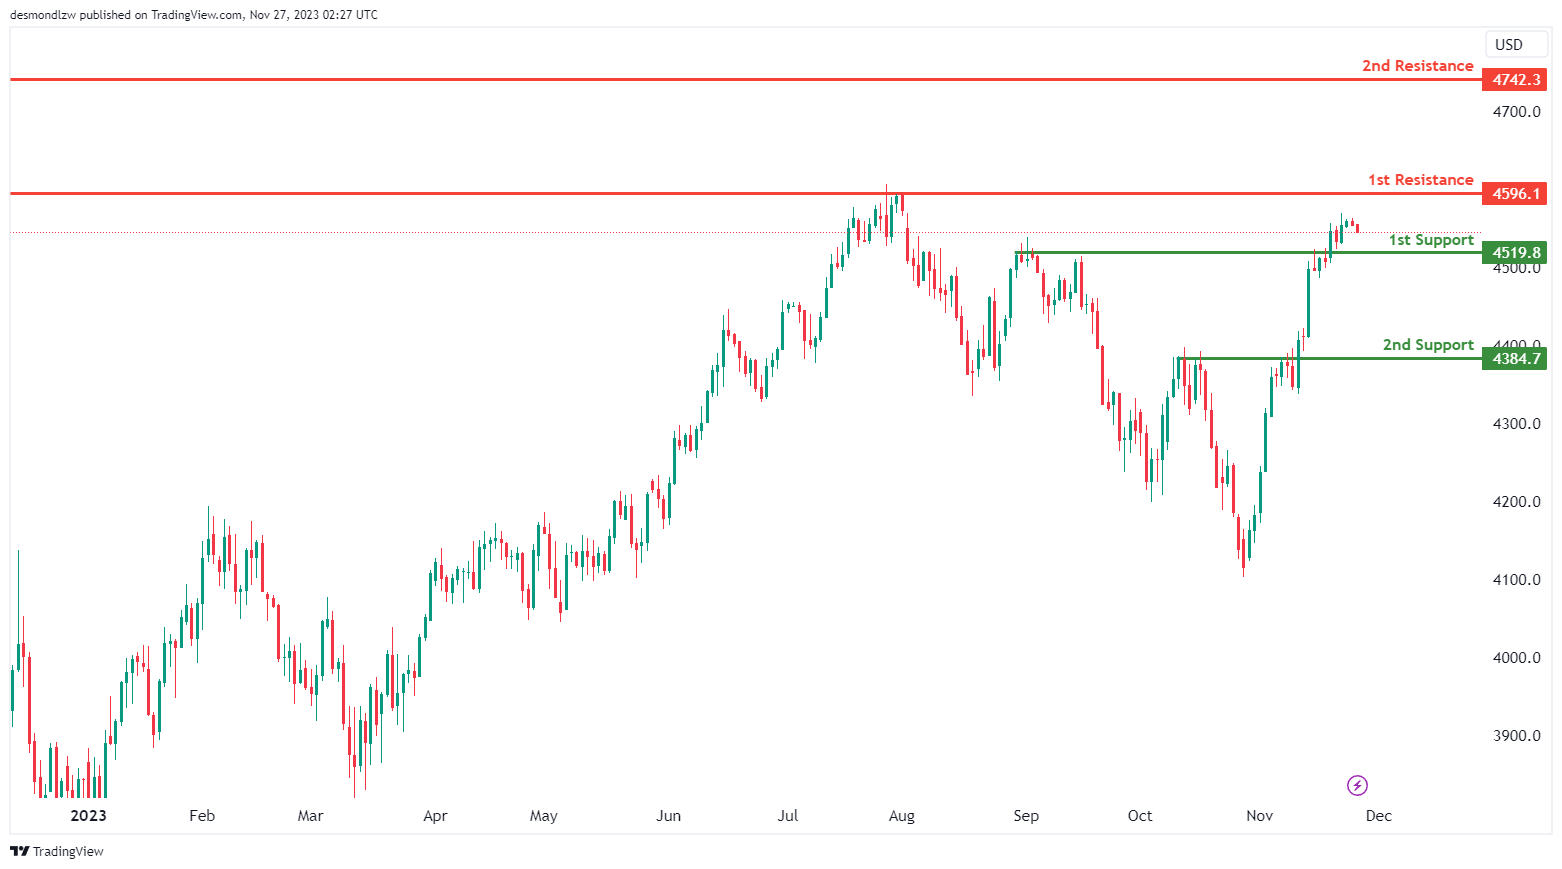
`US500:
The analyzed instrument is US500, the overall momentum of the chart is weak bearish with low confidence, suggesting a potential for downward price movement. Price could potentially continue bearish towards the 1st support and there are also indications of potential levels of support and resistance.
The 1st support at 4519.8 is considered a swing low support, indicating that it’s a level where buyers might step in to provide support.
The 2nd support at 4384.7 is categorized as a multi-swing low support, suggesting that it’s another level where buyers could become active and provide support for the price.
The 2nd resistance at 4742.3 is categorized as a pullback resistance, suggesting that it’s a point where selling pressure could intensify and limit price advances.
BTC/USD:
The analyzed instrument is BTC/USD, and the overall momentum of the chart is currently bearish.
There is a potential for the price to make a bearish continuation towards the 1st support.
The 1st support level is identified at 35624, and its favorable characteristic is attributed to being an overlap support, coinciding with the 23.60% Fibonacci Retracement.
The 2nd support level is situated at 31539, and its favorable aspect is derived from being a pullback support, aligning with the 50% Fibonacci Retracement.
On the resistance side, the 1st resistance is positioned at 37922, and it is considered significant due to being a multi-swing high resistance, coinciding with the 78.60% Fibonacci Projection.
The 2nd resistance is located at 40283, and its significance is derived from the 61.80% Fibonacci Projection.

ETH/USD:
The analyzed instrument is ETH/USD, and the overall momentum of the chart is currently bearish.
There is a potential for the price to make a bearish continuation towards the 1st support.
The 1st support level is identified at 1941.19, and its favorable characteristic is attributed to being an overlap support.
On the resistance side, the 1st resistance is positioned at 2149.81, and it is considered significant due to being an overlap resistance.
The 2nd resistance is located at 2229.47, and its significance is derived from coinciding with the 50% Fibonacci Retracement.

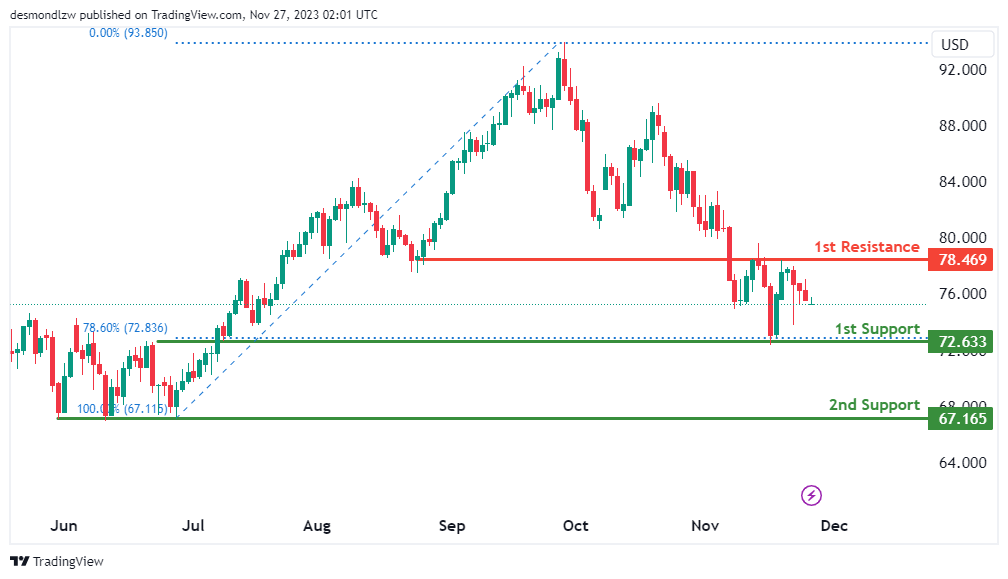
WTI/USD:
The WTI (West Texas Intermediate), the overall momentum of the chart is bearish, indicating a downward trend. There’s a potential scenario where the price could continue in a bearish direction towards the 1st support level.
The 1st support at 72.63 is considered a strong support level, marked by an overlap and reinforced by the 78.60% Fibonacci retracement. This level suggests a significant area where buying interest may emerge, potentially providing support to the commodity price.
Additionally, the 2nd support at 67.16 is another notable level, characterized as a multi-swing low support. It represents a historical level where buyers have previously stepped in, further reinforcing its significance.
On the resistance side, the 1st resistance at 78.46 is identified as an overlap resistance. This level may act as a barrier to upward price movements, potentially offering resistance to any bullish attempts.
XAU/USD (GOLD):
The XAU/USD (Gold), the overall momentum of the chart is bearish, suggesting a downward trend. There’s a potential scenario where the price could experience a bearish break off the 1st support and drop towards the 2nd support.
The 1st support at 1942.40 is considered an overlap support level, indicating that it’s an area where buying interest may emerge and provide support for the currency pair.
However, it’s essential to wait for upside confirmation, particularly at the level of 2008.46, which is an overlap resistance. This level may act as a barrier to further upward movement, and a break above it would be a signal of potential bullish momentum.
On the resistance side, the 1st resistance at 2049.99 is significant as it is associated with multi-swing high resistance. This level could serve as a potential barrier to upward price movement.

The accuracy, completeness and timeliness of the information contained on this site cannot be guaranteed. IC Markets does not warranty, guarantee or make any representations, or assume any liability regarding financial results based on the use of the information in the site.
News, views, opinions, recommendations and other information obtained from sources outside of www.icmarkets.com, used in this site are believed to be reliable, but we cannot guarantee their accuracy or completeness. All such information is subject to change at any time without notice. IC Markets assumes no responsibility for the content of any linked site.
The fact that such links may exist does not indicate approval or endorsement of any material contained on any linked site. IC Markets is not liable for any harm caused by the transmission, through accessing the services or information on this site, of a computer virus, or other computer code or programming device that might be used to access, delete, damage, disable, disrupt or otherwise impede in any manner, the operation of the site or of any user’s software, hardware, data or property.