Traders have been eagerly awaiting the release of the Federal Reserve’s favoured inflation indicator this week and it should pack a powerful punch later today with some of the major currencies sitting at good levels from a technical perspective. The major focus this week has been on the Yen and no doubt that is probably where we will see the most volatility later on today, it has already jumped to fresh historic lows this morning, but the threat of intervention means that this data print will be unlikely to allow for a smooth trend break into long-term positions.
In light of the above and also the likelihood of more geopolitical machinations in Europe on the weekend, we are looking closely at the Aussie for a potential longer-term trade off the back of any significant deviation in the PCE result. Australian CPI data once again printed higher this week leading to an appreciation for the Aussie against most currencies, however it remains rangebound against the greenback with both central banks remained relatively hawkish. If this dynamic changes later today with a lower print than the expected 0.1% month-on-month increase, and recent other data releases have been pointing to that, then expect the Aussie to break into a fresh topside range. An on-target result or slightly higher print is likely to lead to more rangebound conditions as both central banks look for softer inflation conditions before committing to the long-awaited easing cycle.
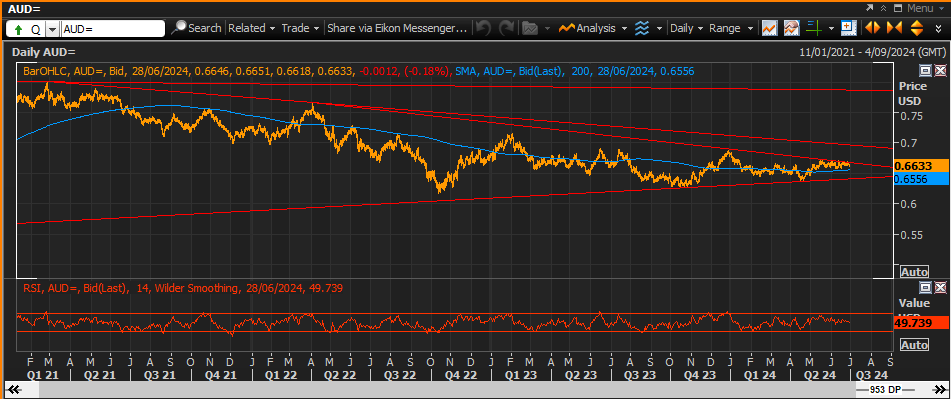
The Aussie is sitting within recent ranges on the Daily chart and as indicated above, the potential for a topside break is high if we get a worse then expected PCE print, short-term resistance is sitting on trendline resistance and Wednesday’s high around 0.6688 with the May high, just 26 pips higher at 0.6714 and a clean break through these levels should attract more long-term players. A stronger print, however, should push the pair back into the range with initial support on the 200-day moving average at 0.6556.
Resistance 2: 0.6714 – May High
Resistance 1: 0.6688 – Trendline Resistance and Weekly High
Support 1: 0.6556 – 200-Day Moving Average
Support 2: 0.6401 – Long-term Trendline Support