
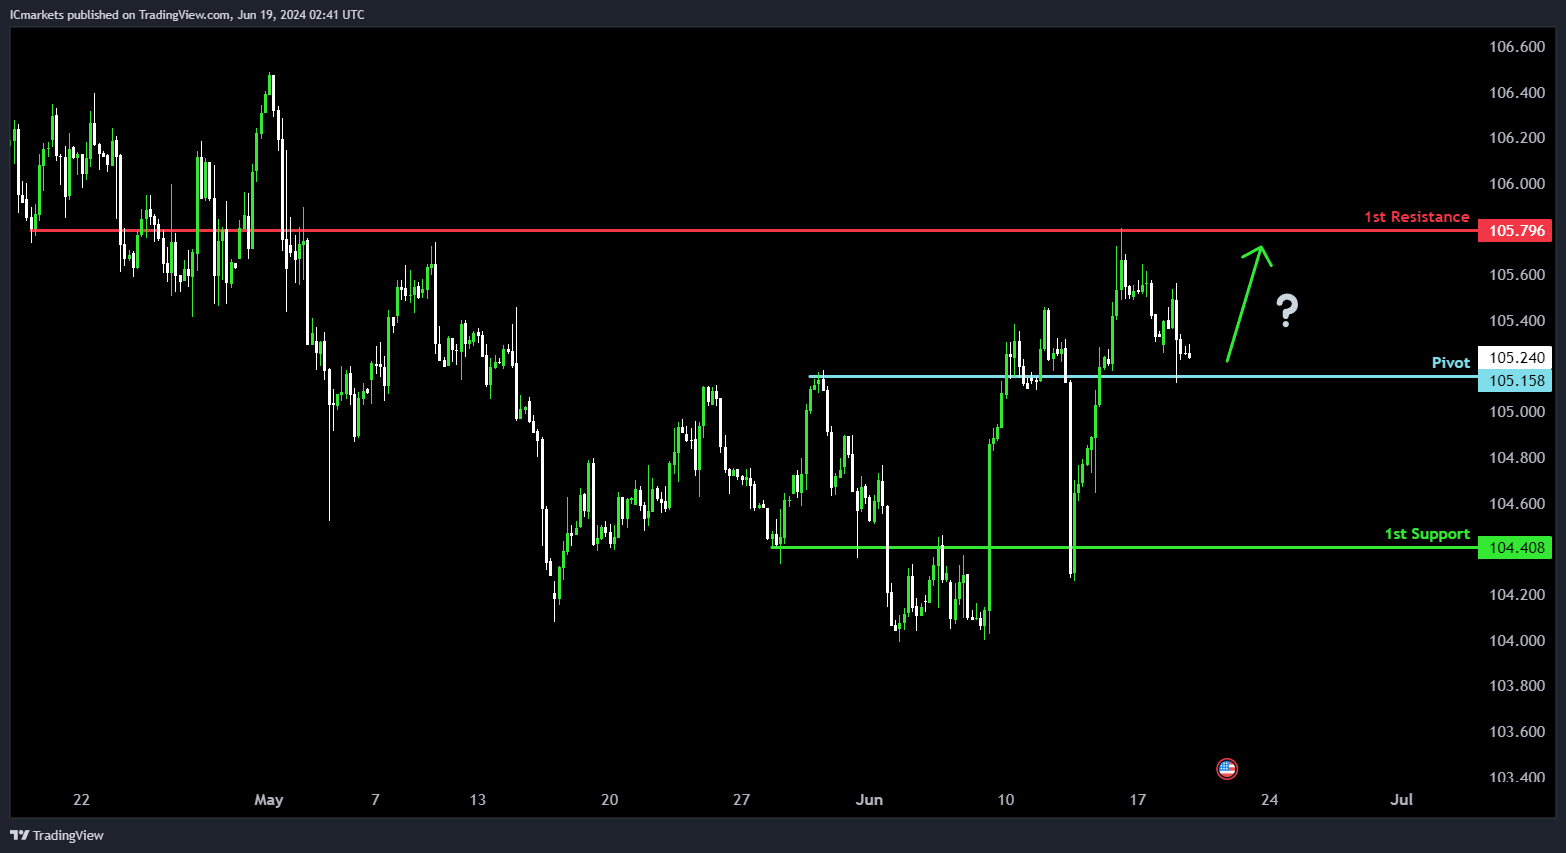
DXY (US Dollar Index):
Potential Direction: Bullish
Overall momentum of the chart: Bullish
Price could potentially make a bullish bounce off pivot and head towards 1st resistance.
Pivot: 105.15
Supporting reasons: Identified as an overlap support level, suggesting a historical area where buying interest could emerge.
1st support: 104.40
Supporting reasons: Identified as an overlap support level, indicating a significant historical area where buying interest has previously been strong.
1st resistance: 105.79
Supporting reasons: Identified as an overlap resistance level, marking a critical area where selling pressure may intensify and potentially halt further upward movement.
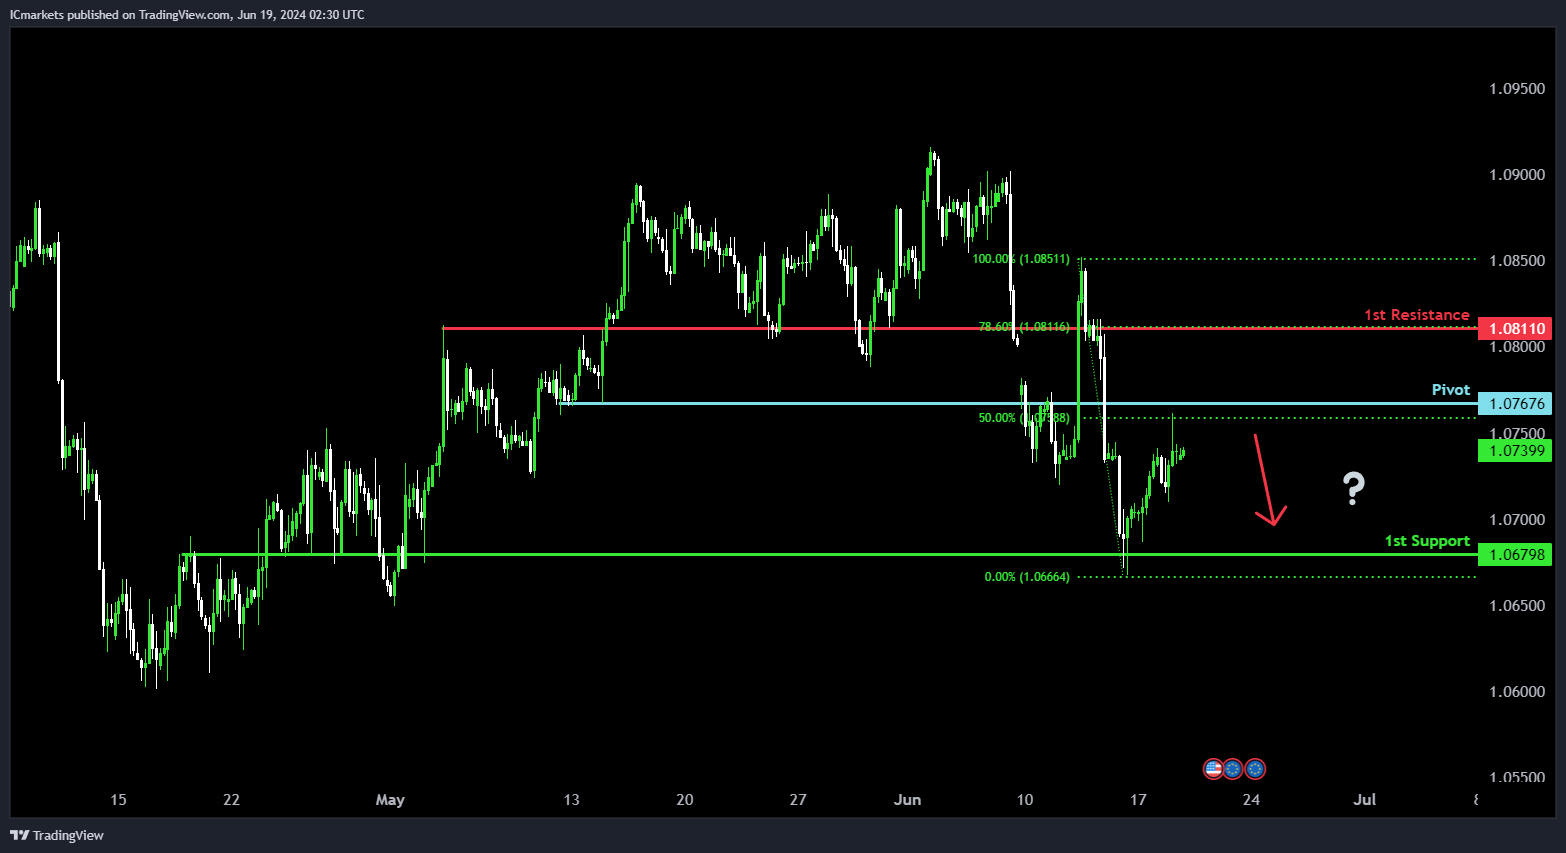
EUR/USD:
Potential Direction: Bearish
Overall momentum of the chart: Bearish
Price could potentially make a bearish continuation towards 1st support.
Pivot: 1.0767
Supporting reasons: Identified as an overlap resistance level and coinciding with the 50% Fibonacci Retracement, indicating a significant historical and technical resistance area.
1st support: 1.0679
Supporting reasons: Identified as an overlap support level, suggesting a historical area where buying interest has previously emerged.
1st resistance: 1.0811
Supporting reasons: Identified as a pullback resistance level and coinciding with the 78.60% Fibonacci Retracement, marking a critical area where selling pressure may intensify and potentially halt further upward movement.
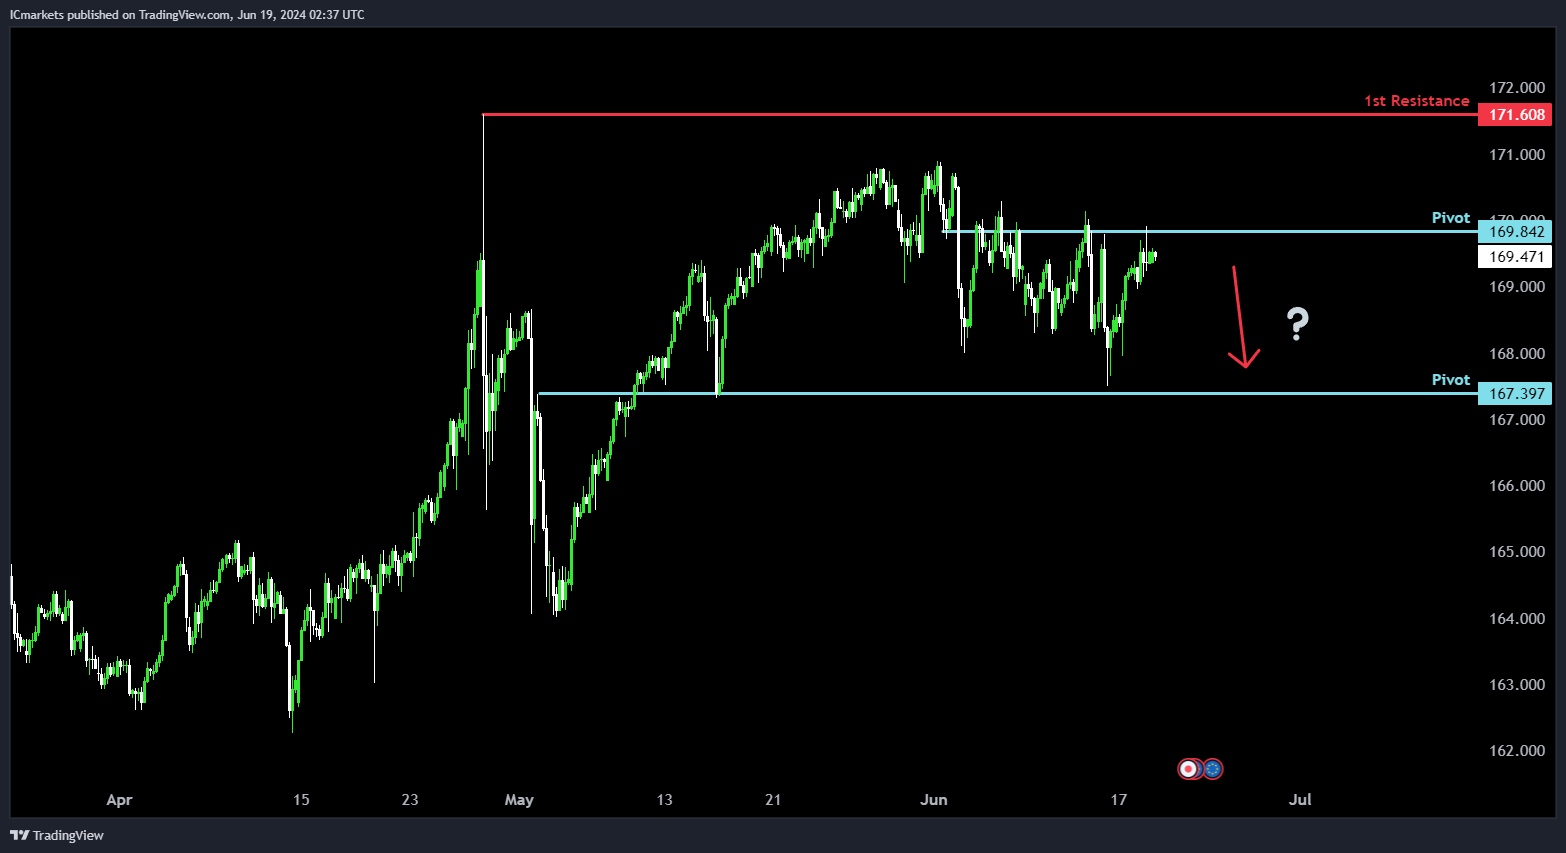
EUR/JPY:
Potential Direction: Bearish
Overall momentum of the chart: Bullish
Price could potentially make a bearish continuation towards 1st support.
Pivot: 169.84
Supporting reasons: Identified as an overlap resistance level, suggesting a historical barrier where selling pressure may increase.
1st support: 167.39
Supporting reasons: Identified as an overlap support level, indicating a historical area where buying interest has previously emerged.
1st resistance: 171.60
Supporting reasons: Identified as a swing high resistance level, marking a significant barrier that could cap further upward movements.
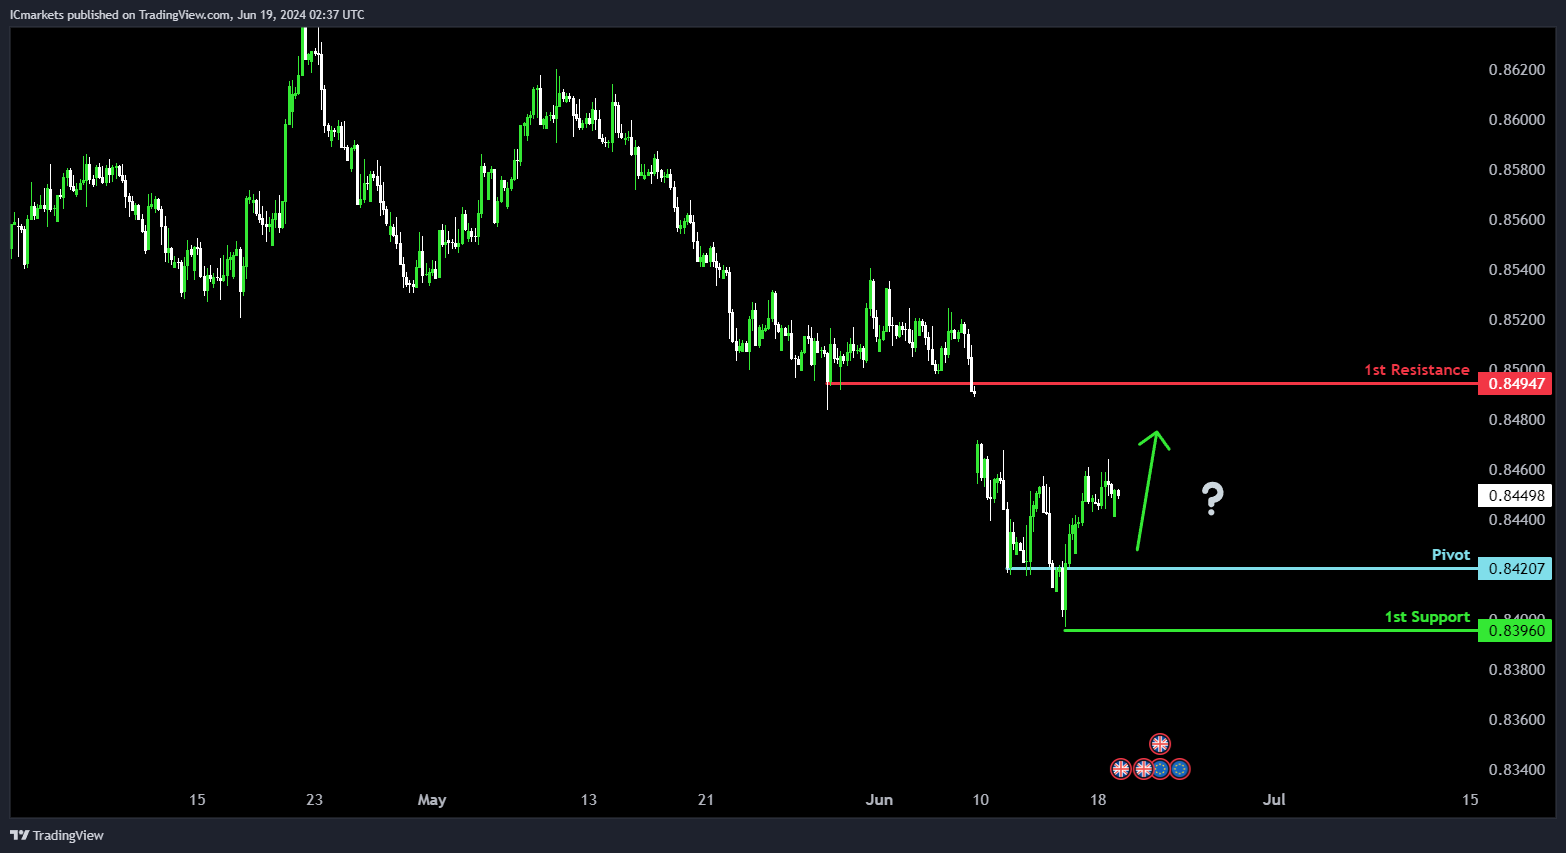
EUR/GBP:
Potential Direction: Bullish
Overall momentum of the chart: Bearish
Price could potentially make a bullish bounce off pivot and heads towards 1st resistance.
Pivot: 0.8420
Supporting reasons: Identified as pullback support, indicating a level where buying interest could potentially pick up to support a bounce.
1st support: 0.8396
Supporting reasons: Identified as swing low support, suggesting a historical level where buying interest has previously emerged.
1st resistance: 0.84954
Supporting reasons: Identified as pullback resistance, suggesting a critical area where selling pressure may intensify and potentially halt further upward movement.
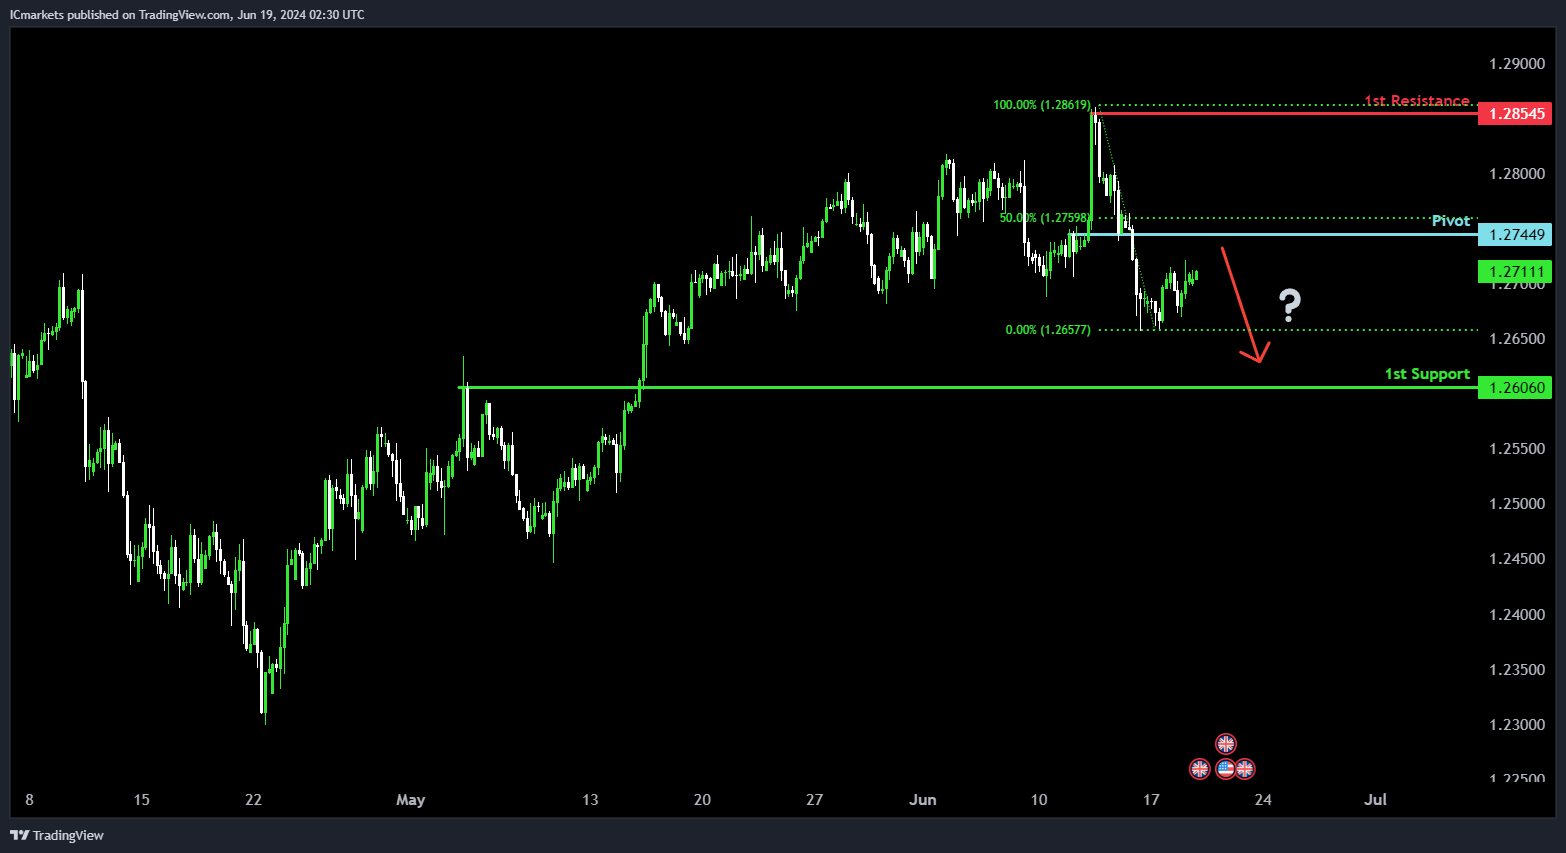
GBP/USD:
Potential Direction: Bearish
Overall momentum of the chart: Bearish
Price could potentially make a bearish reaction off pivot and drop to 1st support.
Pivot: 1.2744
Supporting reasons: Identified as pullback support, coinciding with a 50% Fibonacci Retracement level, indicating a significant historical and technical support area.
1st support: 1.2606
Supporting reasons: Identified as pullback support, suggesting a strong historical level where buying interest has previously emerged.
1st resistance: 1.2854
Supporting reasons: Identified as swing high resistance, marking a critical area where selling pressure may intensify and potentially halt further upward movement.
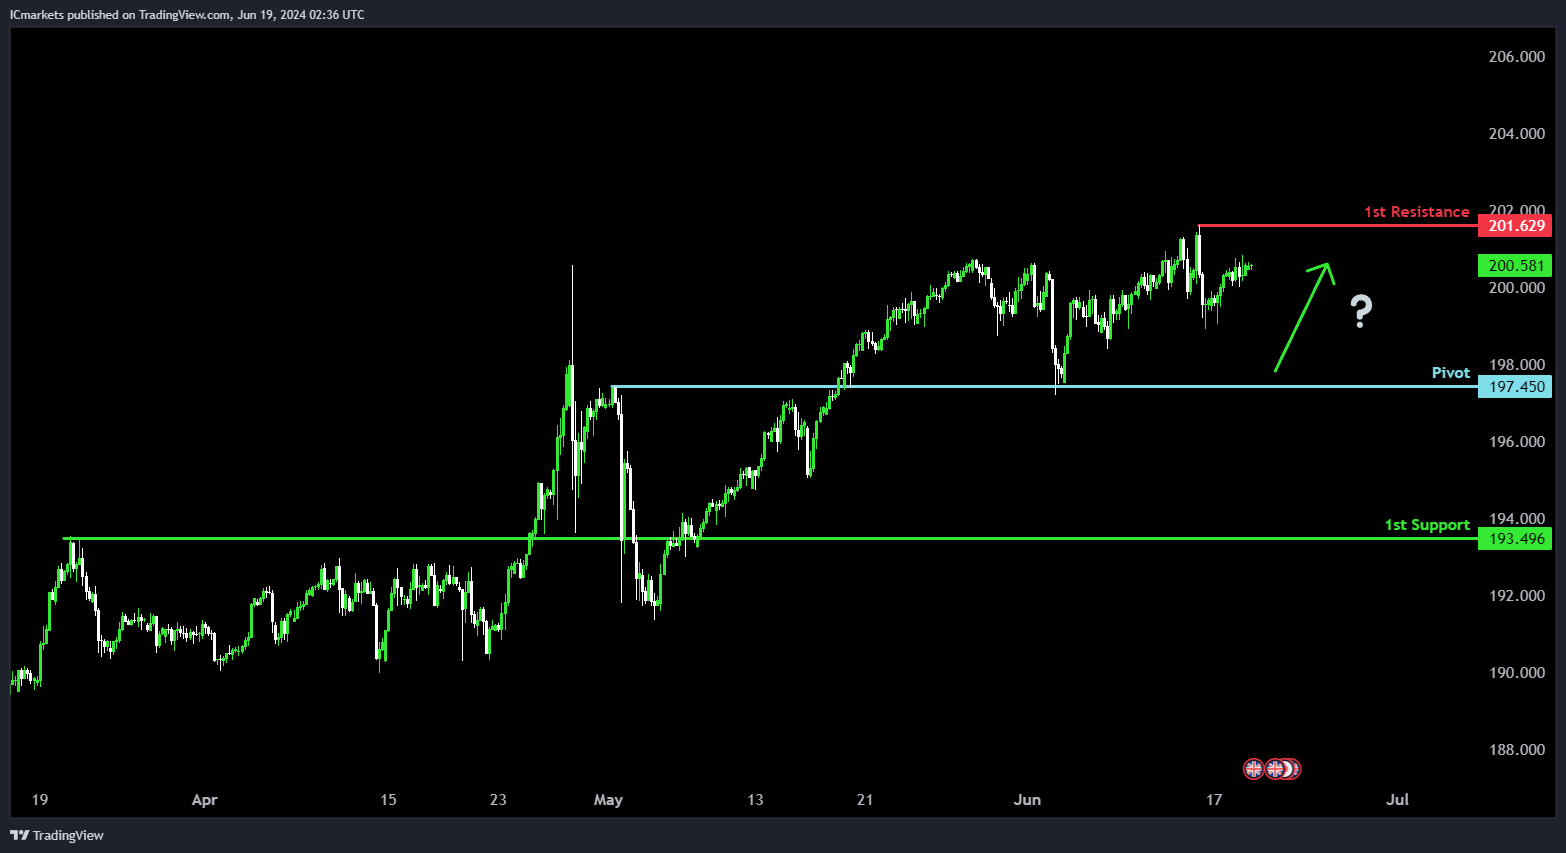
GBP/JPY:
Potential Direction: Bullish
Overall momentum of the chart: Bullish
Price could potentially make a bullish bounce off pivot and heads towards 1st resistance.
Pivot: 197.45
Supporting reasons: Identified as an overlap support level, suggesting a strong historical and technical support area.
1st support: 193.49
Supporting reasons: Identified as an overlap support level, indicating another significant historical level where buying interest has previously emerged.
1st resistance: 201.35
Supporting reasons: Identified as a swing high resistance level, marking a critical area where selling pressure may intensify and potentially halt further upward movement.
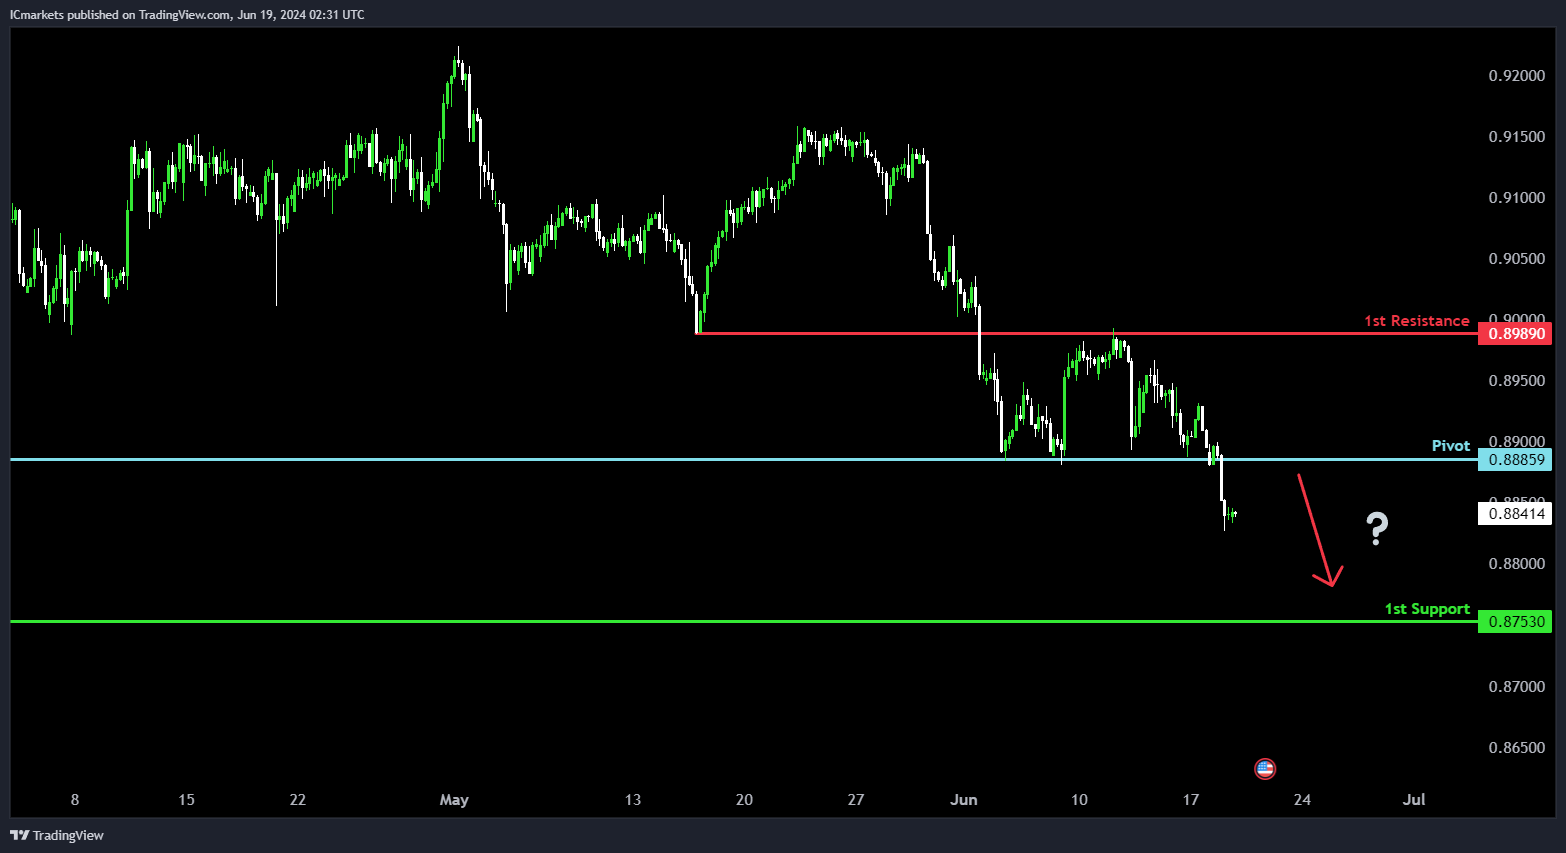
USD/CHF:
Potential Direction: Bearish
Overall momentum of the chart: Bearish
Price could potentially make a bearish reaction off pivot and drop to 1st support.
Pivot: 0.8885
Supporting reasons: Identified as a pullback resistance level, indicating a historical barrier where selling pressure may intensify.
1st support: 0.8753
Supporting reasons: Identified as an overlap support level, suggesting a historical area where buying interest has previously emerged.
1st resistance: 0.8989
Supporting reasons: Identified as an overlap resistance level, marking a significant barrier that could cap further upward movements.
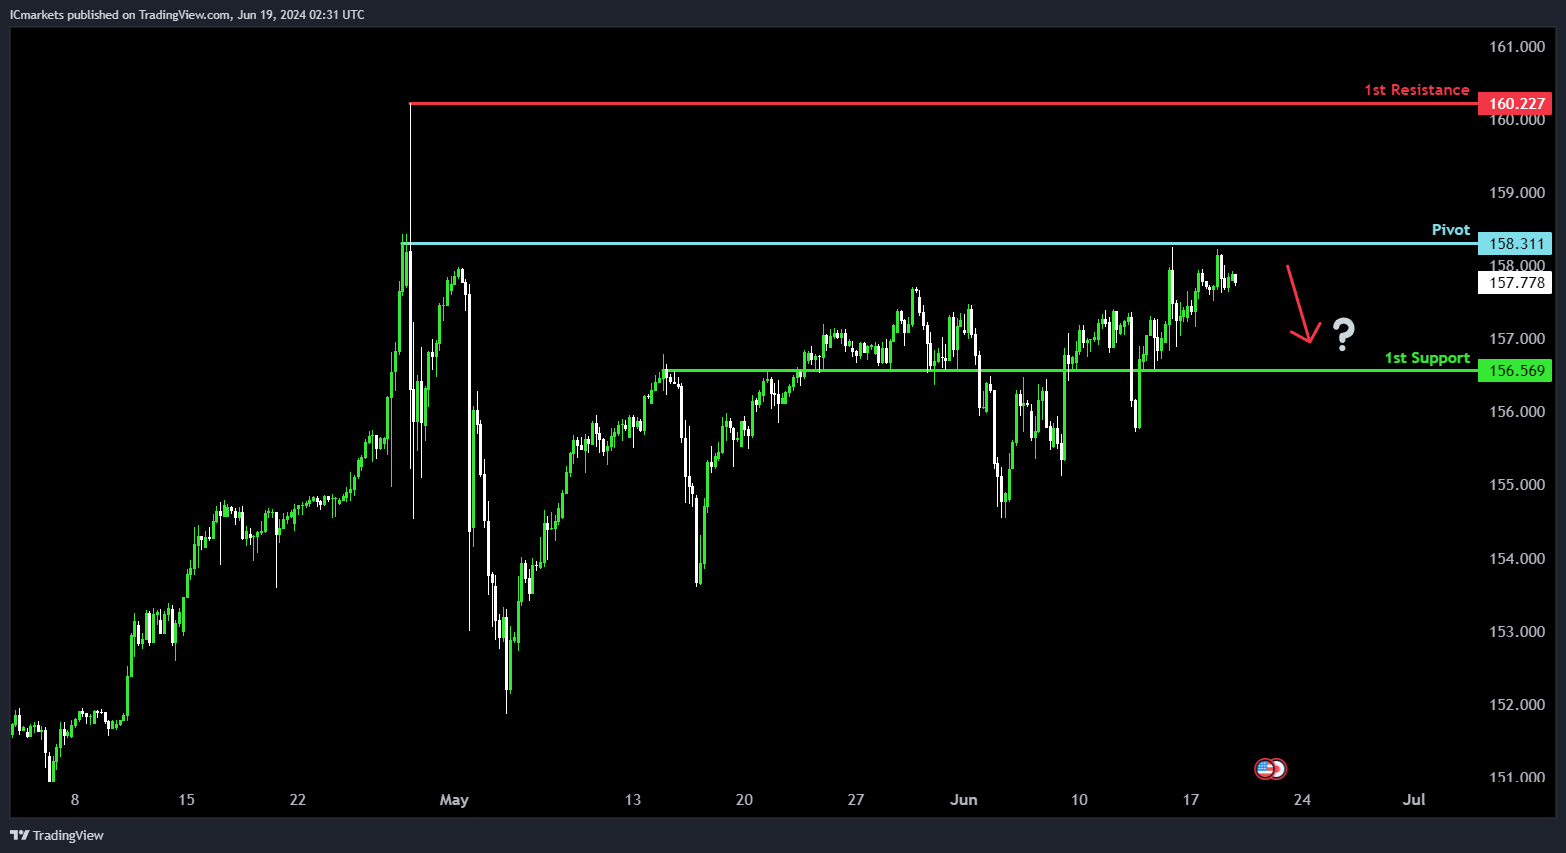
USD/JPY:
Potential Direction: Bearish
Overall momentum of the chart: Bullish
Price could potentially make a bearish continuation towards 1st support.
Pivot: 158.31
Supporting reasons: Identified as a multi-swing high resistance level, indicating a historical barrier where selling pressure has previously intensified.
1st support: 156.56
Supporting reasons: Identified as an overlap support level, suggesting a historical area where buying interest has previously emerged.
1st resistance: 160.22
Supporting reasons: Identified as a swing high resistance level, marking a significant barrier that could cap further upward movements.
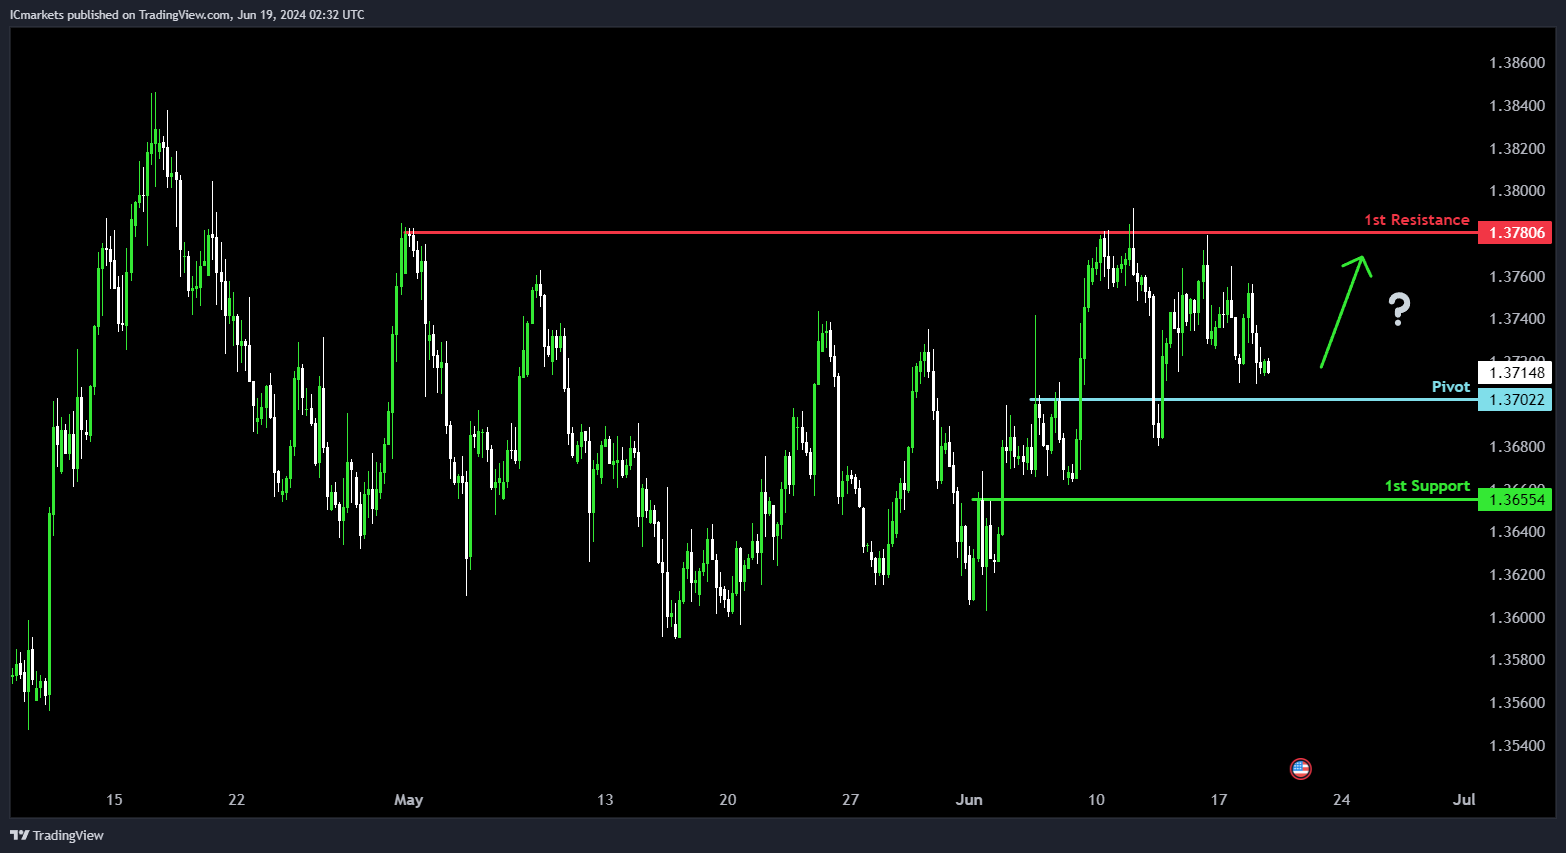
USD/CAD:
Potential Direction: Bullish
Overall momentum of the chart: Bullish
Price could potentially make a bullish bounce off pivot and head towards 1st resistance.
Pivot: 1.3702
Supporting reasons: Identified as a pullback support level, suggesting a area where buying interest could emerge.
1st support: 1.3655
Supporting reasons: Identified as another pullback support level, reinforcing the potential for buying interest at this price point.
1st resistance: 1.3780
Supporting reasons: Identified as a multi-swing high resistance level, indicating a historical barrier where selling pressure has previously intensified.
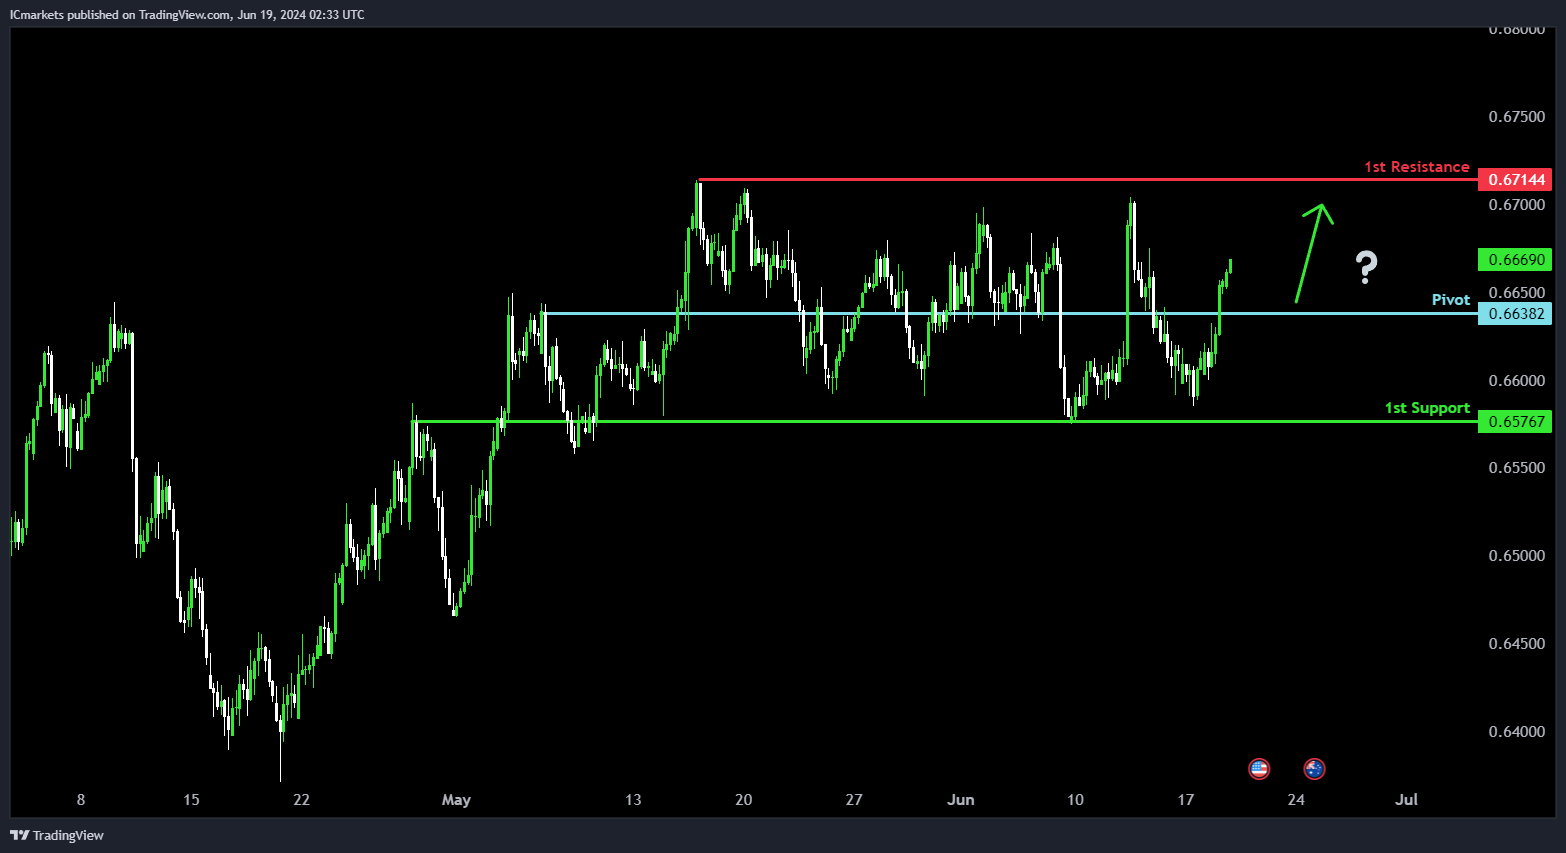
AUD/USD:
Potential Direction: Bullish
Overall momentum of the chart: Bullish
Price could potentially make a bullish bounce off pivot and head towards 1st resistance.
Pivot: 0.6638
Supporting reasons: Identified as a pullback support level, indicating a point where buying interest may emerge.
1st support: 0.6576
Supporting reasons: Identified as an overlap support level, reinforcing its significance as a historical support area.
1st resistance: 0.6714
Supporting reasons: Identified as a swing high resistance level, suggesting a historical barrier where selling pressure may intensify.
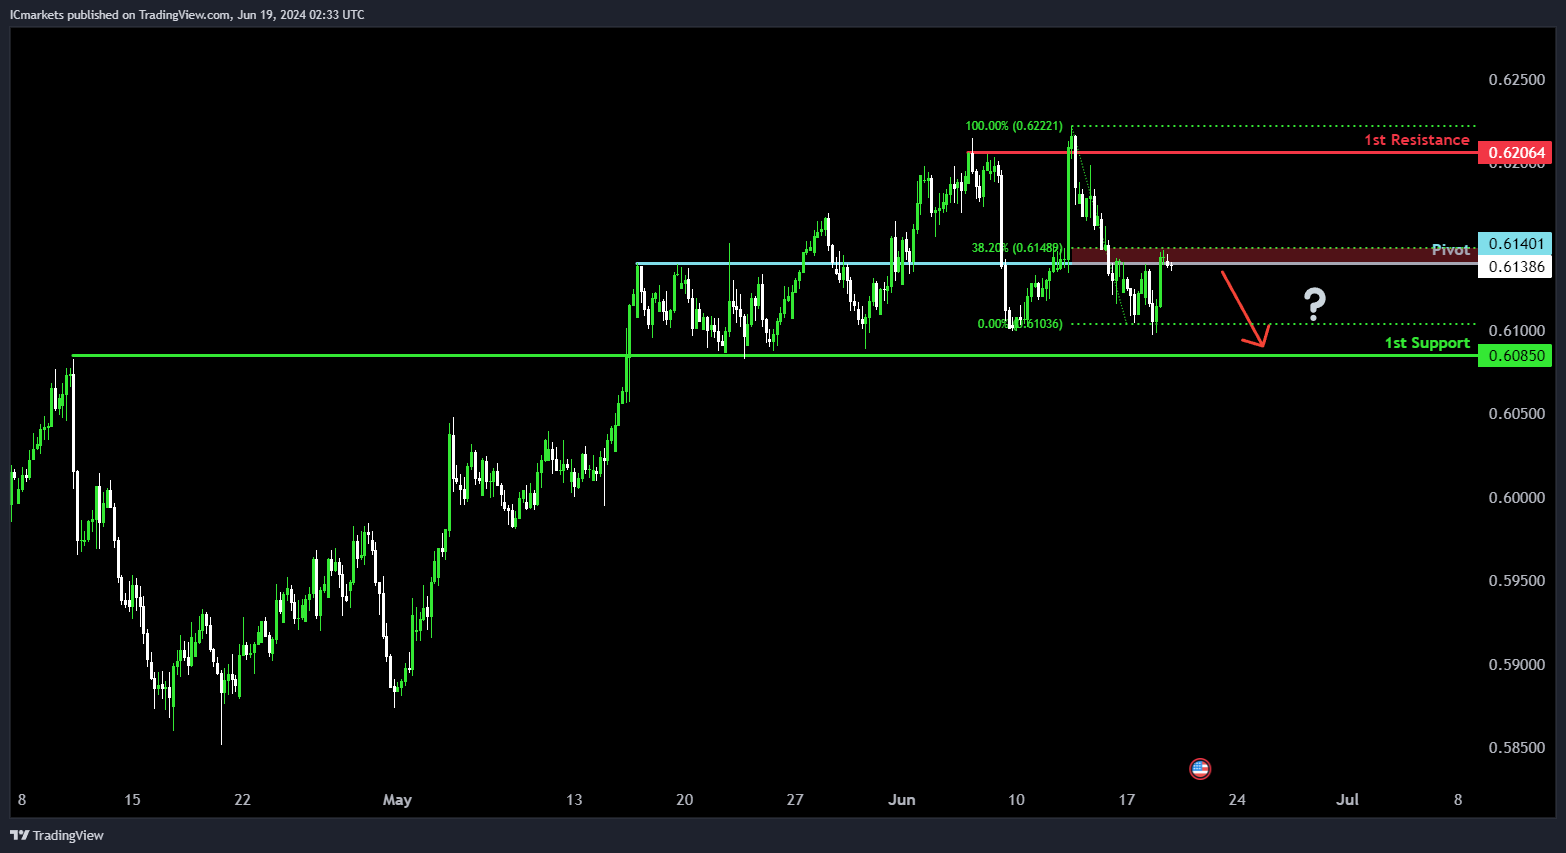
NZD/USD
Potential Direction: Bearish
Overall momentum of the chart: Bearish
Price could potentially make a bearish reaction off pivot and drop to 1st support.
Pivot: 0.6140
Supporting reasons: Identified as a pullback resistance level, coinciding with the 38.20% Fibonacci Retracement, suggesting a potential area where selling pressure might increase.
1st support: 0.6085
Supporting reasons: Identified as an overlap support level, indicating historical significance as a support area where buying interest has previously emerged.
1st resistance: 0.6206
Supporting reasons: Identified as a multi-swing high resistance level, suggesting a historical barrier where selling pressure has been strong.
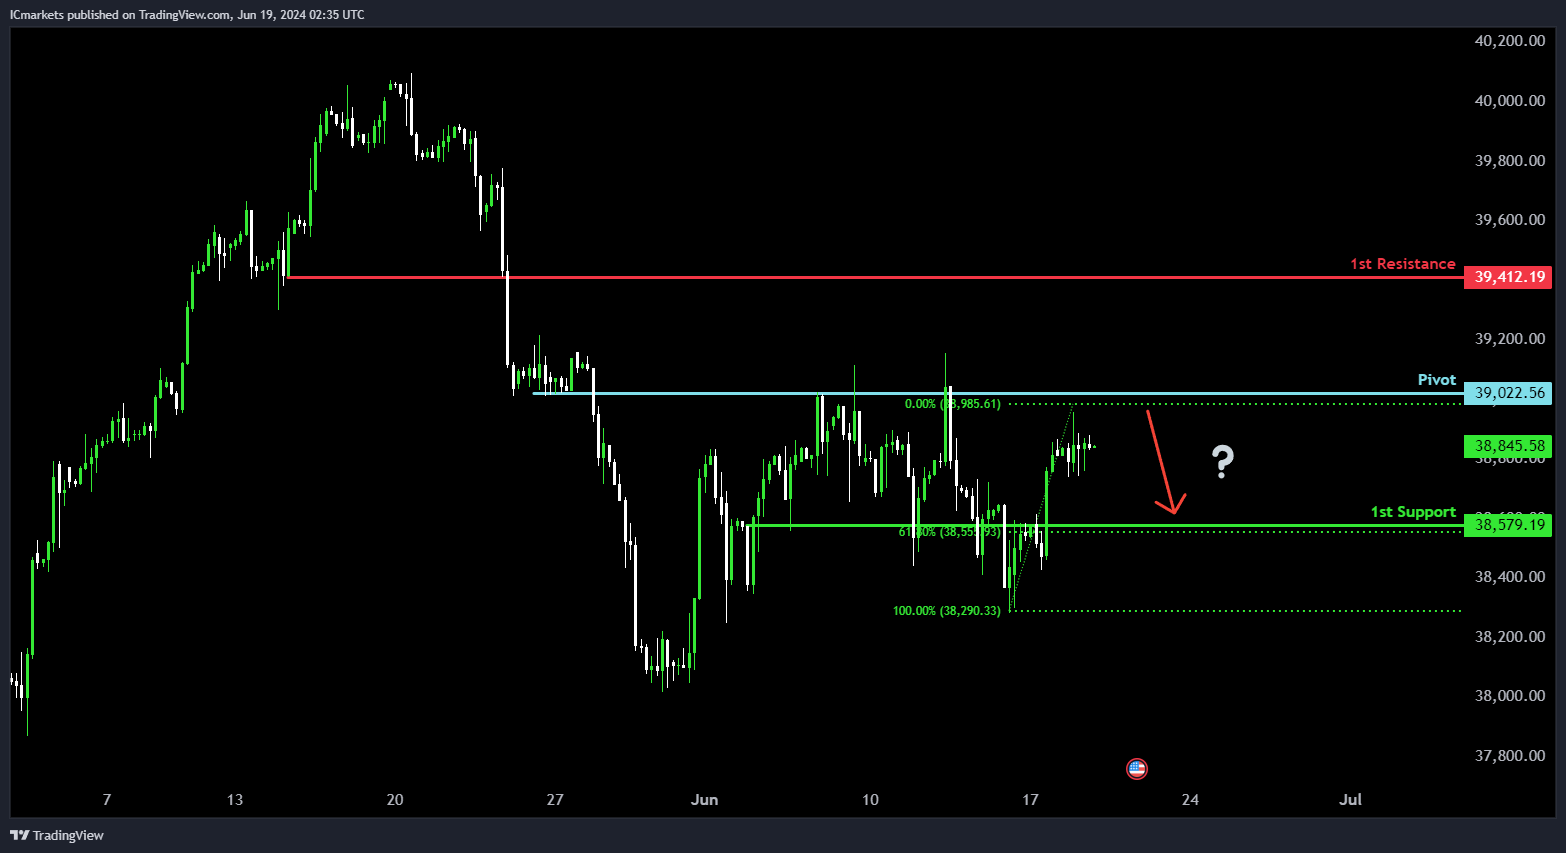
US30 (DJIA):
Potential Direction: Bearish
Overall momentum of the chart: Bullish
Price could potentially make a bearish reaction off pivot and drop to 1st support.
Pivot: 39022.56
Supporting reasons: Identified as an overlap resistance level, indicating historical significance as a barrier where selling pressure has been observed.
1st support: 38579.19
Supporting reasons: Identified as a pullback support level, coinciding with the 61.80% Fibonacci Retracement, suggesting a potential area where buying interest might emerge to support the price.
1st resistance: 39412.19
Supporting reasons: Identified as a pullback resistance level, indicating a historical barrier where selling pressure may intensify and potentially halt further upward movement.
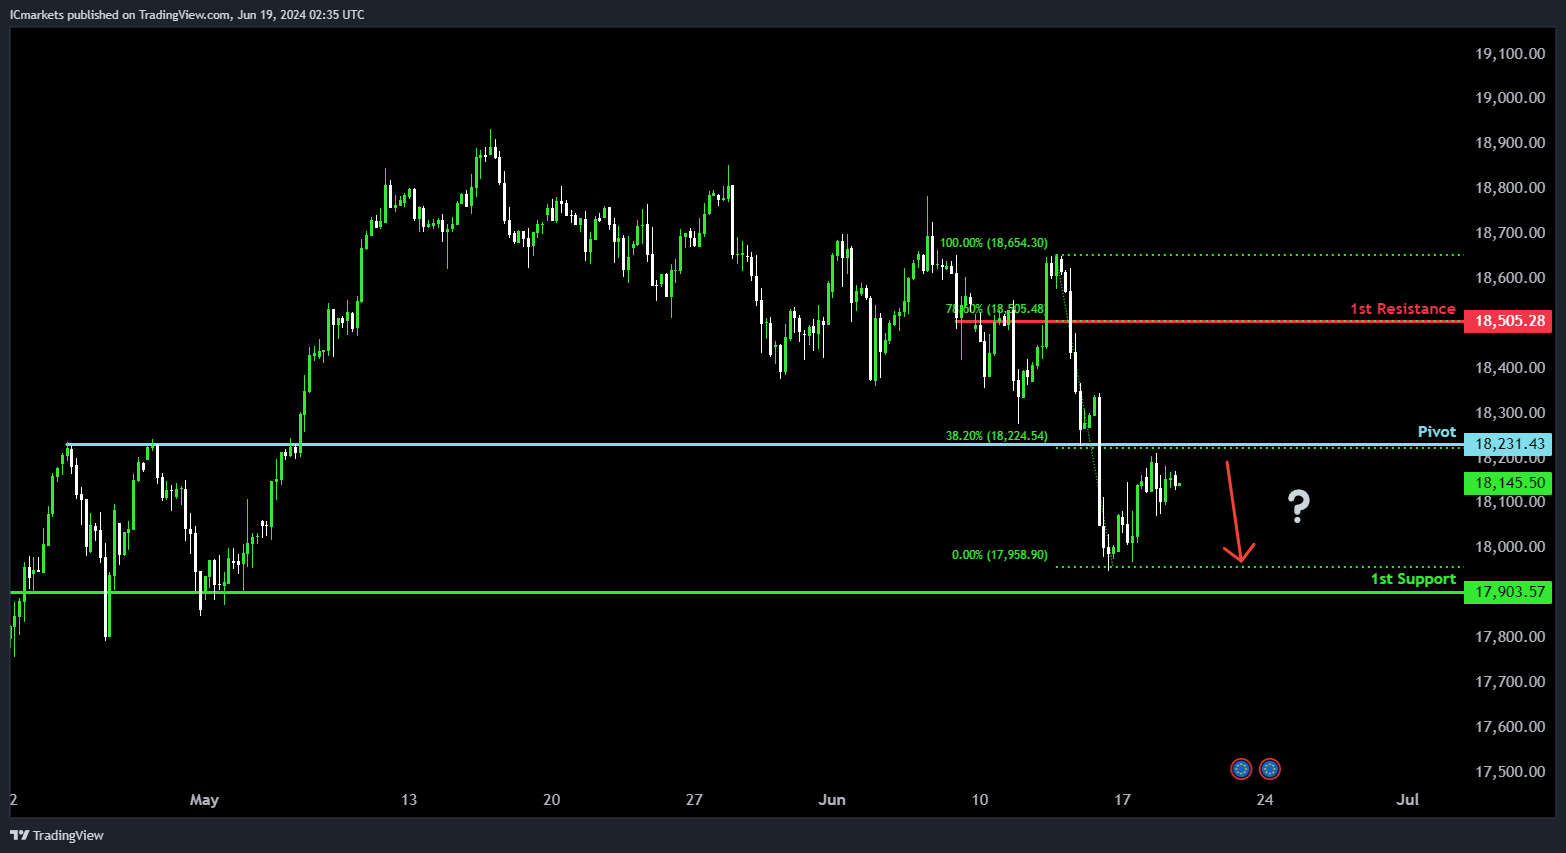
DE40 (DAX):
Potential Direction: Bearish
Overall momentum of the chart: Bearish
Price could potentially make a bearish reaction off pivot and drop to 1st support.
Pivot: 18,231.43
Supporting reasons: Identified as a pullback resistance level, aligned with the 38.20% Fibonacci Retracement, suggesting a significant historical area where selling pressure may increase.
1st support: 17,903.57
Supporting reasons: Identified as an overlap support level, indicating a historical area where buying interest has previously emerged.
1st resistance: 18,505.28
Supporting reasons: Identified as a pullback resistance level, aligned with the 78.60% Fibonacci Retracement, marking a critical area where selling pressure may intensify and potentially halt further upward movement.
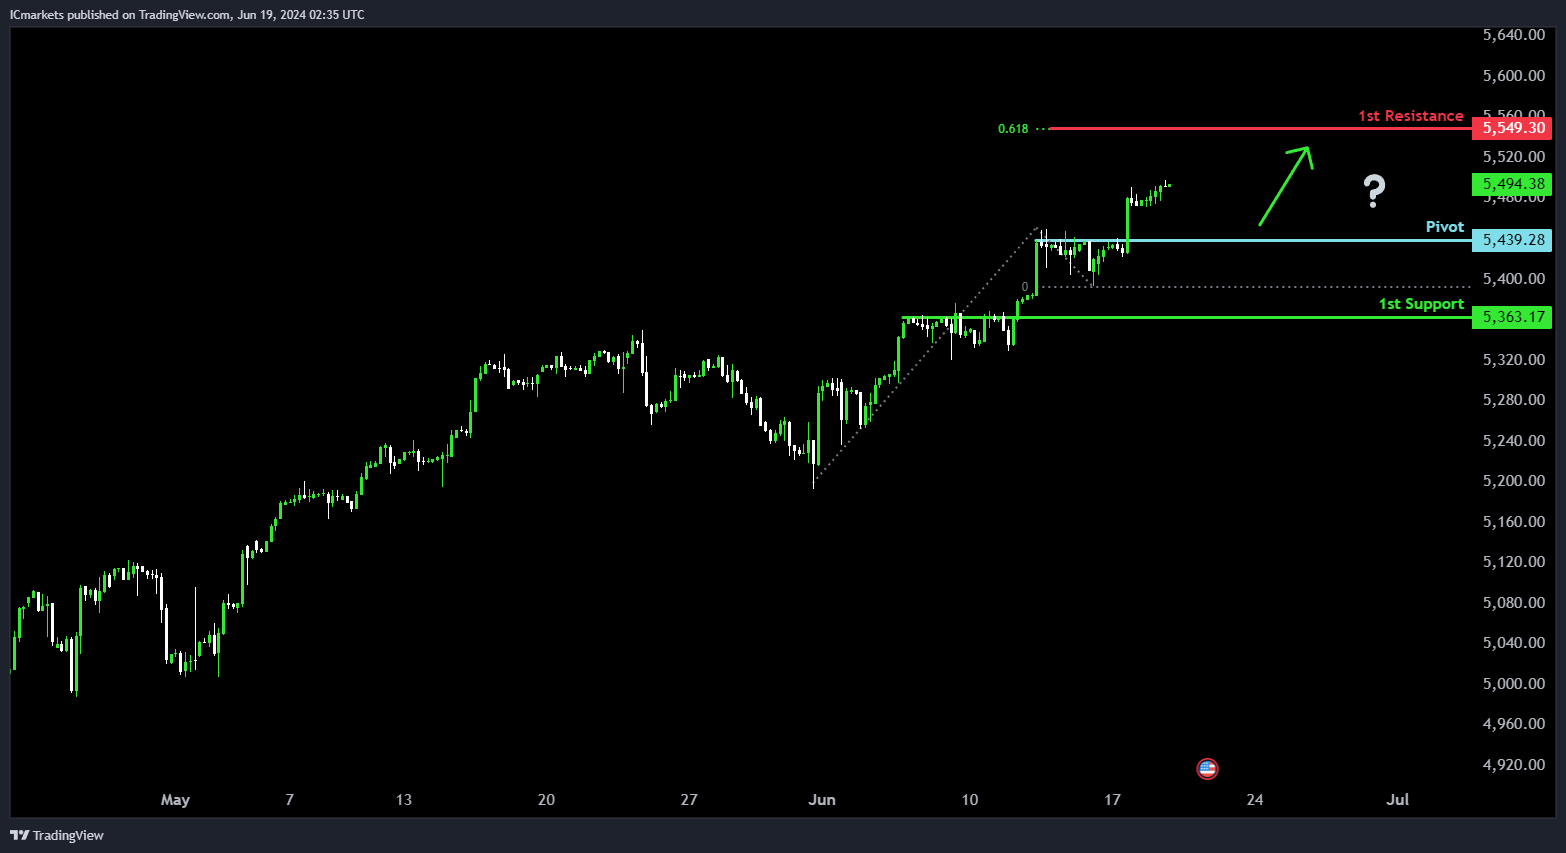
US500 (S&P 500):
Potential Direction: Bullish
Overall momentum of the chart: Bullish
Price could potentially make a bullish bounce off pivot and heads towards 1st resistance.
Pivot: 5,439.28
Supporting reasons: Identified as a pullback support level, suggesting a historical area where buying interest could emerge.
1st support: 5,363.17
Supporting reasons: Identified as a pullback support level, indicating a significant historical area where buying activity has previously occurred.
1st resistance: 5,495.51
Supporting reasons: Identified as a swing high resistance level close to 61.8% Fibonacci projection, suggesting a critical area where selling pressure may intensify and potentially halt further upward movement.
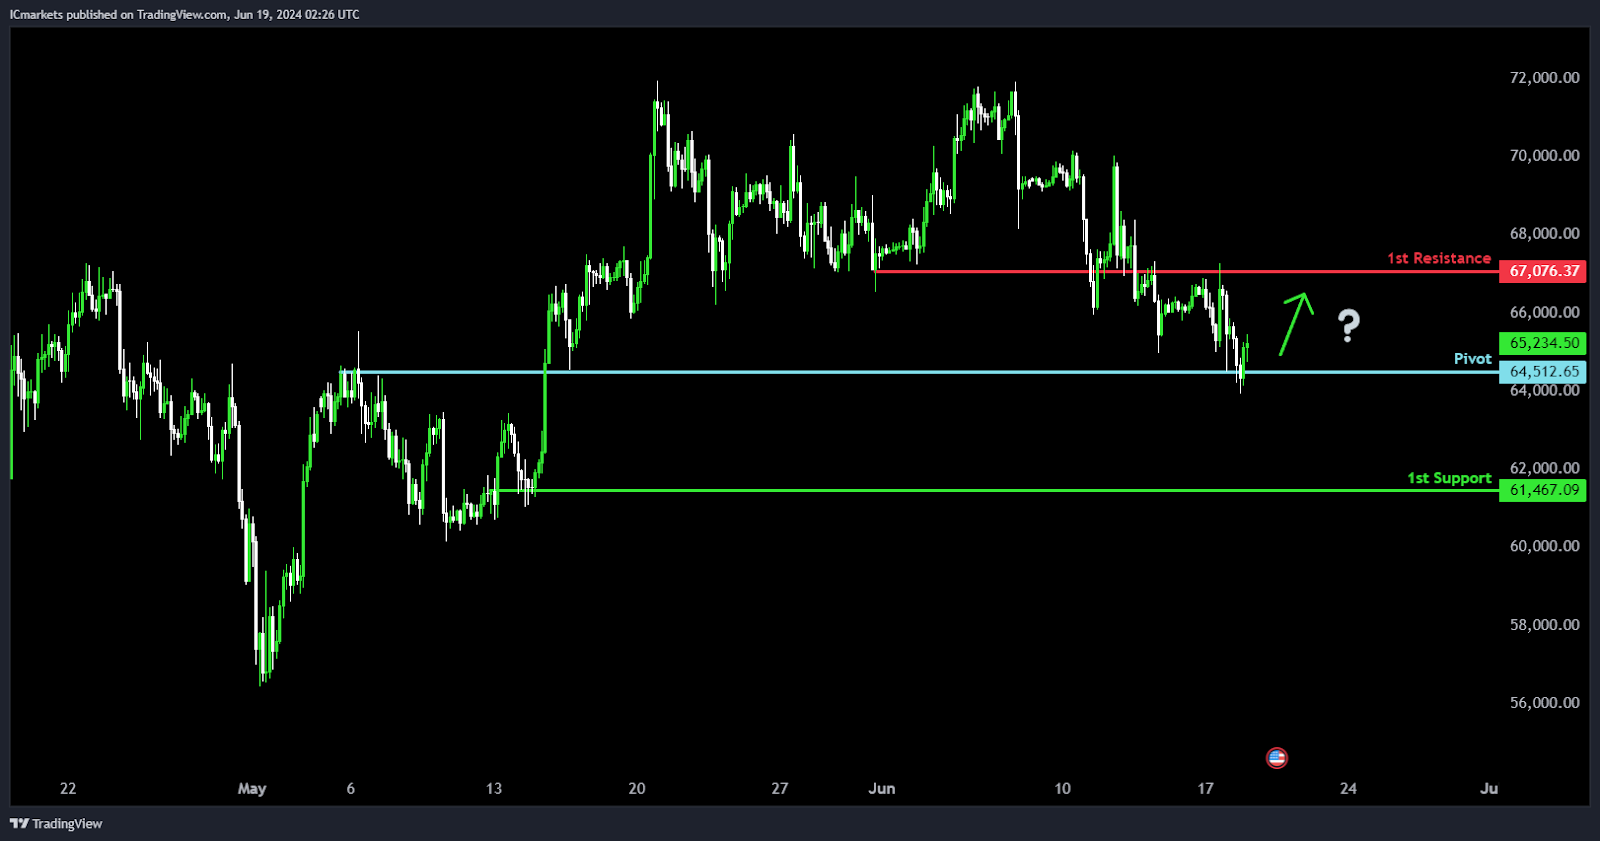
BTC/USD (Bitcoin):
Potential Direction: Bullish
Overall momentum of the chart: Bearish
Price could potentially make a bullish continuation towards 1st resistance.
Pivot: 64512.65
Supporting reasons: Identified as an overlap support level, indicating historical significance as a level where buying interest has previously emerged.
1st support: 61467.09
Supporting reasons: Identified as an overlap support level, suggesting a significant historical area where buyers have previously been active.
1st resistance: 67076.37
Supporting reasons: Identified as an overlap resistance level, indicating a historical barrier where selling pressure may be encountered.
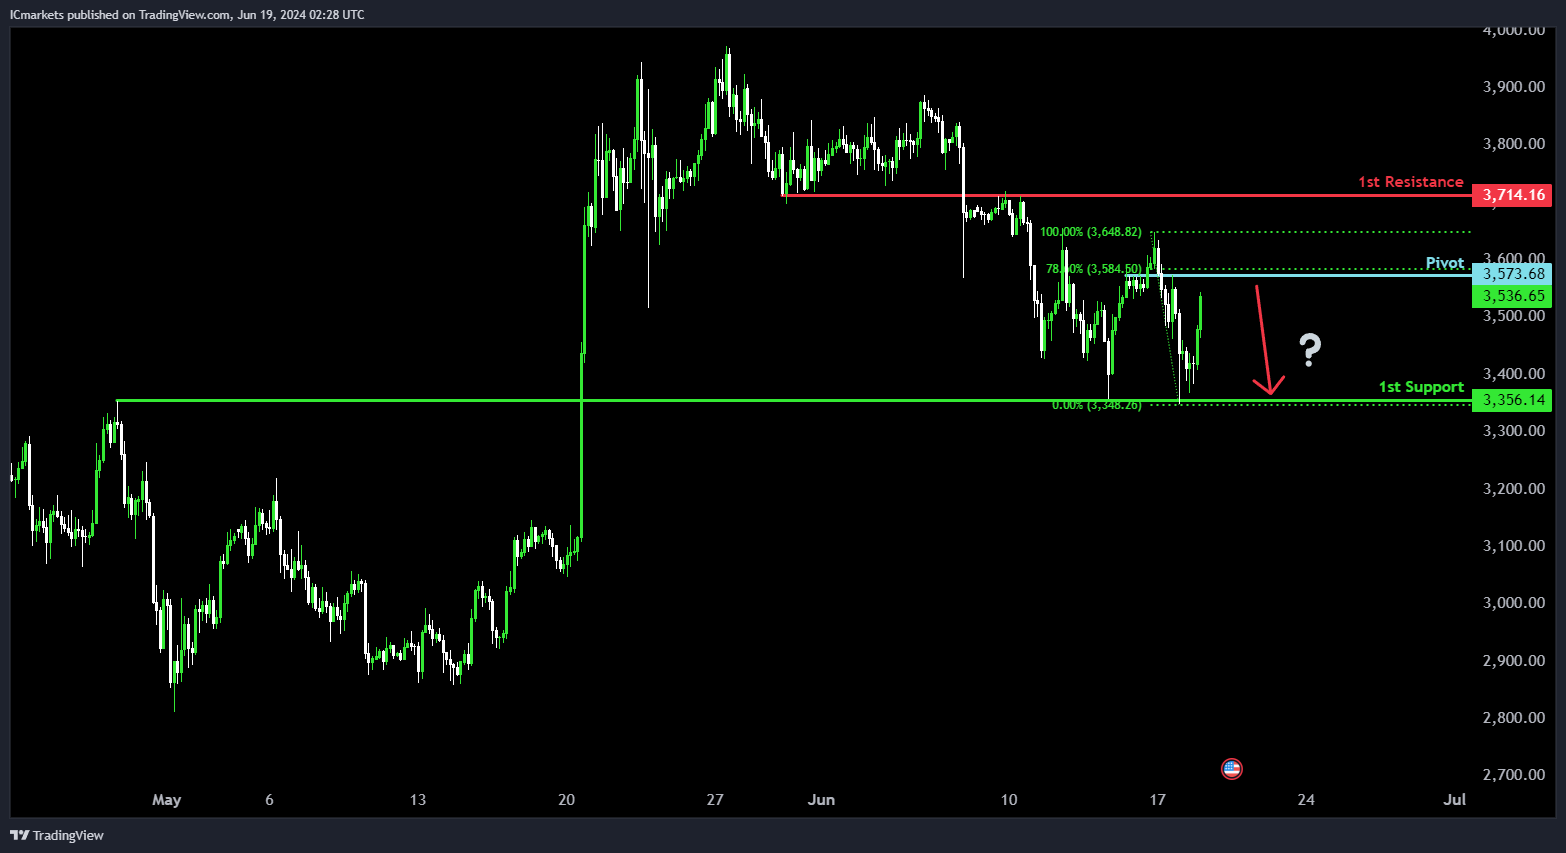
ETH/USD (Ethereum):
Potential Direction: Bearish
Overall momentum of the chart: Bearish
Price could potentially make a bearish reaction off pivot and drop to 1st support.
Pivot: 3573.68
Supporting reasons: Identified as a pullback resistance level, coinciding with the 78.60% Fibonacci Retracement, suggesting a strong historical level where selling pressure has previously been significant.
1st support: 3356.14
Supporting reasons: Identified as an overlap support level, indicating a historical area where buying interest has previously emerged.
1st resistance: 3714.16
Supporting reasons: Identified as an overlap resistance level, suggesting a historical barrier where selling pressure may be encountered.
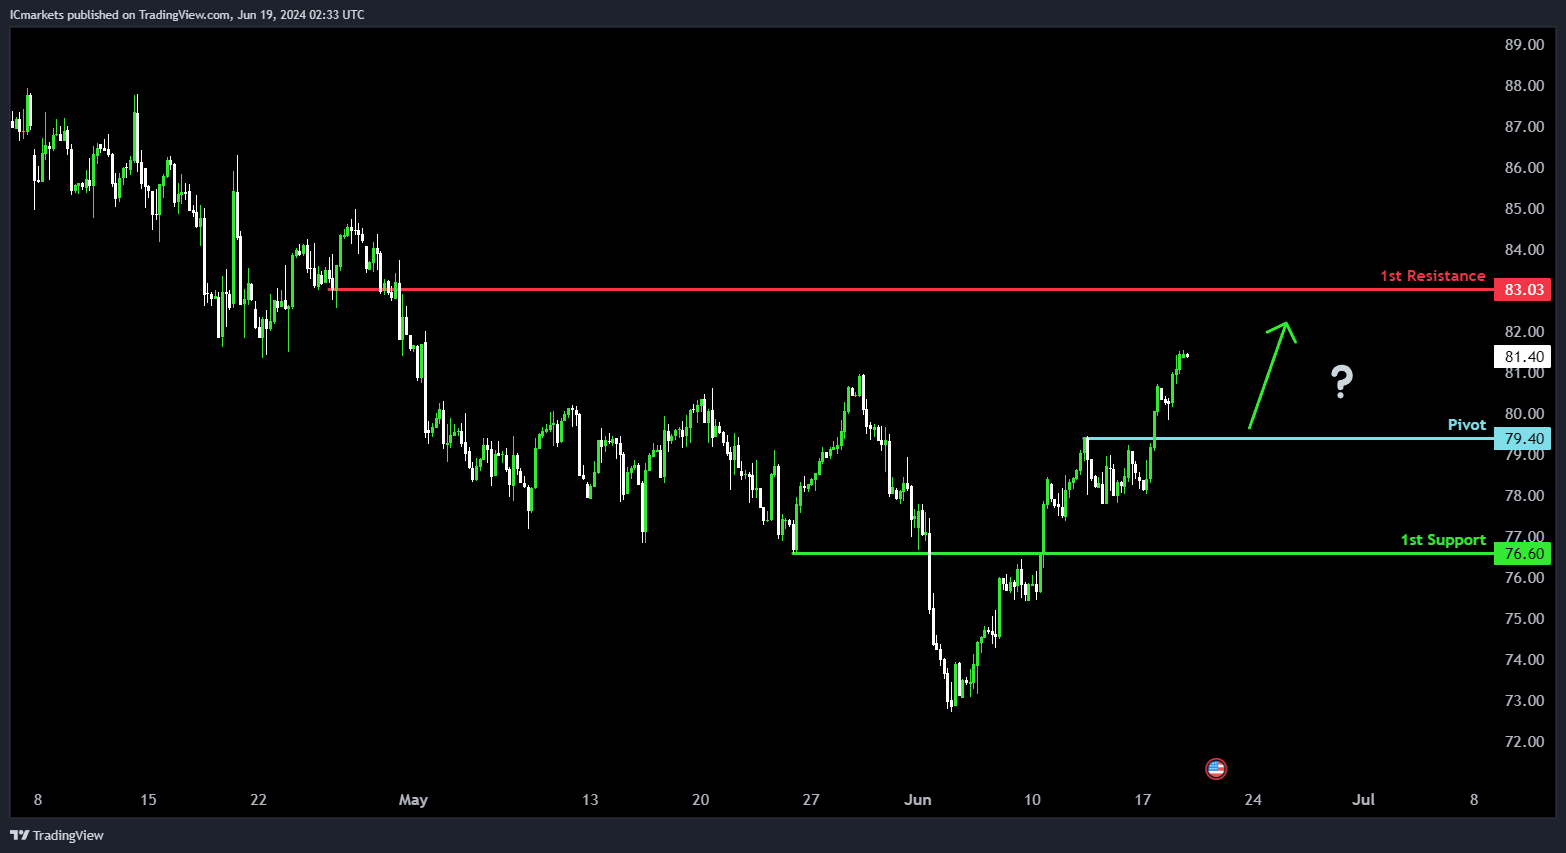
WTI/USD (Oil):
Potential Direction: Bullish
Overall momentum of the chart: Bullish
Price could potentially make a bullish bounce off pivot and heads towards 1st resistance.
Pivot: 79.40
Supporting reasons: Identified as a pullback support level, indicating a historical area where buying interest could potentially emerge.
1st support: 76.60
Supporting reasons: Identified as a pullback support level, suggesting a significant historical level where buying interest has previously emerged.
1st resistance: 83.03
Supporting reasons: Identified as an overlap resistance level, marking a critical area where selling pressure may intensify and potentially halt further upward movement.
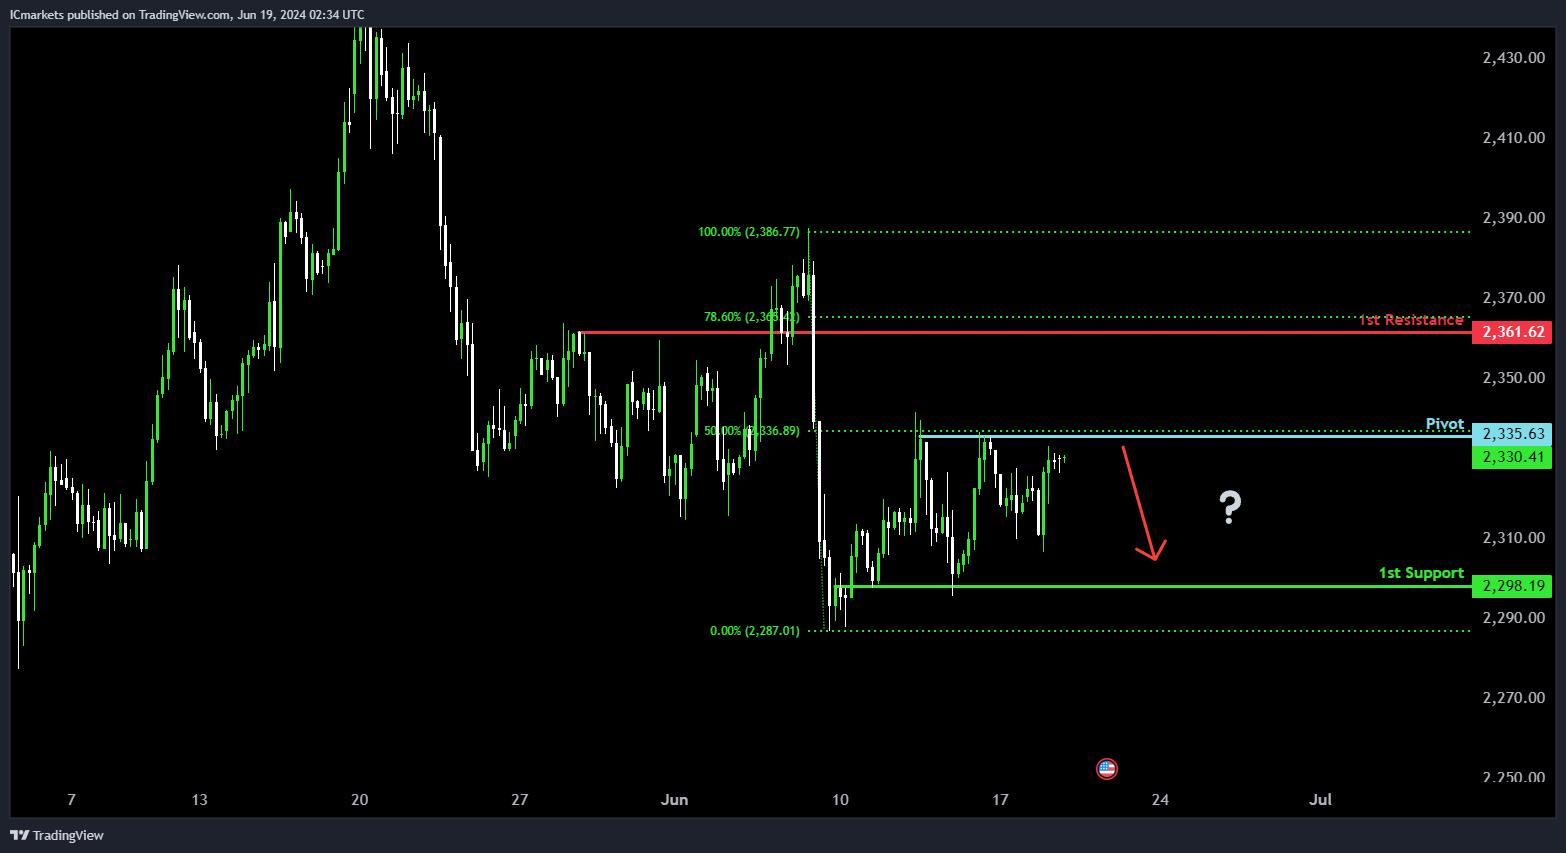
XAU/USD (GOLD):
Potential Direction: Bearish
Overall momentum of the chart: Bearish
Price could potentially make a bearish reaction off pivot and drop to 1st support.
Pivot: 2335.63
Supporting reasons: Identified as a multi-swing high resistance level, coinciding with the 50% Fibonacci Retracement, indicating a significant historical barrier where selling pressure has been observed.
1st support: 2298.19
Supporting reasons: Identified as an overlap support level, suggesting a historical area where buying interest has previously emerged, potentially providing a floor for price declines.
1st resistance: 2361.62
Supporting reasons: Identified as a pullback resistance level, coinciding with the 78.60% Fibonacci Retracement, indicating a historical level where selling pressure may intensify.
The accuracy, completeness and timeliness of the information contained on this site cannot be guaranteed. IC Markets does not warranty, guarantee or make any representations, or assume any liability regarding financial results based on the use of the information in the site.
News, views, opinions, recommendations and other information obtained from sources outside of www.icmarkets.com.au, used in this site are believed to be reliable, but we cannot guarantee their accuracy or completeness. All such information is subject to change at any time without notice. IC Markets assumes no responsibility for the content of any linked site.
The fact that such links may exist does not indicate approval or endorsement of any material contained on any linked site. IC Markets is not liable for any harm caused by the transmission, through accessing the services or information on this site, of a computer virus, or other computer code or programming device that might be used to access, delete, damage, disable, disrupt or otherwise impede in any manner, the operation of the site or of any user’s software, hardware, data or property.


