A note on lower timeframe confirming price action…
Waiting for lower timeframe confirmation is our main tool to confirm strength within higher timeframe zones, and has really been the key to our trading success. It takes a little time to understand the subtle nuances, however, as each trade is never the same, but once you master the rhythm so to speak, you will be saved from countless unnecessary losing trades. The following is a list of what we look for:
- A break/retest of supply or demand dependent on which way you’re trading.
- A trendline break/retest.
- Buying/selling tails – essentially we look for a cluster of very obvious spikes off of lower timeframe support and resistance levels within the higher timeframe zone.
- Candlestick patterns. We tend to only stick with pin bars and engulfing bars as these have proven to be the most effective.
For us, lower timeframe confirmation starts on the M15 and finishes up on the H1, since most of our higher timeframe areas begin with the H4. Stops usually placed 5-10 pips beyond your confirming structures.
EUR/USD:
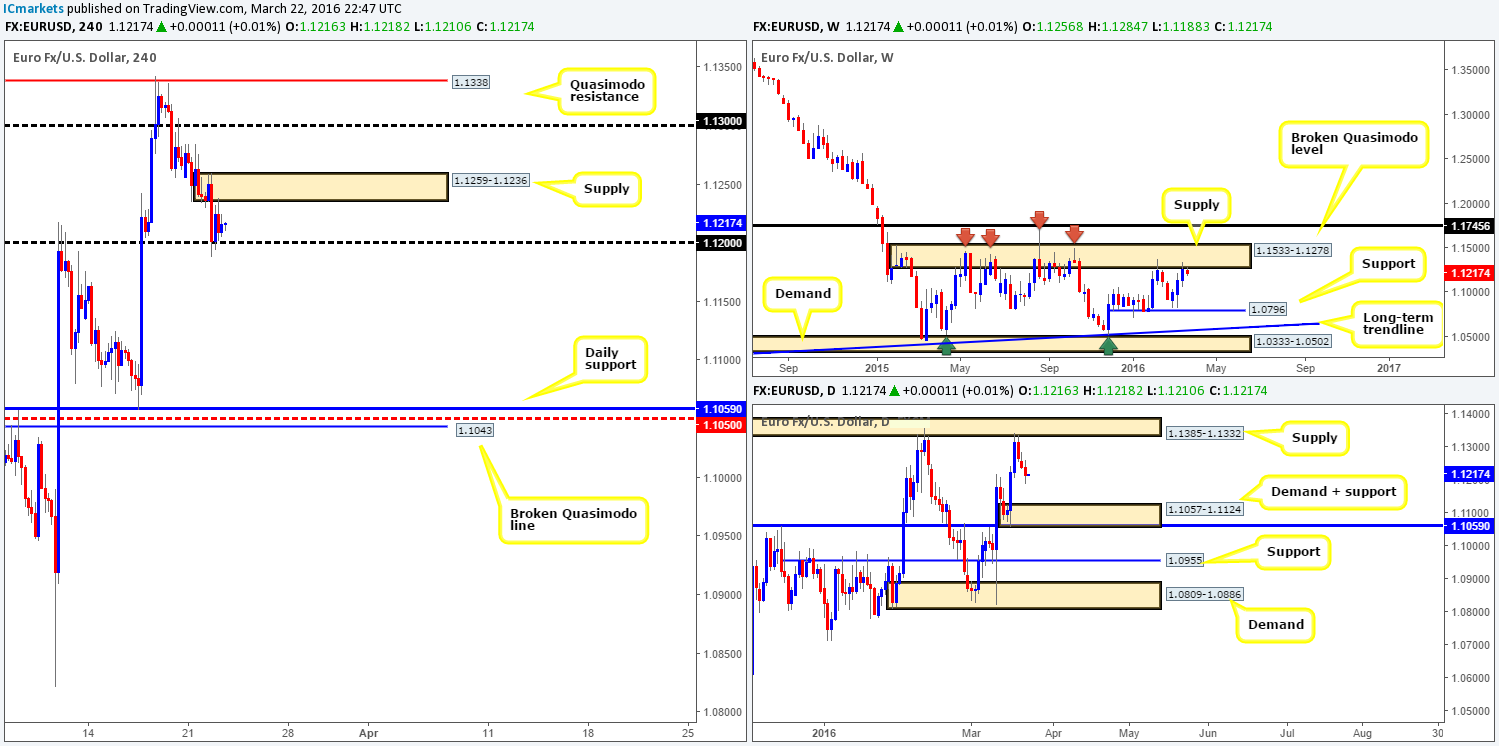
The bearish pulse continues to beat in the EUR/USD market, as the single currency was forced down to the 1.1200 mark yesterday. Consequent to this, the bulls and bears are now seen battling for position between the above said round-number and a H4 supply positioned just above at 1.1259-1.1236. For those who have been following our reports over the past few days, you may recall that we took a short position at 1.1273 just before the market closed last week. Our first take-profit target was hit during the London open yesterday, allowing us to liquidate 60% of our position around the 1.1200 region, and move our stops to breakeven – conveniently above the newly-formed H4 supply. Well done to any of our readers who jumped aboard this one with us!
As we mentioned in yesterday’s report, we feel the higher-timeframe picture shows that this pair has room to drop further. Here’s why: weekly price is currently trading from major supply coming in at 1.1533-1.1278, whilst down on the daily chart, supply at 1.1385-1.1332 (located just within the above said weekly supply area) has firmly established itself on its second retest. The closest support structure between the two, at least in our book, is a daily demand area penciled in at 1.1057-1.1124.
Despite all the points made above, however, the U.S. dollar index is now trading at a firm H4 resistance point drawn from the 95.67 mark at the moment, which could pressure this EUR higher today and take our stop. In consequence, 1.1200 is a key number for our team today. Continued support from this level breeds doubt for a further breakdown in price, whilst a decisive close beyond this number opens the path south down to the top-side of daily demand at 1.1124 – a clear 75-pip run! That being the case, should prices break lower, traders may want to keep an eye on any retest seen at this number for a possible short trade.
Levels to watch/live orders:
- Buys: Flat (Stop loss: N/A).
- Sells: 1.1273 [LIVE] (Stop loss: breakeven). Watch for price to consume 1.1200 and look to trade any retest seen thereafter (lower timeframe confirmation preferred).
GBP/USD:
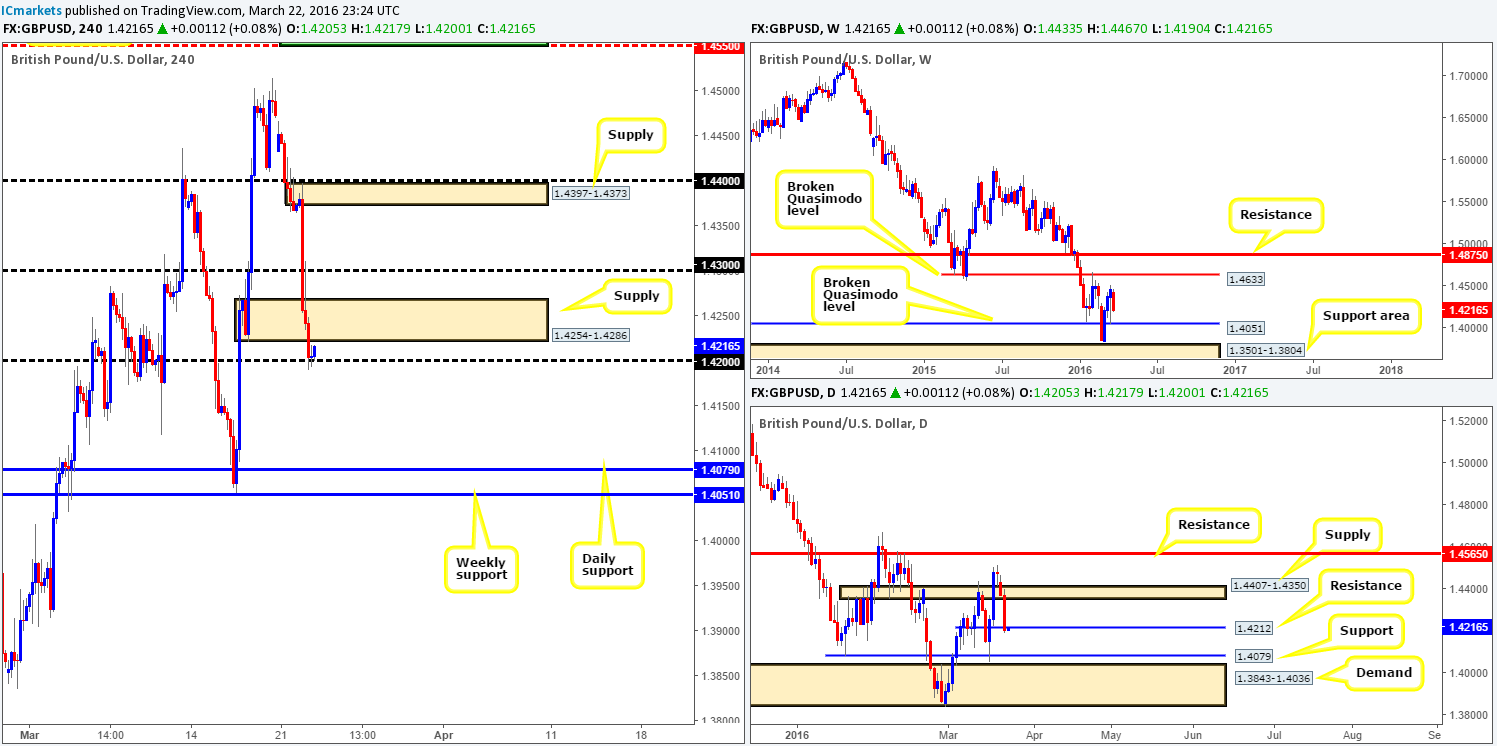
Using a top-down approach this morning, weekly action shows little support to stop this pair from pushing lower until around the 1.4051 mark – a broken Quasimodo level. Along the same vein, daily support (now acting resistance) at 1.4212 was recently consumed, giving price further breathing room for a move down to support coming in at 1.4079, followed closely by a rather large demand at 1.3843-1.4036.
Jumping across to the H4 chart, we can see that yesterday’s sell-off took place going into the European open as Brexit fears continue to plague this market. As you can see, this allowed price to smother H4 demand at 1.4254-1.4286 and connect with the 1.4200 figure by the American open, which for now is holding firm as support.
From a technical standpoint this pair is looking soft! As such, our plan of attack for today’s upcoming sessions will consist of watching for a close below and retest of the 1.4200 figure, targeting the 1.4100 level. We would strongly recommend waiting for a lower timeframe sell signal (see top of page for confirmation techniques) before placing an order here, however, since round-numbers, as most are already aware, are prone to some very nasty fakeouts!
Levels to watch/live orders:
- Buys: Flat (Stop loss: N/A).
- Sells: Watch for price to consumed 1.4200 and look to trade any retest seen thereafter (lower timeframe confirmation required).
AUD/USD:
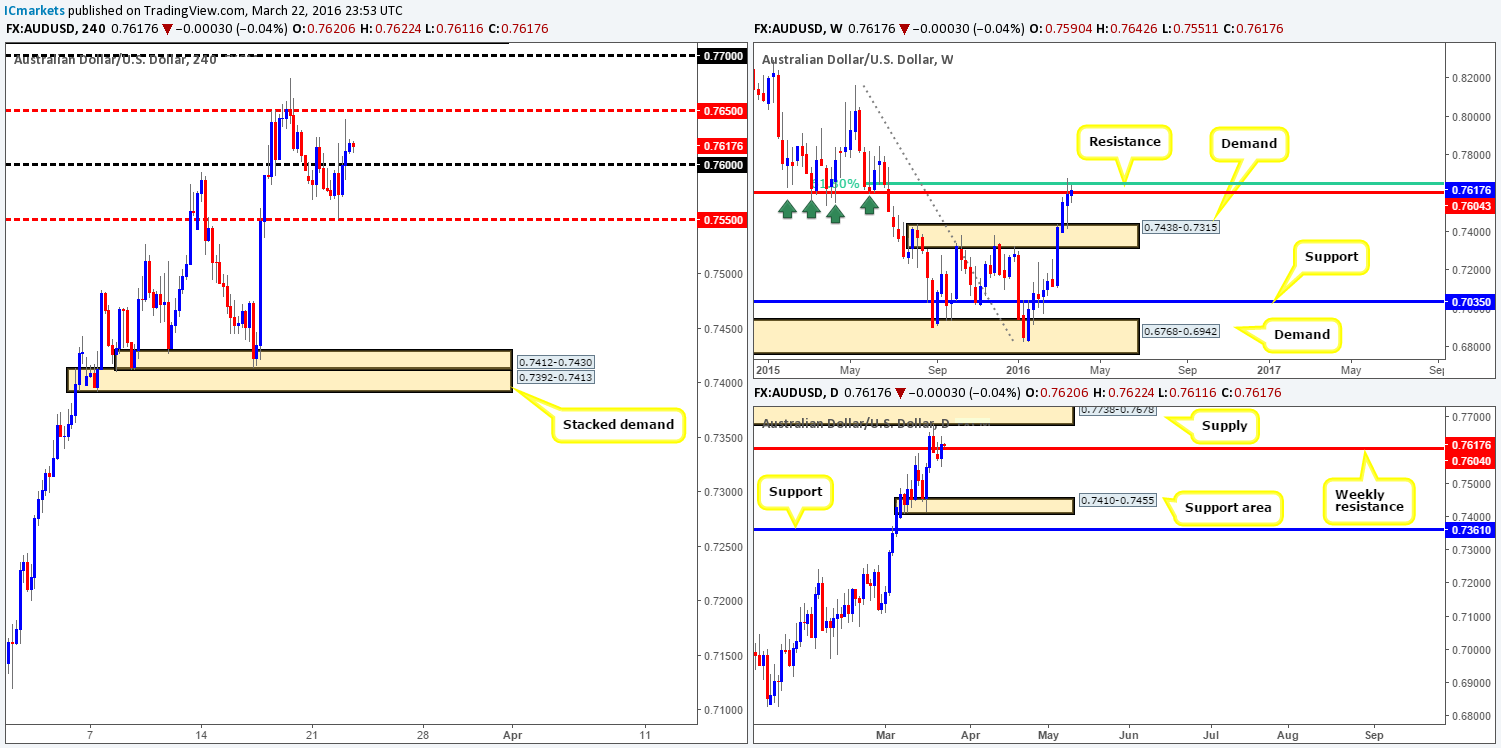
Going into yesterday’s London open, the commodity currency found active bids just ahead of the H4 mid-level line at 0.7550. From there on the Aussie rallied higher, punching through offers at the 0.7600 figure and ending the day topping out around the 0.7620 region.
Technically, this pair is drawing in mixed opinions. While the weekly timeframe is currently showing a clear line of resistance at 0.7604, bolstered by a 61.8% Fibonacci level just above at 0.7647, we’re seeing very little interest from the sellers at the moment. On top of this, yesterday’s rally formed a daily bullish engulfing candle which closed above the aforementioned weekly resistance, and shows room for price to attack near-term supply at 0.7738-0.7678 for the second time. All of this, coupled with price tightly confined between the 0.7600 handle and the H4 mid-level barrier 0.7650 at the moment, there is not, at least as far as we can see, much in the way of a tradable setup on this pair at present. As such, we plan on taking a back seat on this pair today and will reassess following further development.
Levels to watch/live orders:
- Buys: Flat (Stop loss: N/A).
- Sells: Flat (Stop loss: N/A).
USD/JPY:
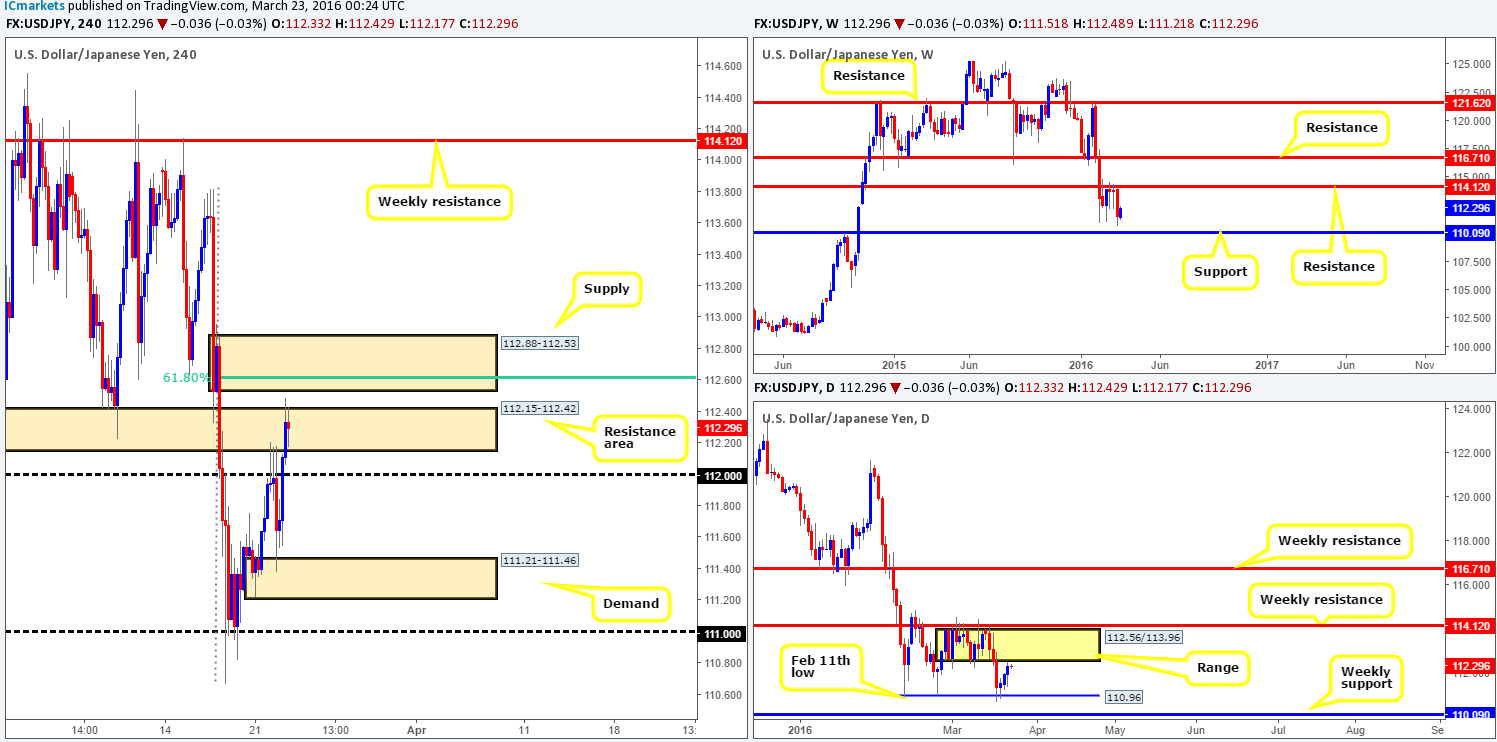
Following three picture-perfect H4 selling wicks through the 112.00 handle into the lower edge of a H4 resistance area at 112.15-112.42, price was forced down to H4 demand at 111.21-111.46 early on in the European session yesterday. Shortly after a brief stint of consolidation here during the London morning session, U.S. traders stepped in and aggressively pushed this pair through 112.00 and slightly surpassed the aforementioned H4 resistance zone.
Both this H4 resistance area and the H4 supply zone above at 112.88-112.53 look interesting, with the upper zone appearing the better of the two at the moment! The reasons for why is that the upper base is firmly positioned around the underside of a daily range lower limit at 112.56, and is also bolstered by a 61.8% Fibonacci level at 112.61.
Given the points made above, our prime focus will be on looking for lower timeframe short entries within the above said H4 supply zone today. Depending on what price we enter at, we’d look to reduce risk relatively quickly as support could come into the market around the current H4 resistance area which at that point would be support. From there on we’d look to trail our position lower to see what the pair will give.
Levels to watch/live orders:
- Buys: Flat (Stop loss: N/A).
- Sells: 112.88-112.53 [Tentative – confirmation required] (Stop loss: dependent on where one confirms this area).
USD/CAD:
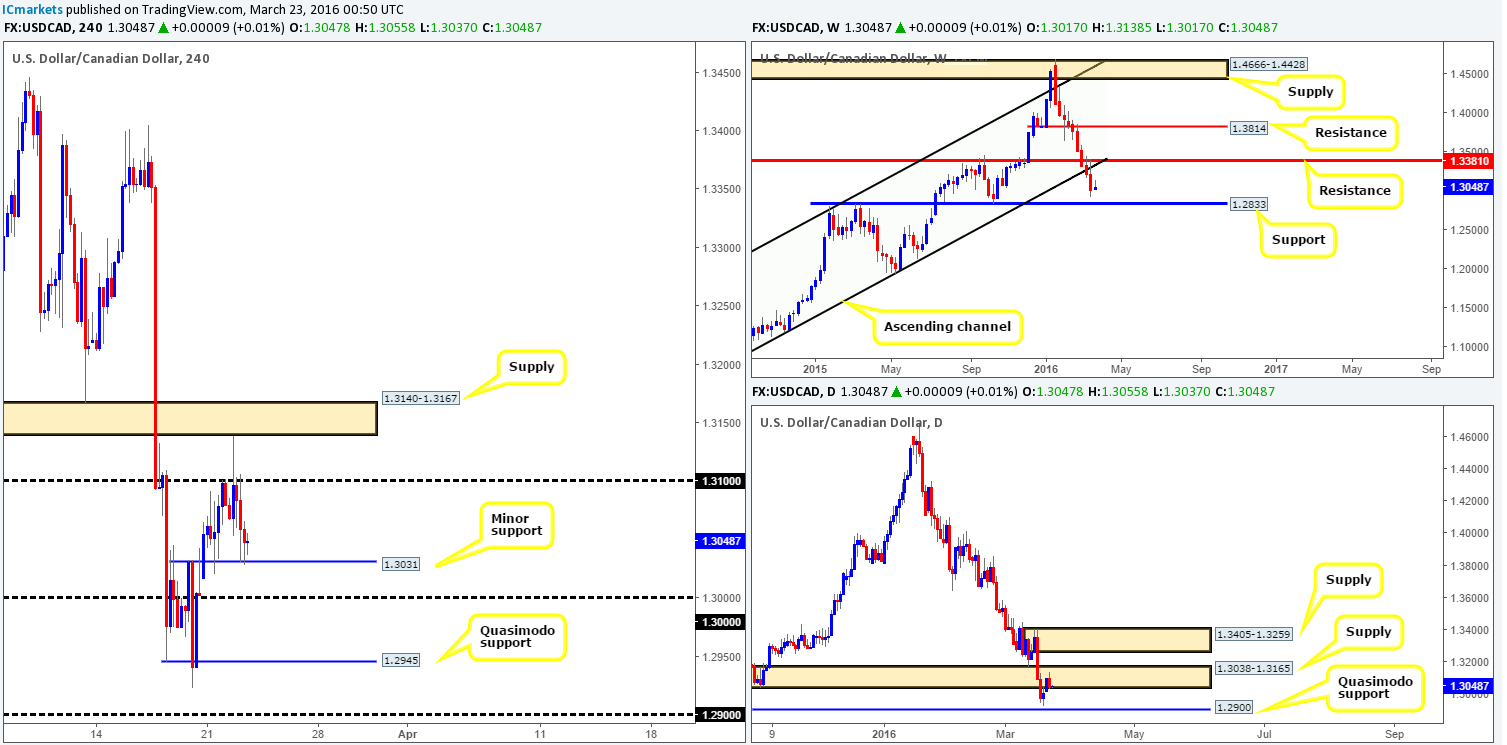
In recent trading, the London open saw price beautifully fake through offers at 1.3100 and just miss connecting with H4 supply at 1.3140-1.3167 before selling-off down towards minor H4 support drawn from 1.3031, which for the time being is holding firm.
Based on the above, where does one go from here? Well, over on the weekly chart there’s room for this market to continue driving lower as price has yet to collide with support coming in at 1.2833. In-line with this weekly expectation, daily activity is currently seen housed within supply chalked up at 1.3038-1.3165. From these points, we believe shorting this market is the more logical approach today.
Despite this, with H4 trading around support (see above) right now and a large round-number sitting just below it at 1.3000, selling this market would be too tight for us. The alternative would be a close below 1.3000, since there is over fifty pips of room to target one – a H4 Quasimodo support at 1.2945, followed closely by the 1.2900 handle, which is also a Quasimodo support on the daily chart.
Levels to watch/live orders:
- Buys: Flat (Stop loss: N/A).
- Sells: Watch for price to consume 1.3000 and look to trade any retest seen thereafter (lower timeframe confirmation required).
USD/CHF:
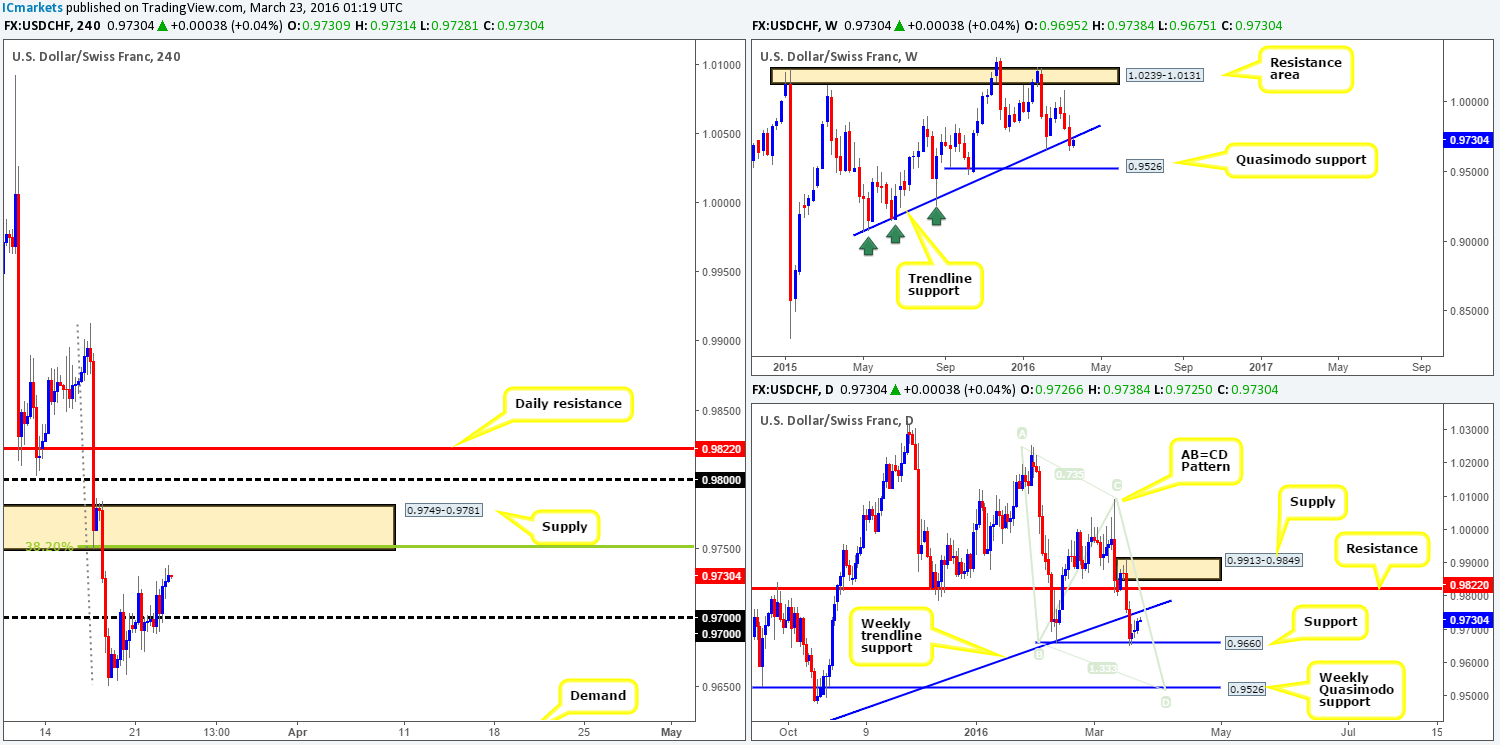
Since the USD/CHF shook hands with daily support (Feb 11th low) at 0.9660 last Thursday, the pair has been grinding north. The word ‘grinding’ seems accurate here due to this market having risen less than 100 pips from that time! Looking above current prices on the H4 chart, one can see that the next obstacle for buyers to contend with falls in at a H4 supply coming in at 0.9749-0.9781. Not only is this barrier strengthened by a 38.2% Fibonacci level at 0.9751, it also ties in nicely with the recently broken weekly trendline support extended from the low 0.9071.
On account of the above, our analysis is a relatively simple one today. Watch for price to connect with the above said H4 supply zone and enter short if and only if you manage to pin down a lower timeframe sell signal (for ways of looking for confirmation techniques see above). The reason for requiring confirmation here is simply to avoid a fakeout above to the 0.9800 figure and quite possibly daily resistance seen at 0.9822.
Levels to watch/live orders:
- Buys: Flat (Stop loss: N/A).
- Sells: 0.9749-0.9781 [Tentative – confirmation required] (Stop loss: dependent on where one confirms this area).
DOW 30:
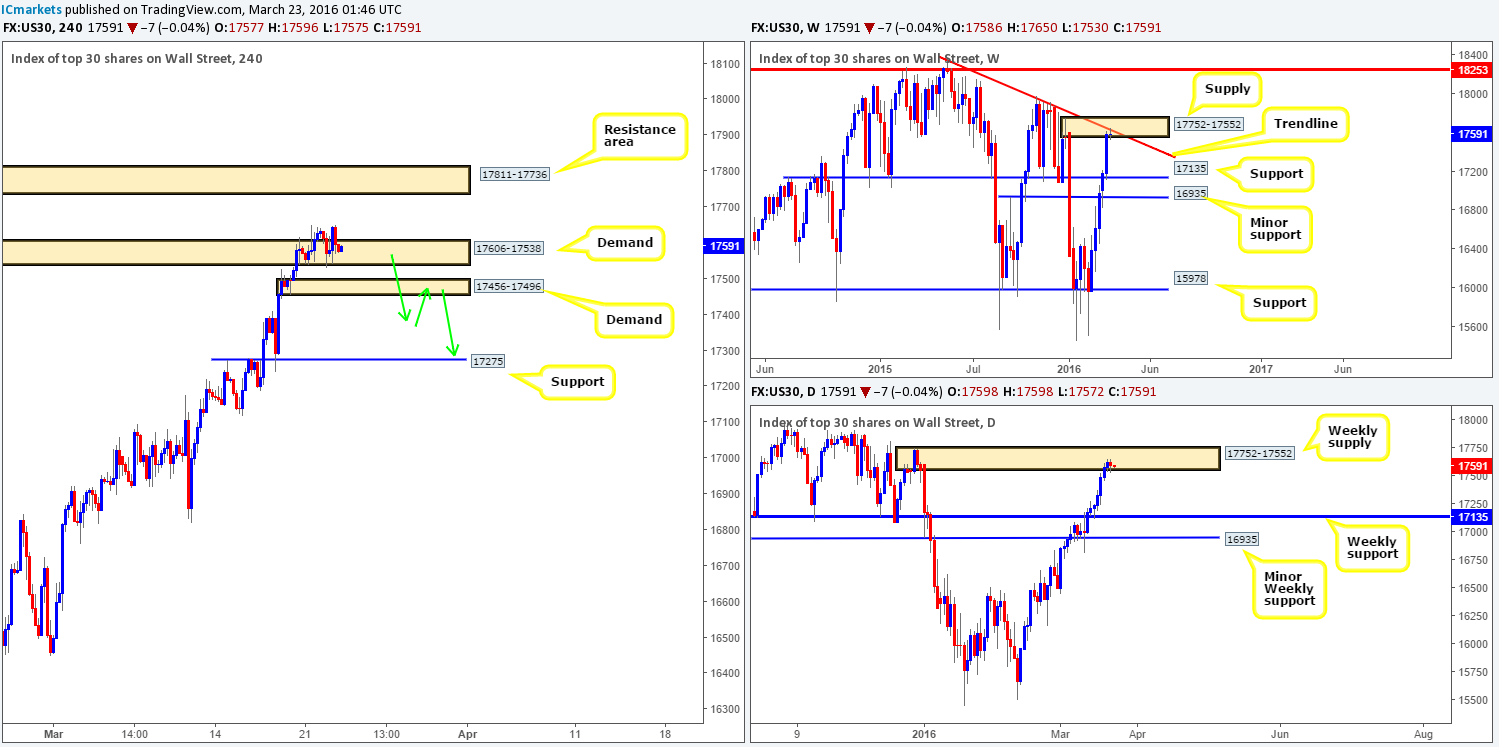
From Friday onwards, the DOW has seen very little action as the market entered into a phase of consolidation within H4 demand coming in at 17606-17538. More precisely, price has been ranging between 17557/17632. Now, given that this unit also recently plugged into weekly supply at 17752-17552 and more recently connected with its converging trendline resistance taken from the high 18365, buying from the current H4 demand is out of the question for us!
In regards to selling this instrument, which seems more logical than buying considering the higher-timeframe picture (see above), we’d like to see price CLOSE below and retest H4 demand penciled in at 17456-17496 as supply before we begin looking to short (see green arrows). This will not only likely confirm selling strength from the weekly supply, but also open the gates for price to challenge H4 support drawn from 17275.
Levels to watch/live orders:
- Buys: Flat (Stop loss: N/A).
- Sells: Watch for price to consume 17456-17496 and look to trade any retest seen thereafter (lower timeframe confirmation required).
XAU/USD: (Gold)
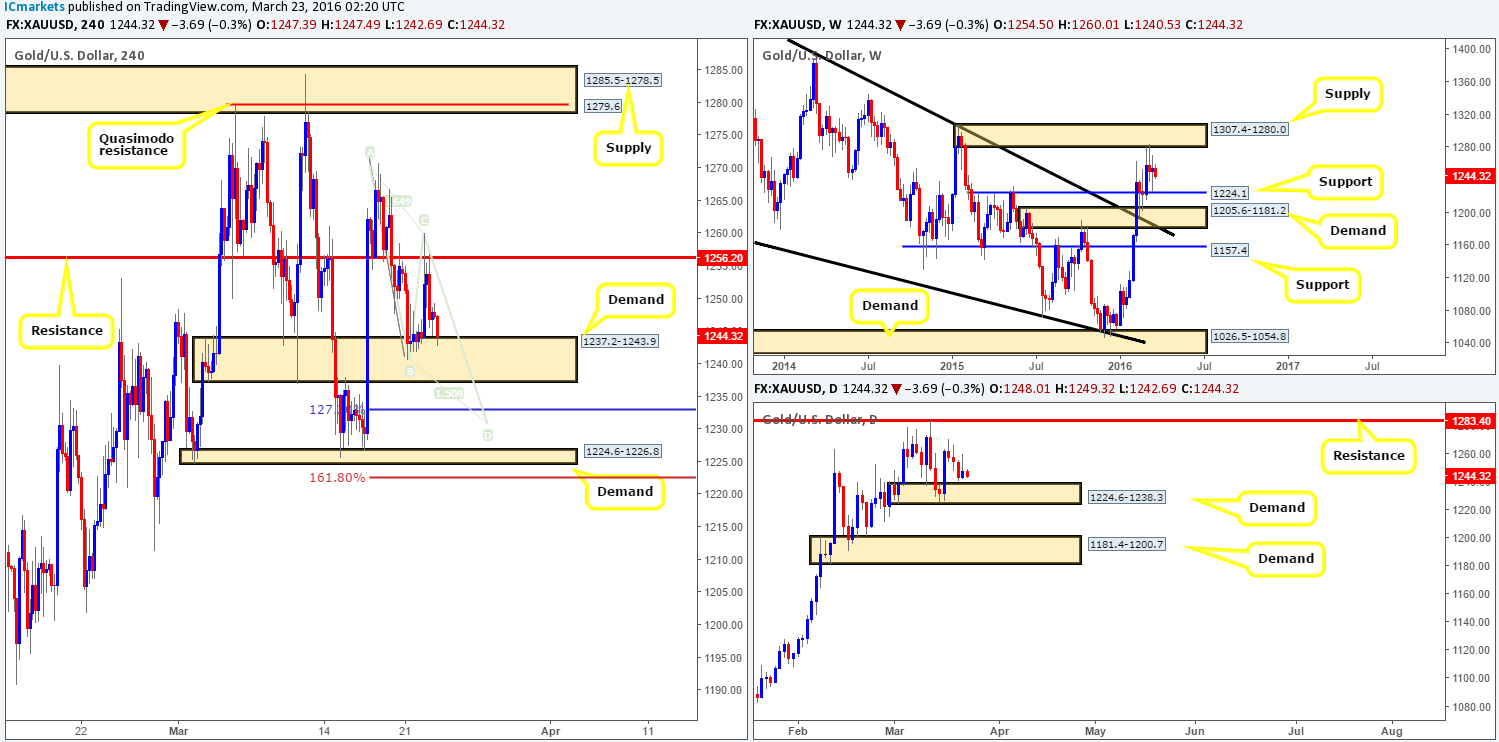
Beginning with a look at the weekly chart this morning, we can see that price remains loitering mid-range between supply painted at 1307.4-1280.0 and support drawn from 1224.1. At this point in time, there is, as far as we see, very little directional value coming in from this timeframe. Bouncing down to the daily chart on the other hand, the buyers and sellers are currently hovering just ahead of demand fixed at 1224.6-1238.3, which is bolstered by the weekly support level just below it at 1224.1.
Moving across to the H4 chart it’s clear that some very interesting price action is forming. As a start, the yellow metal appears to be chalking up a D-leg of an AB=CD bull pattern which completes around the 1230.0 mark. However, we would like for price to connect with the small, albeit powerful, H4 demand at 1224.6-1226.8 before looking to take a long position. Reason being is this area lurks within the extremes of both the AB=CD buy zone (formed between the 127.2% and 161.8% extensions [1222.6/1232.9]), the extremes of the daily demand zone mentioned above at 1224.6-1238.3 and also comes close to weekly support at 1224.1. All in all a very tight area of confluence seen here!
Taking into account the above notes, our team has elected to place a pending buy order at 1227.7 with a stop-loss order below at 1221.0. As for take-profit targets, these will be dependent on the H4 approach to our buy zone.
Levels to watch/live orders:
- Buys: 1227.7 (Stop loss: 1221.0).
- Sells: Flat (Stop loss: N/A).
