
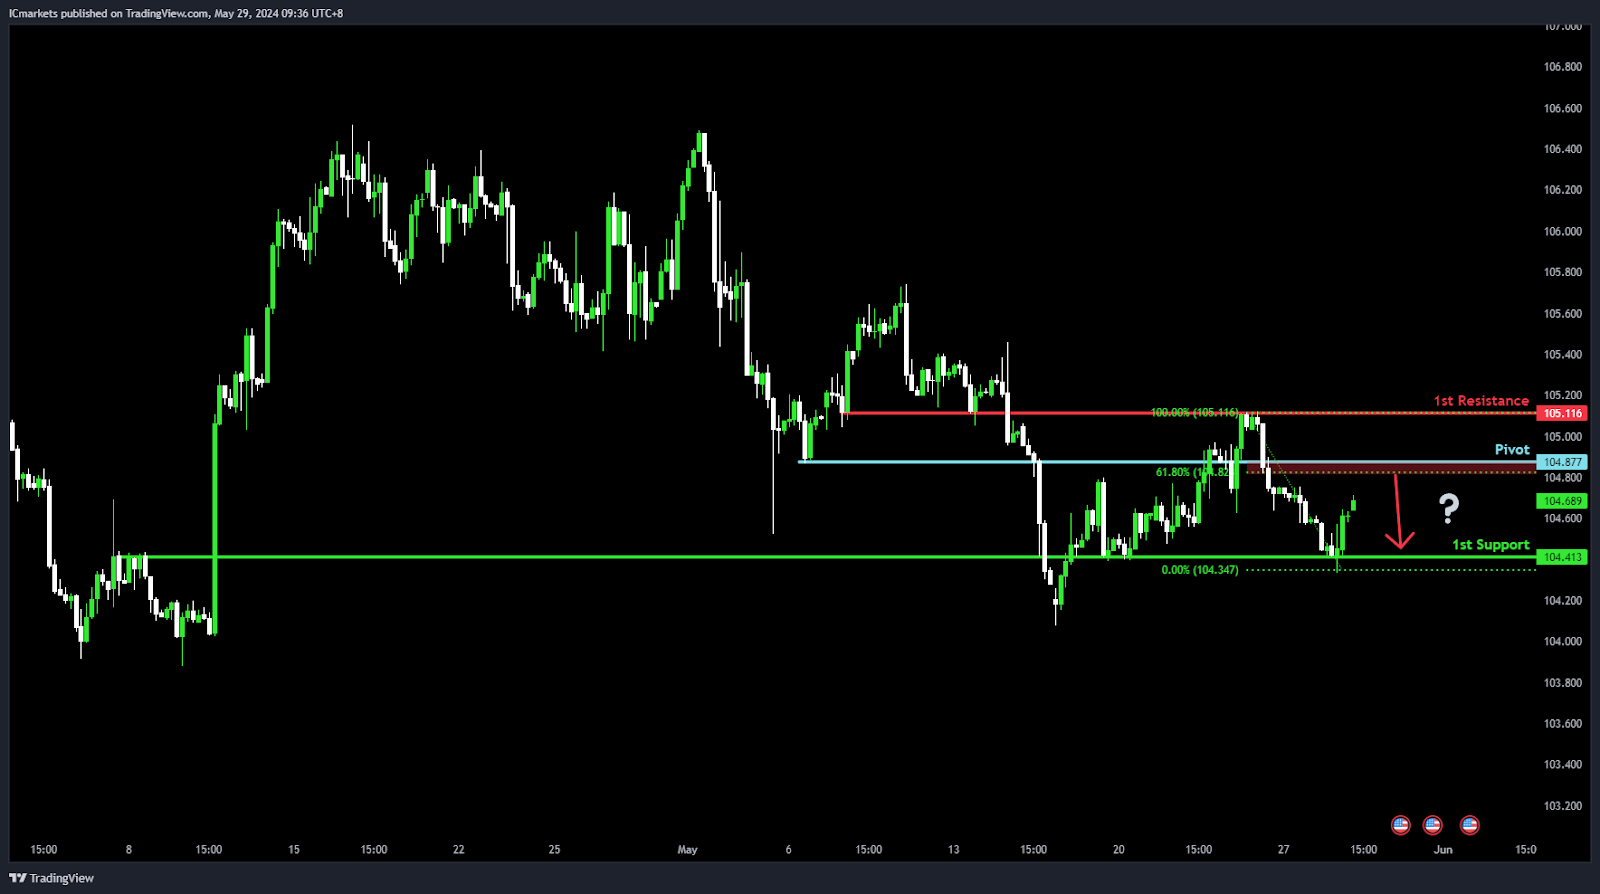
DXY (US Dollar Index):
Potential Direction: Bearish Overall momentum of the chart: Bearish
Price could potentially make a bearish reaction off pivot and drop to 1st support.
Pivot: 104.87 Supporting reasons: Identified as pullback resistance, suggesting a level where selling pressure may intensify. This level coincides with the 61.80% Fibonacci Retracement, indicating a significant area where bears might take control.
1st support: 104.41 Supporting reasons: Recognized as an overlap support, indicating a historical level where buying interest has emerged. It may act as a support zone for price movement.
1st resistance: 105.11 Supporting reasons: Noted as an overlap resistance, suggesting a level where selling pressure may increase. This level could potentially act as a barrier to further upward movement.
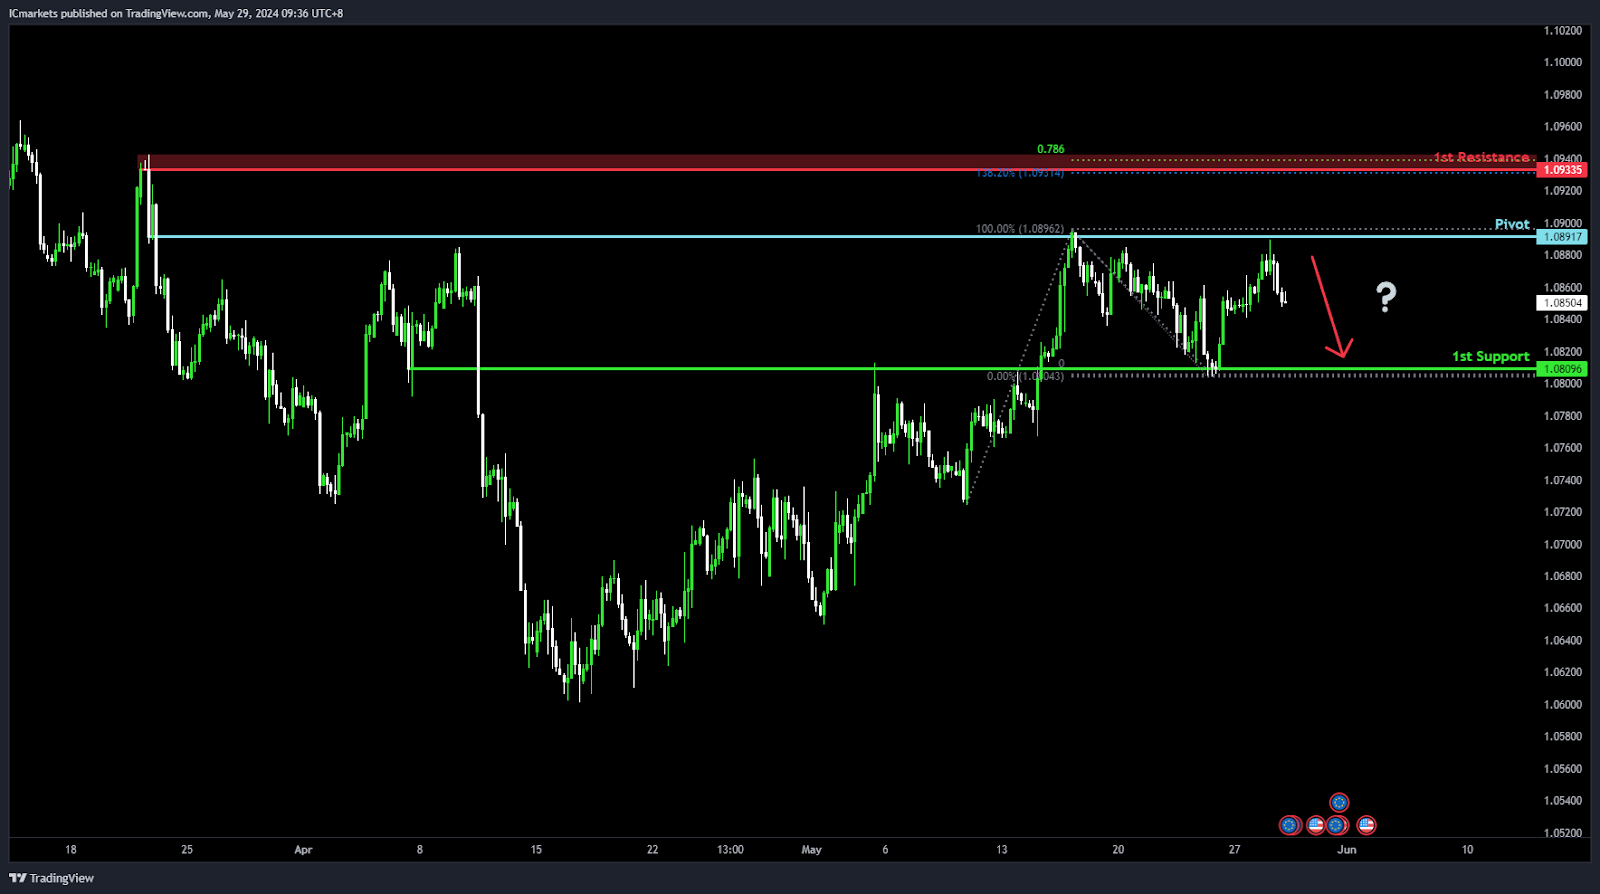
EUR/USD:
Potential Direction: Bearish
Overall momentum of the chart: Bullish
Price could potentially make a bearish continuation towards 1st support
Pivot: 1.0891
Supporting reasons: Identified as an overlap resistance, suggesting it has historically hindered upward movement. Additionally, the presence of the 127.20% Fibonacci Extension and the 78.60% Fibonacci Projection indicates Fibonacci confluence, adding to its significance.
1st support: 1.0809
Supporting reasons: Recognized as an overlap support, implying historical buying interest.
1st resistance: 1.0933
Supporting reasons: Noted as a multi-swing high resistance, the 127.20% Fibonacci Extension and the 78.60% Fibonacci Projection indicate Fibonacci confluence, suggesting a strong barrier to further upward movement.
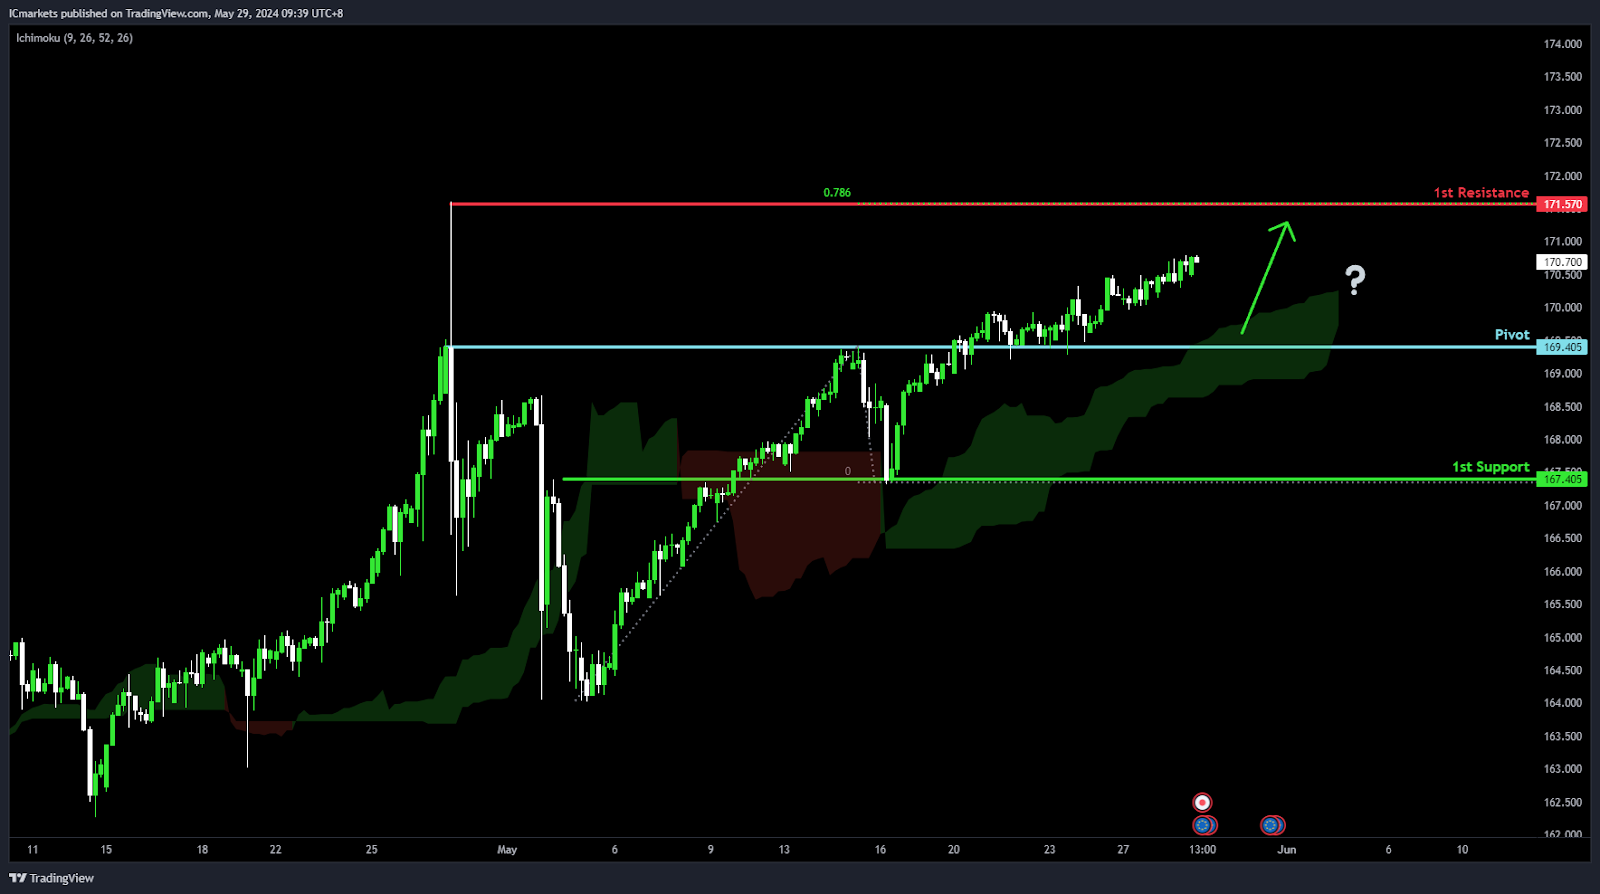
EUR/JPY:
Potential Direction: Bullish Overall momentum of the chart: Bullish Factors contributing to the momentum is that price is: Above the bullish Ichimoku cloud
Price could potentially make a bullish continuation towards 1st resistance.
Pivot: 169.40 Supporting reasons: Identified as an overlap support, indicating a significant level where buying interest has emerged.
1st support: 167.40 Supporting reasons: Recognized as another overlap support, suggesting a historical level where buyers may enter the market.
1st resistance: 171.56 Supporting reasons: Noted as swing high resistance, coinciding with the 78.60% Fibonacci Projection, indicating a potential barrier where selling pressure may increase, potentially hindering further upward movement.
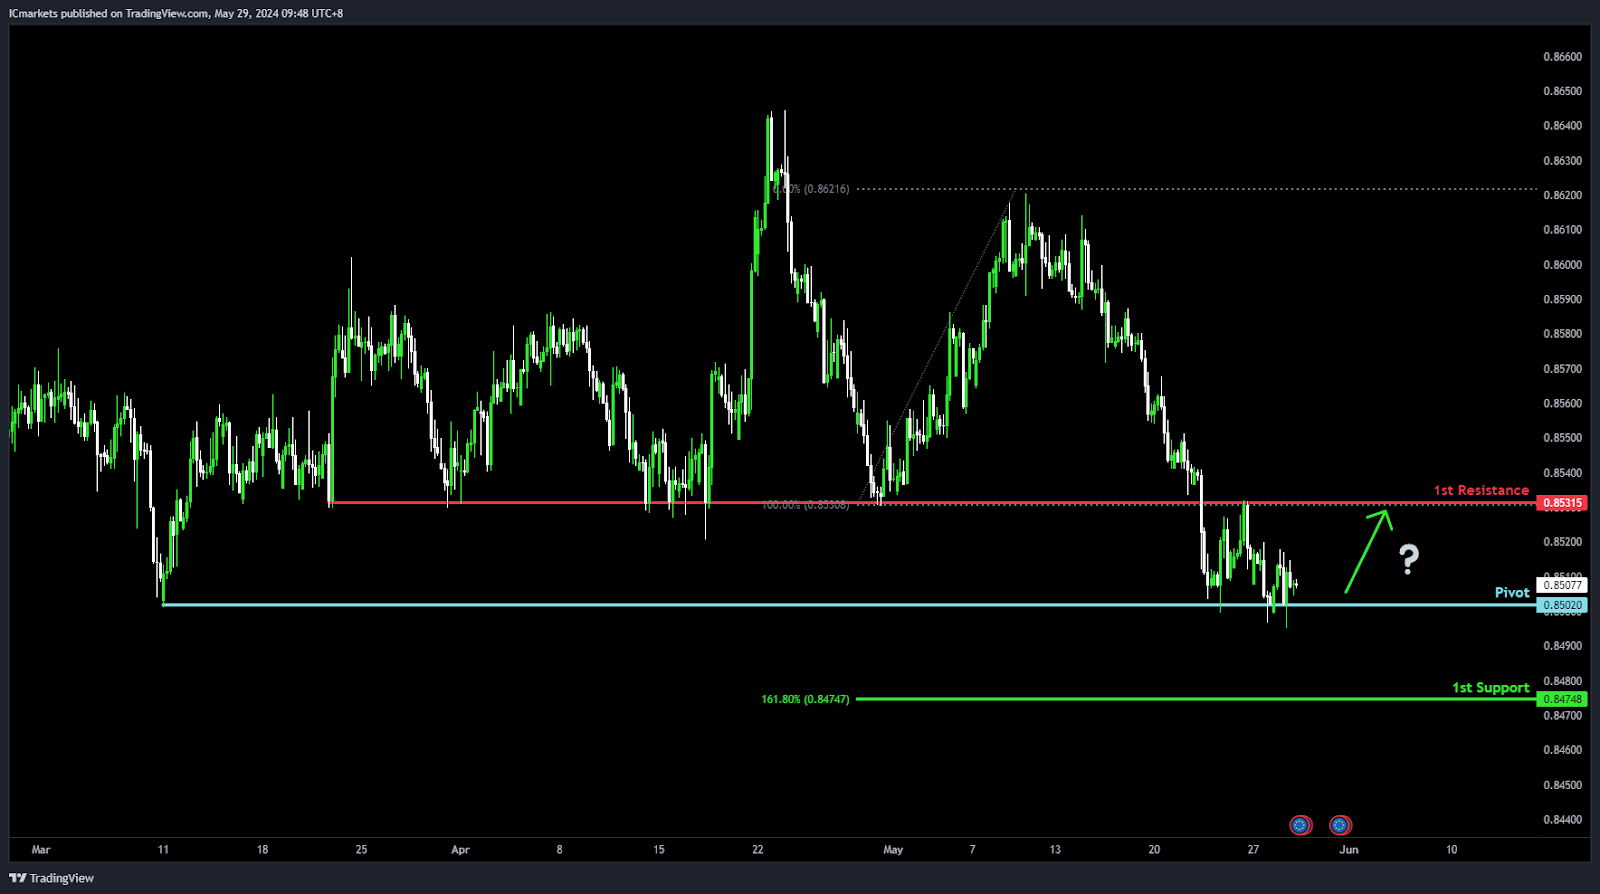
EUR/GBP:
Potential Direction: Bullish
Overall momentum of the chart: Bearish
Price could potentially make a bullish continuation towards 1st resistance.
Pivot: 0.8502
Supporting reasons: Identified as multi-swing low support, suggesting a level where buying interest may emerge.
1st support: 0.8474
Supporting reasons: Recognized as the 161.80% Fibonacci Extension, indicating a potential area of support based on Fibonacci levels.
1st resistance: 0.8531
Supporting reasons: Noted as an overlap resistance, suggesting a level where selling pressure may intensify, potentially hindering further upward movement.
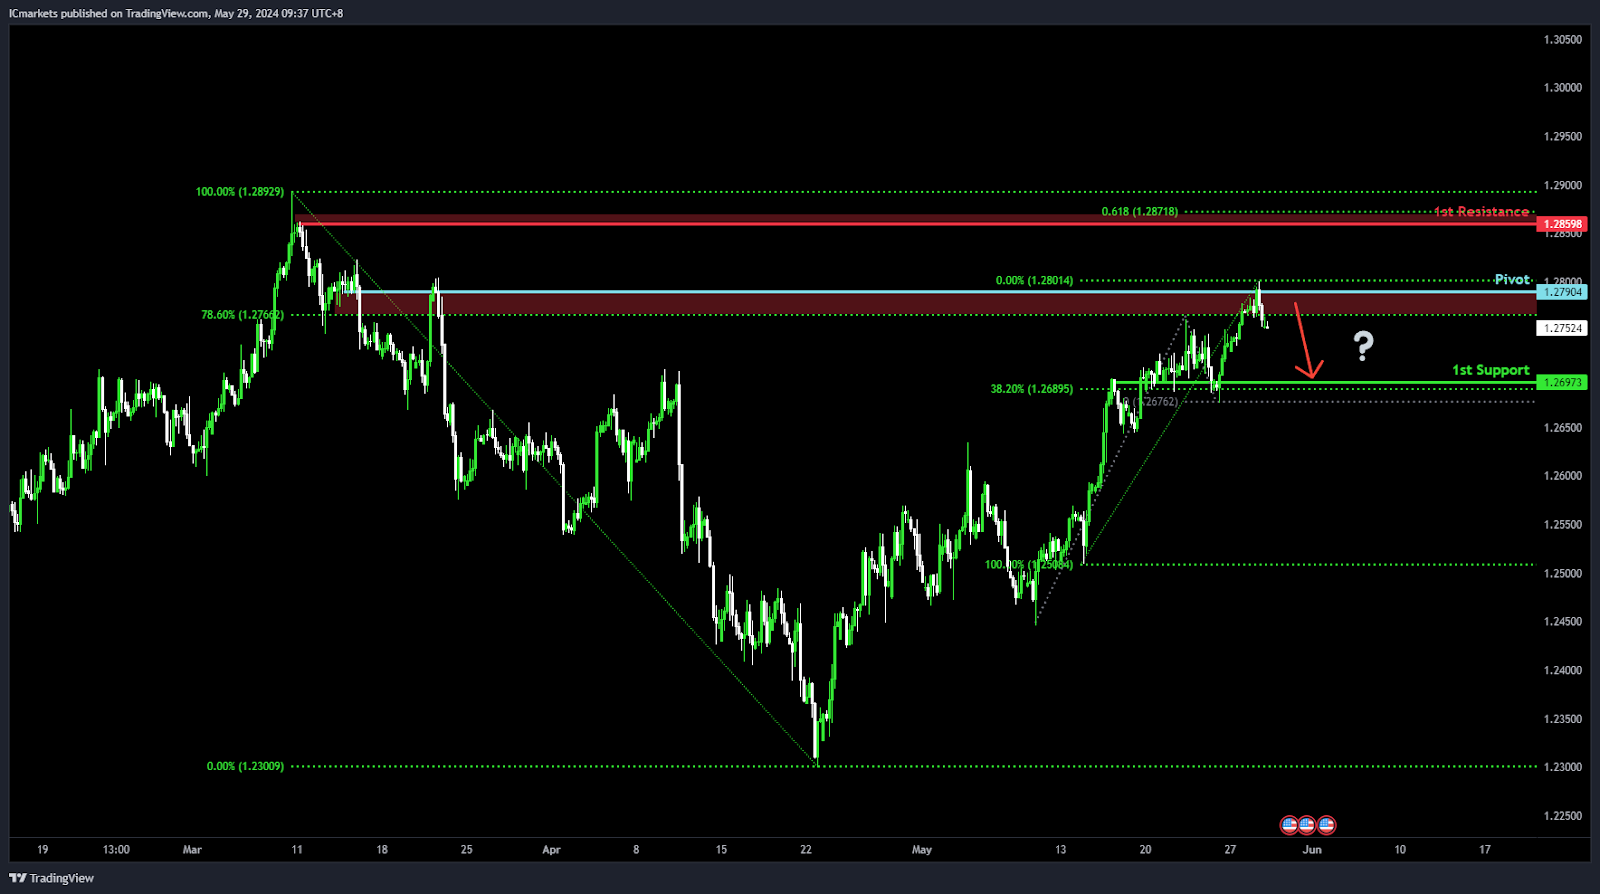
GBP/USD:
Potential Direction: Bearish
Overall momentum of the chart: Bullish
Price could potentially make a bearish continuation towards 1st support.
Pivot: 1.2790
Supporting reasons: Identified as an overlap resistance, coinciding with the 78.60% Fibonacci Retracement, suggesting a significant area where selling pressure may be present.
1st support: 1.2697
Supporting reasons: Recognized as an overlap support, indicating a historical level where buying interest has emerged. Additionally, it aligns with the 38.20% Fibonacci Retracement, adding to its significance as a potential support level.
1st resistance: 1.2859
Supporting reasons: Noted as swing high resistance, coinciding with the 61.80% Fibonacci Projection, indicating a potential barrier where selling pressure may increase, potentially hindering further upward movement.
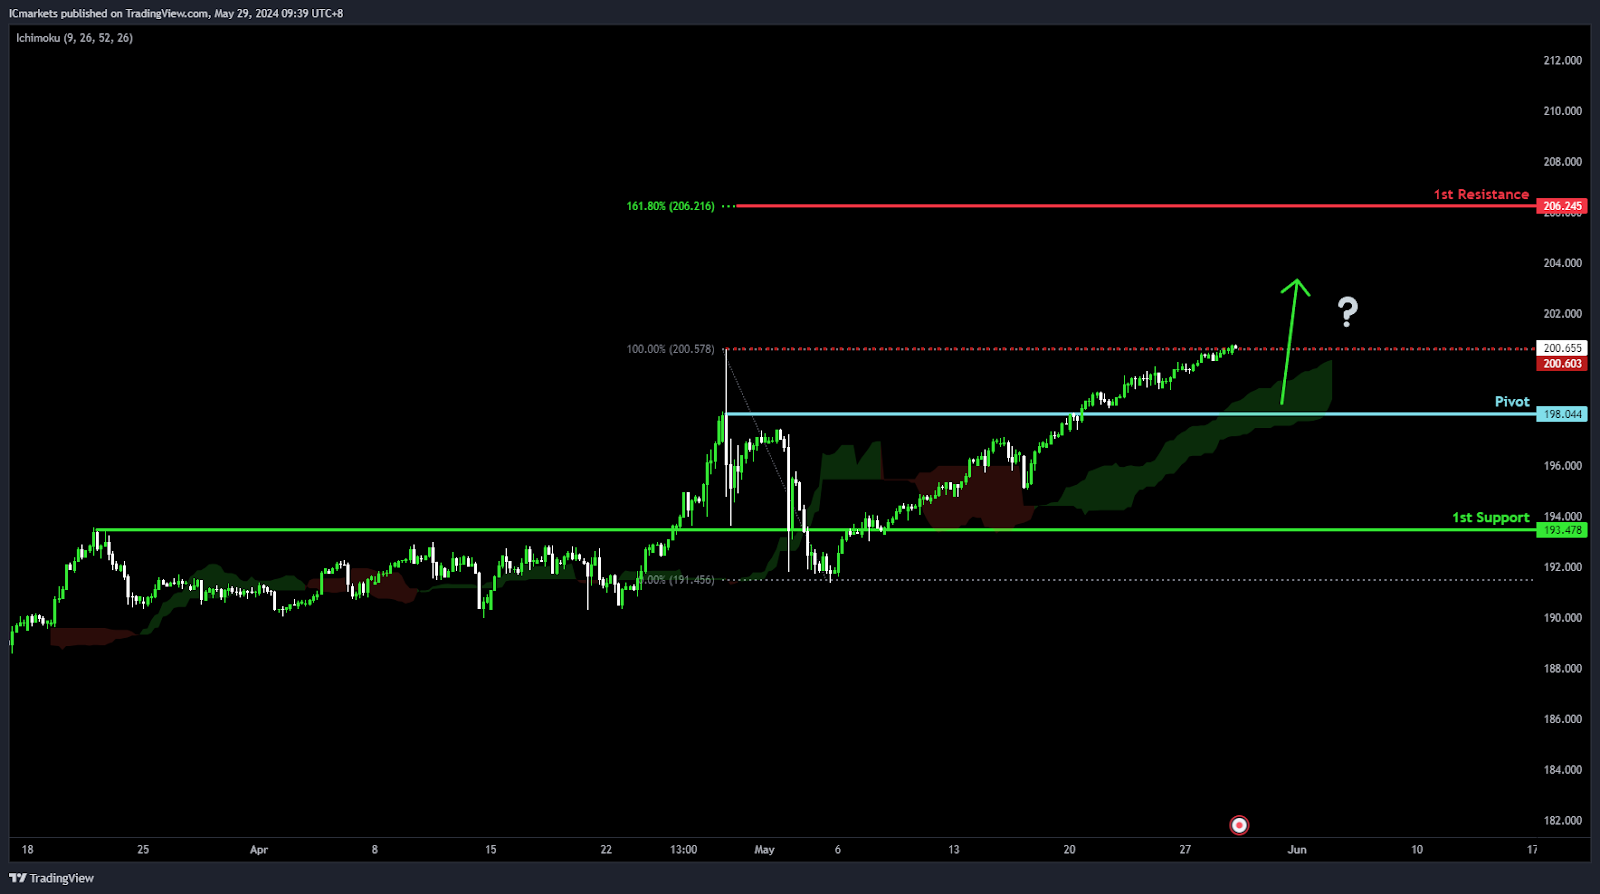
GBP/JPY:
Potential Direction: Bullish
Overall momentum of the chart: Bullish
Factors contributing to the momentum are that the price is above the bullish Ichimoku cloud
Price could potentially make a bullish bounce off pivot and head towards 1st resistance.
Pivot: 198.04
Supporting reasons: Identified as an overlap support, suggesting a significant level where buying interest may emerge.
1st support: 193.47
Supporting reasons: Recognized as an overlap support, indicating a historical level where buying interest has previously emerged.
1st resistance: 206.24
Supporting reasons: Noted as a significant level, coinciding with the 161.80% Fibonacci Extension, suggesting a potential area where selling pressure may intensify.
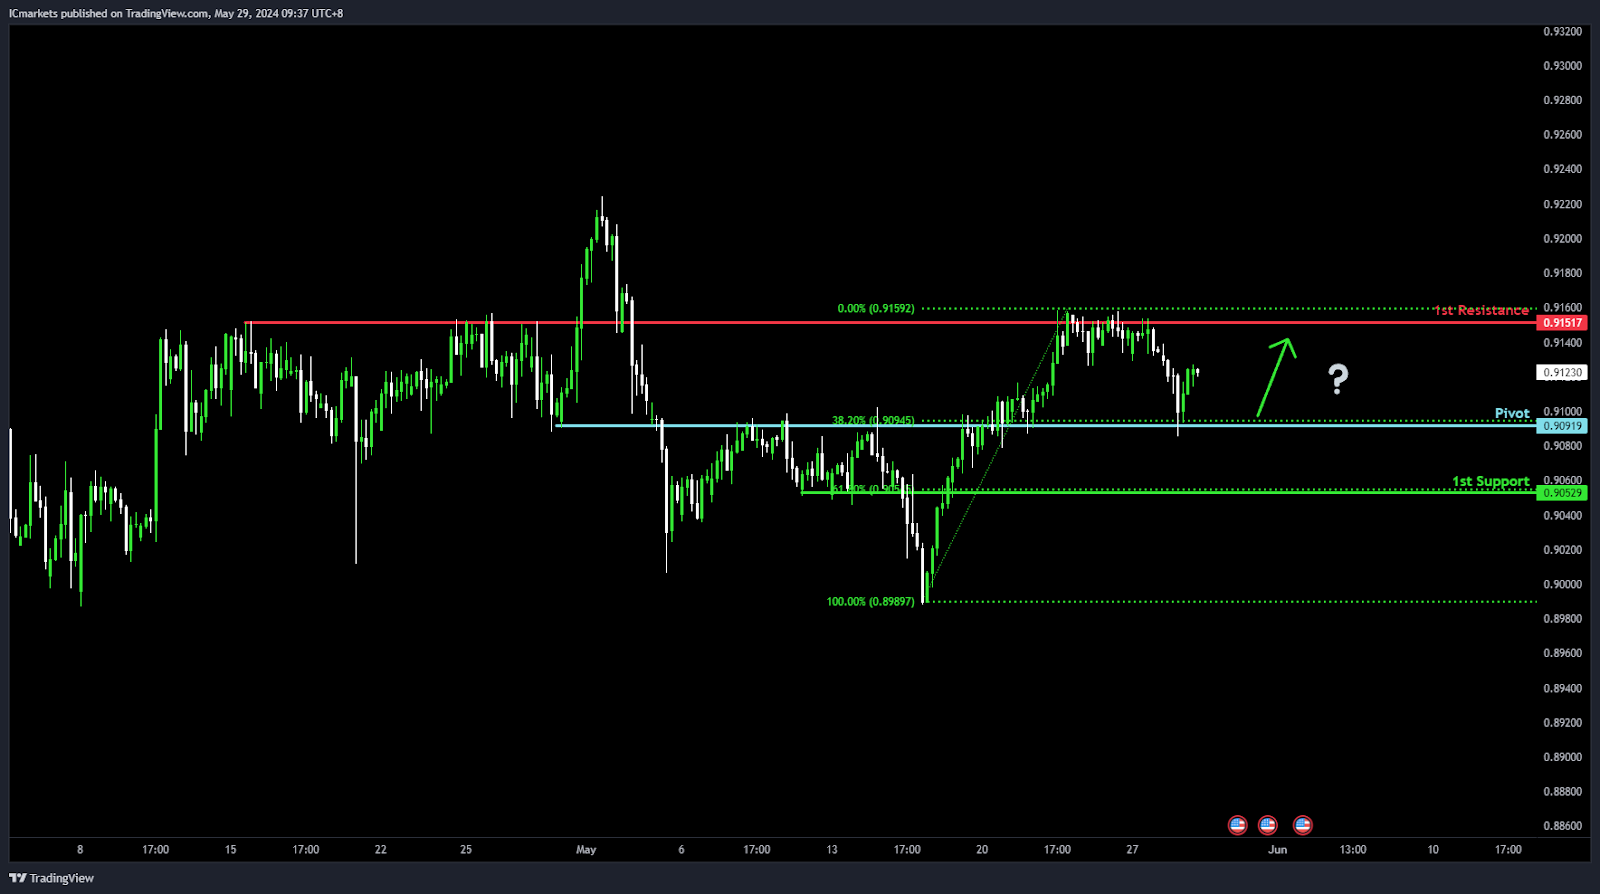
USD/CHF:
Potential Direction: Bullish
Overall momentum of the chart: Bullish
Price could potentially make a bullish continuation towards 1st resistance.
Pivot: 0.9091
Supporting reasons: Identified as an overlap support, coinciding with the 38.20% Fibonacci Retracement, suggesting a significant level where buying interest may emerge.
1st support: 0.9052
Supporting reasons: Recognized as an overlap support, indicating a historical level where buying interest has previously emerged, potentially acting as a level of support for price movement.
1st resistance: 0.9151
Supporting reasons: Noted as an overlap resistance, suggesting a level where selling pressure may intensify, potentially hindering further upward movement.
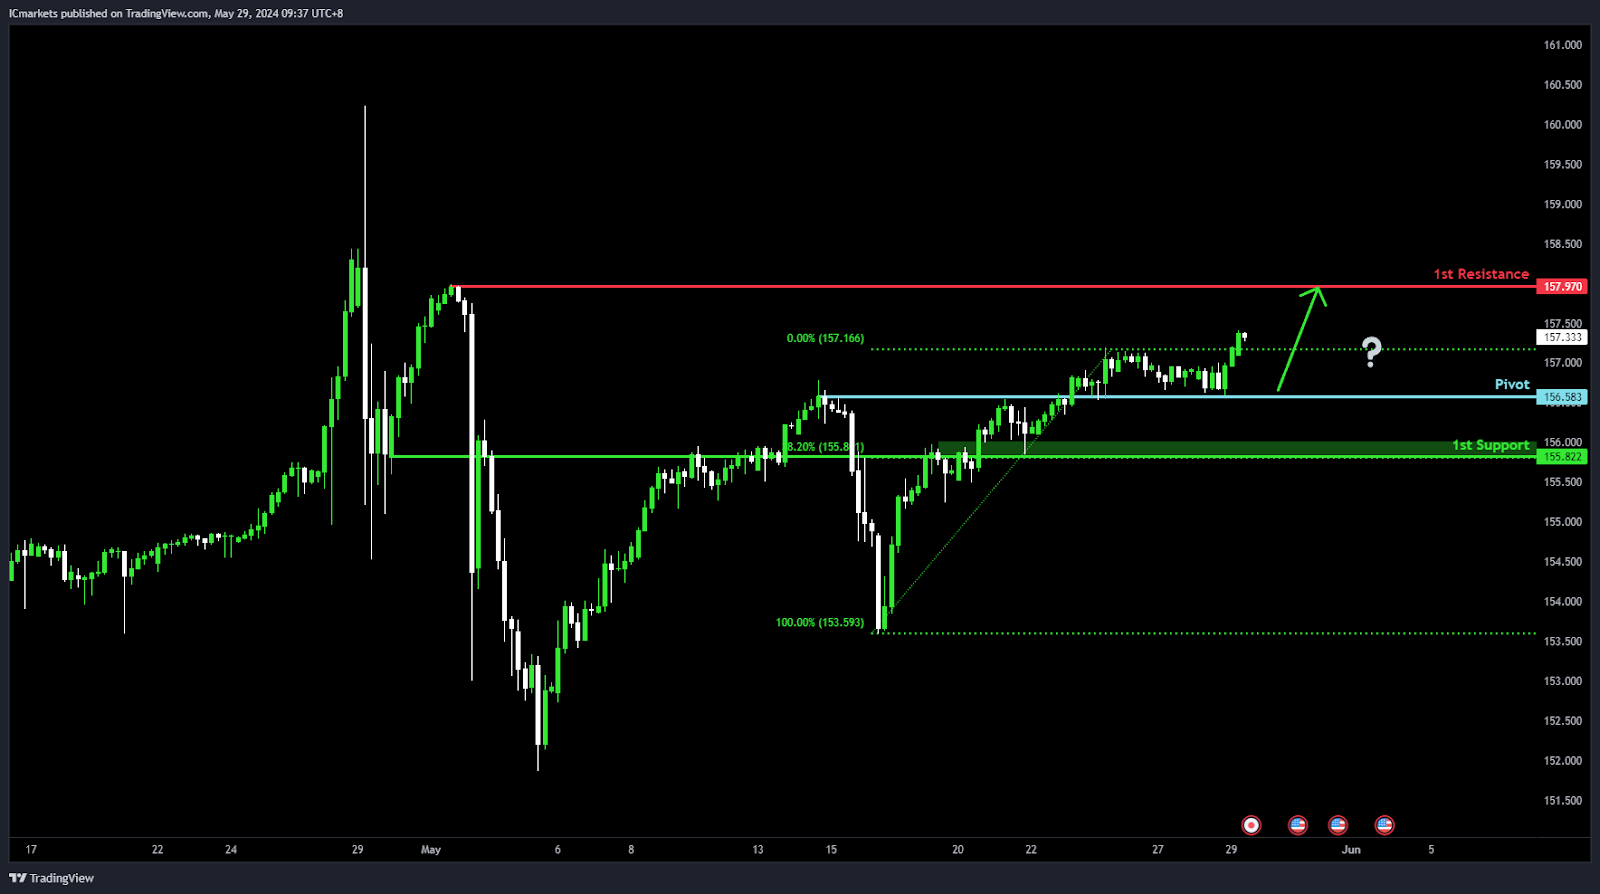
USD/JPY:
Potential Direction: Bullish
Overall momentum of the chart: Bullish
Price could potentially make a bullish bounce off pivot and head towards 1st resistance.
Pivot: 156.58
Supporting reasons: Identified as an overlap support, indicating a level where buying interest may emerge.
1st support: 155.82
Supporting reasons: Recognized as an overlap support, suggesting a historical level where buying interest has been significant. Additionally, it coincides with the 38.20% Fibonacci Retracement, reinforcing its potential significance as a support level.
1st resistance: 157.97
Supporting reasons: Noted as swing high resistance, indicating a significant level where selling pressure may intensify, potentially hindering further upward movement.
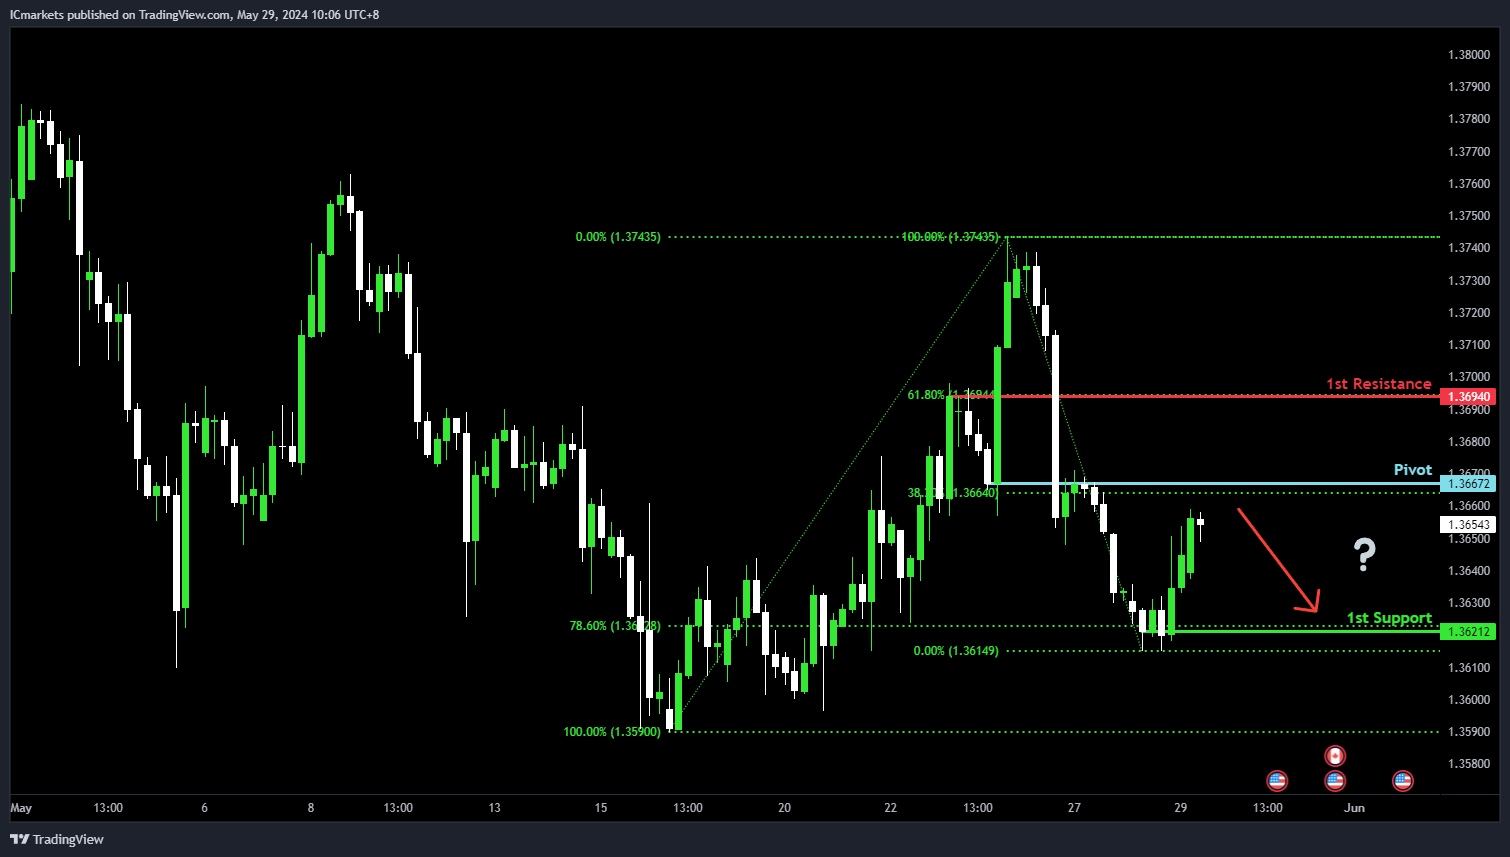
USD/CAD:
Potential Direction: Bearish
Overall momentum of the chart: Neutral
Price is rising towards the pivot and could potentially make a bearish reaction off this level to drop towards the 1st support.
Pivot: 1.3667
Supporting reasons: Identified as an overlap resistance that aligns close to the 38.2% Fibonacci retracement level, suggesting a significant area where selling pressures could intensify.
1st support: 1.3621
Supporting reasons: Identified as a pullback support that aligns with a 78.6% Fibonacci retracement level, suggesting an area where price could find strong buying interests to potentially halt any further downward movement.
1st resistance: 1.3694
Supporting reasons: Identified as a pullback resistance that aligns with a 61.8% Fibonacci retracement level, marking a significant barrier that could cap further upward movements.
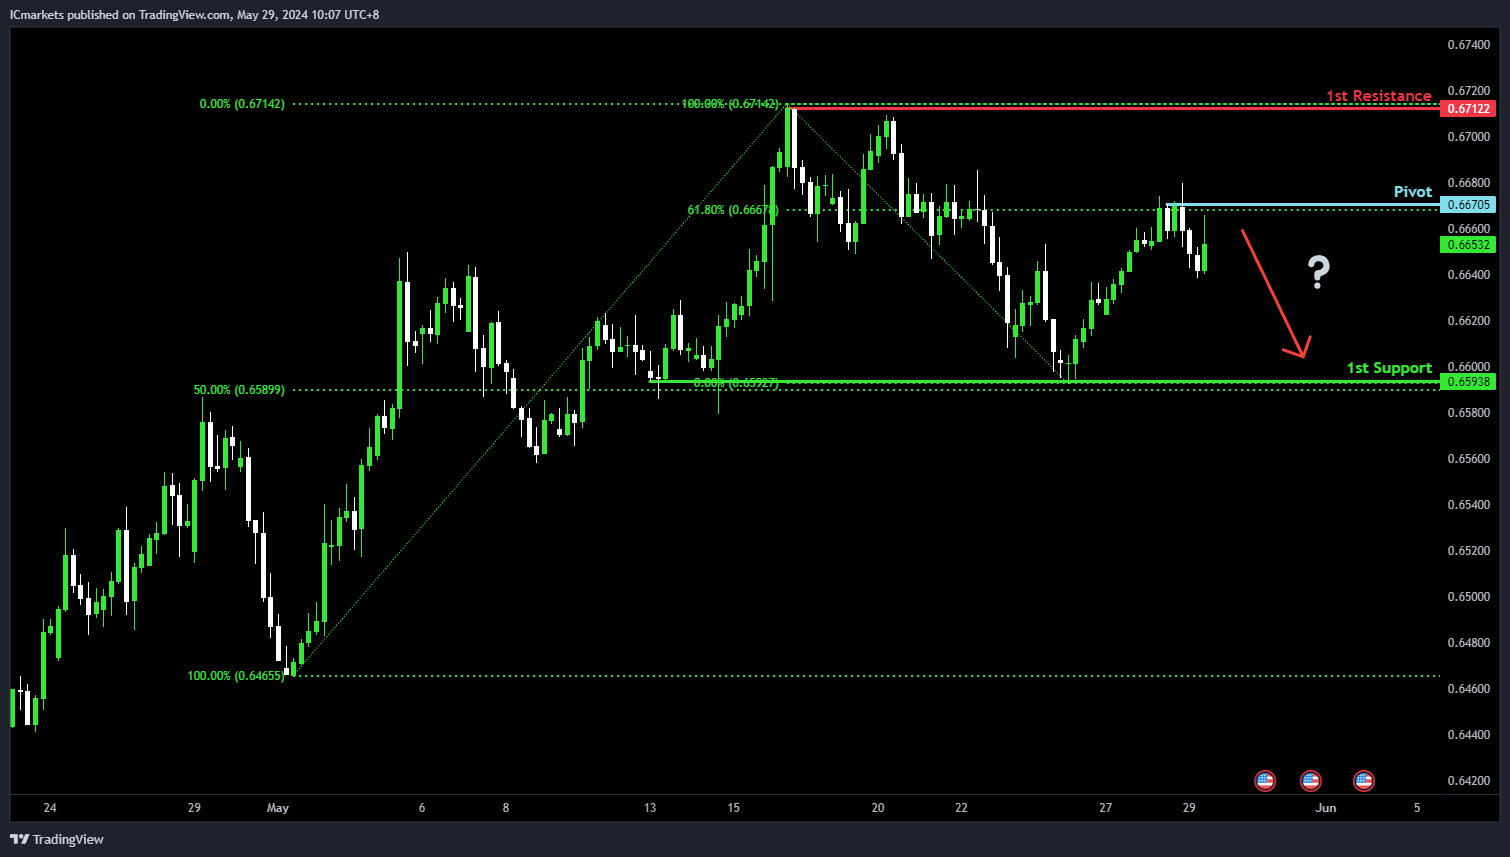
AUD/USD:
Potential Direction: Bearish
Overall momentum of the chart: Neutral
Price could rise towards the pivot and potentially make a bearish reaction off this level to drop towards the 1st support.
Pivot: 0.6670
Supporting reasons: Identified as pullback resistance that aligns with a 61.8% Fibonacci retracement level, suggesting an area where selling pressures have intensified recently.
1st support: 0.6593
Supporting reasons: Acts as a pullback support that aligns with a 50% Fibonacci retracement level, suggesting a significant area where price has found strong support in the past to provide a basis to halt further downward movement.
1st resistance: 0.6712
Supporting reasons: Identified as a pullback resistance, marking a barrier that has previously capped upward movements.
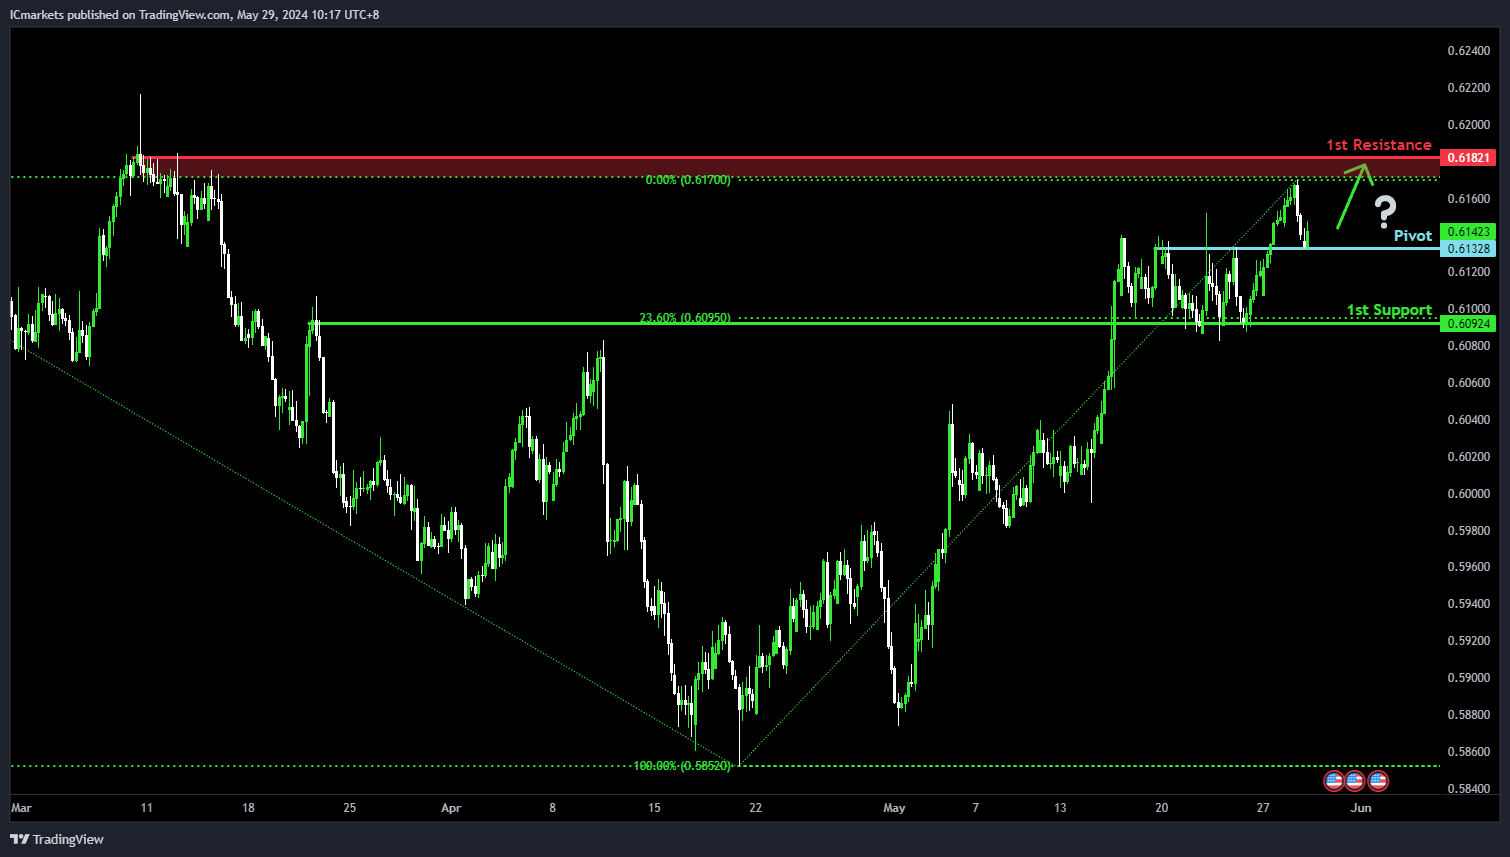
NZD/USD
Potential Direction: Bullish
Overall momentum of the chart: Bullish
Price has made a bullish reaction off the pivot and could potentially rise towards the 1st resistance.
Pivot: 0.6132
Supporting reasons: Identified as an overlap support, suggesting an area where buying interests have picked up recently.
1st support: 0.6092
Supporting reasons: Acts as an overlap support that aligns with a 23.6% Fibonacci retracement level, suggesting a potential area where price could find strong support to halt further downward movement.
1st resistance: 0.6182
Supporting reasons: Identified as a pullback resistance that aligns close to a 61.8% Fibonacci retracement level, marking a barrier that has previously capped upward movements.
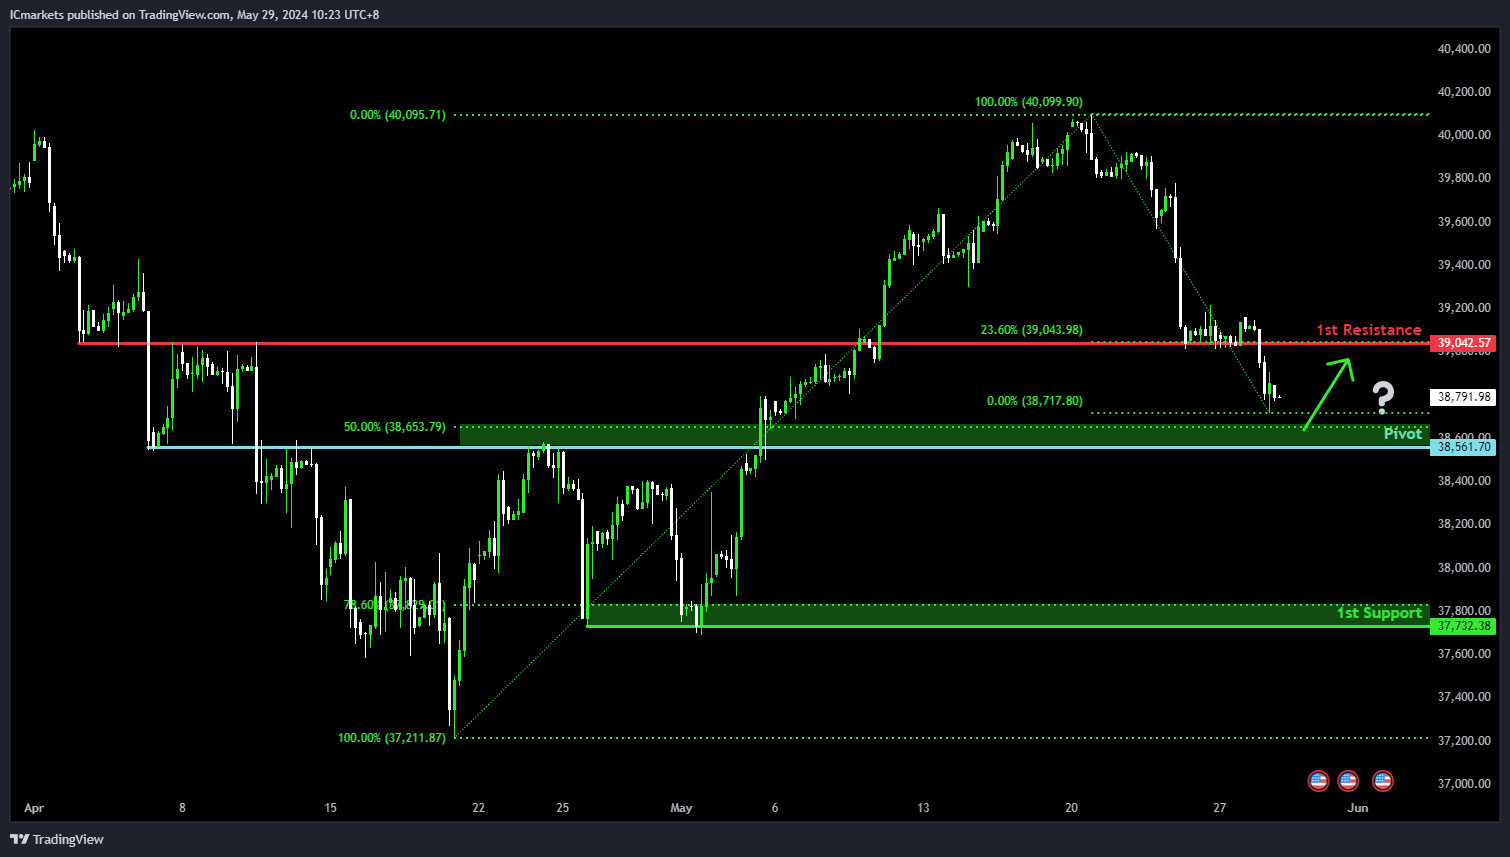
US30 (DJIA):
Potential Direction: Bullish
Overall momentum of the chart: Bearish
Price is falling towards the pivot and could potentially make a bullish reaction off this level to rise towards the 1st resistance.
Pivot: 38,561.70
Supporting reasons: Identified as an overlap support that aligns close to a 50% Fibonacci retracement level, suggesting an area where buying interests could pick up to stage a minor rebound.
1st support: 37,732.38
Supporting reasons: Identified as a pullback support that aligns close to a 78.6% Fibonacci retracement level, suggesting a significant area where price could find strong buying interests to provide a solid foundation to halt further downward movement.
1st resistance: 39,042.57
Supporting reasons: Identified as an overlap resistance that aligns with a 23.6% Fibonacci retracement level, indicating a potential barrier that could cap any upward movements.
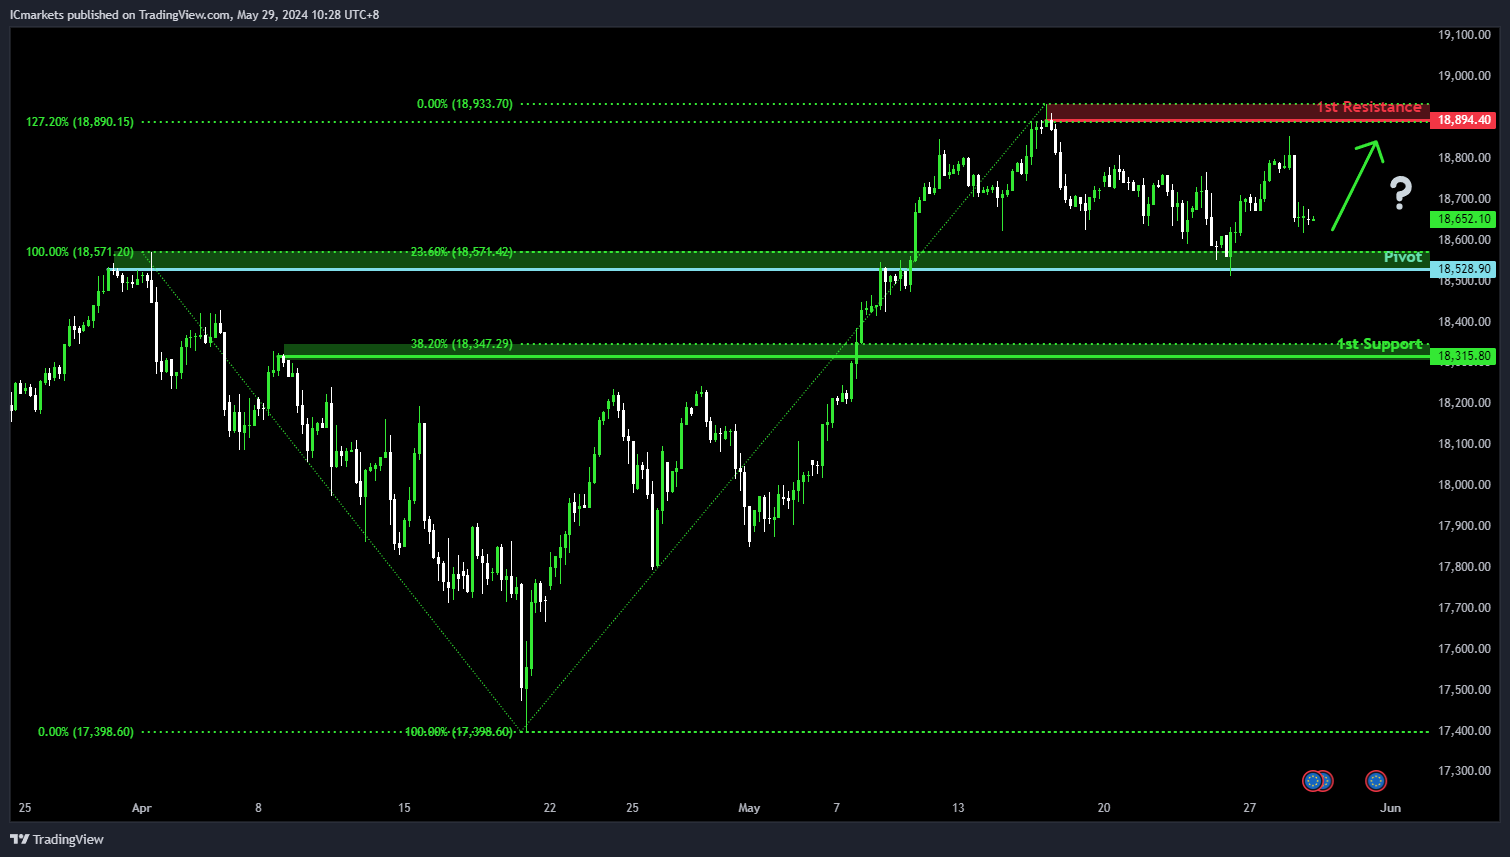
DE40 (DAX):
Potential Direction: Bullish
Overall momentum of the chart: Neutral
Price is falling towards the pivot and could potentially make a bullish reaction off this level to rise towards the 1st resistance.
Pivot: 18,528.90
Supporting reasons: Identified as an overlap support that aligns close to a 23.6% Fibonacci retracement level, suggesting an area where buying interests have picked up recently.
1st support: 18,315.80
Supporting reasons: Acts as a pullback support that aligns close to a 38.2% Fibonacci retracement level, suggesting an area where buying interests could pick up to halt further downward movement.
1st resistance: 18,894.40
Supporting reasons: Identified as a pullback resistance that aligns close to the all-time high, potentially functioning as a barrier that could cap any upward movements.
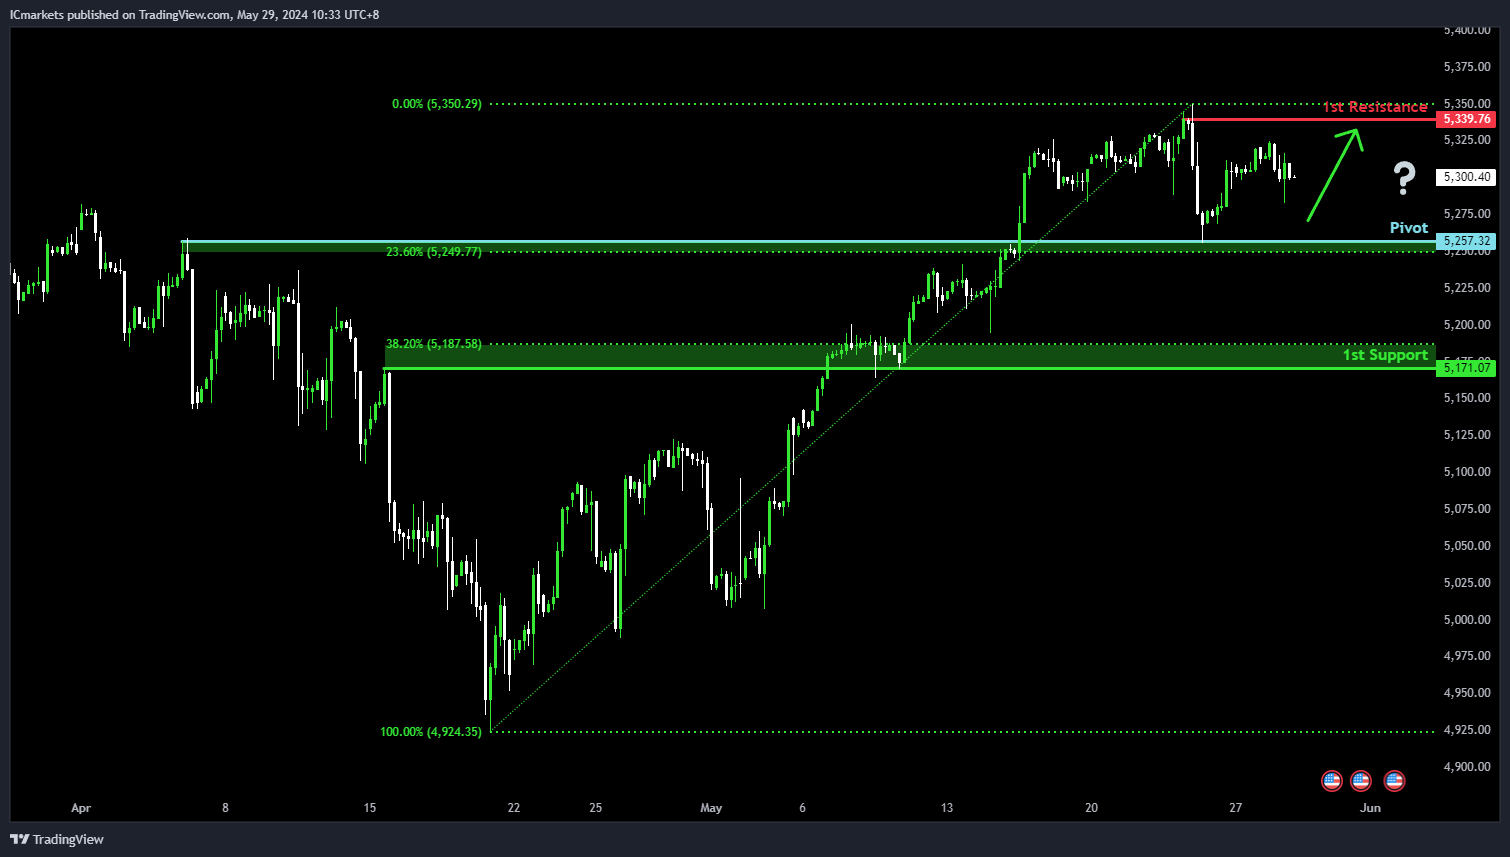
US500 (S&P 500):
Potential Direction: Bullish
Overall momentum of the chart: Neutral
Price is falling towards the pivot and could potentially make a bullish reaction off this level to rise towards the 1st resistance.
Pivot: 5,257.32
Supporting reasons: Identified as an overlap support that aligns close to a 23.6% Fibonacci retracement level, suggesting an area where buying interests have picked up recently.
1st support: 5,171.07
Supporting reasons: Acts as an overlap support that aligns close to a 38.2% Fibonacci retracement level, suggesting a significant area where price could find strong buying interests to provide a solid foundation to halt further downward movement.
1st resistance: 5,339.76
Supporting reasons: Acts as a pullback resistance that aligns close to the all-time high, suggesting a significant area where selling pressures could intensify.
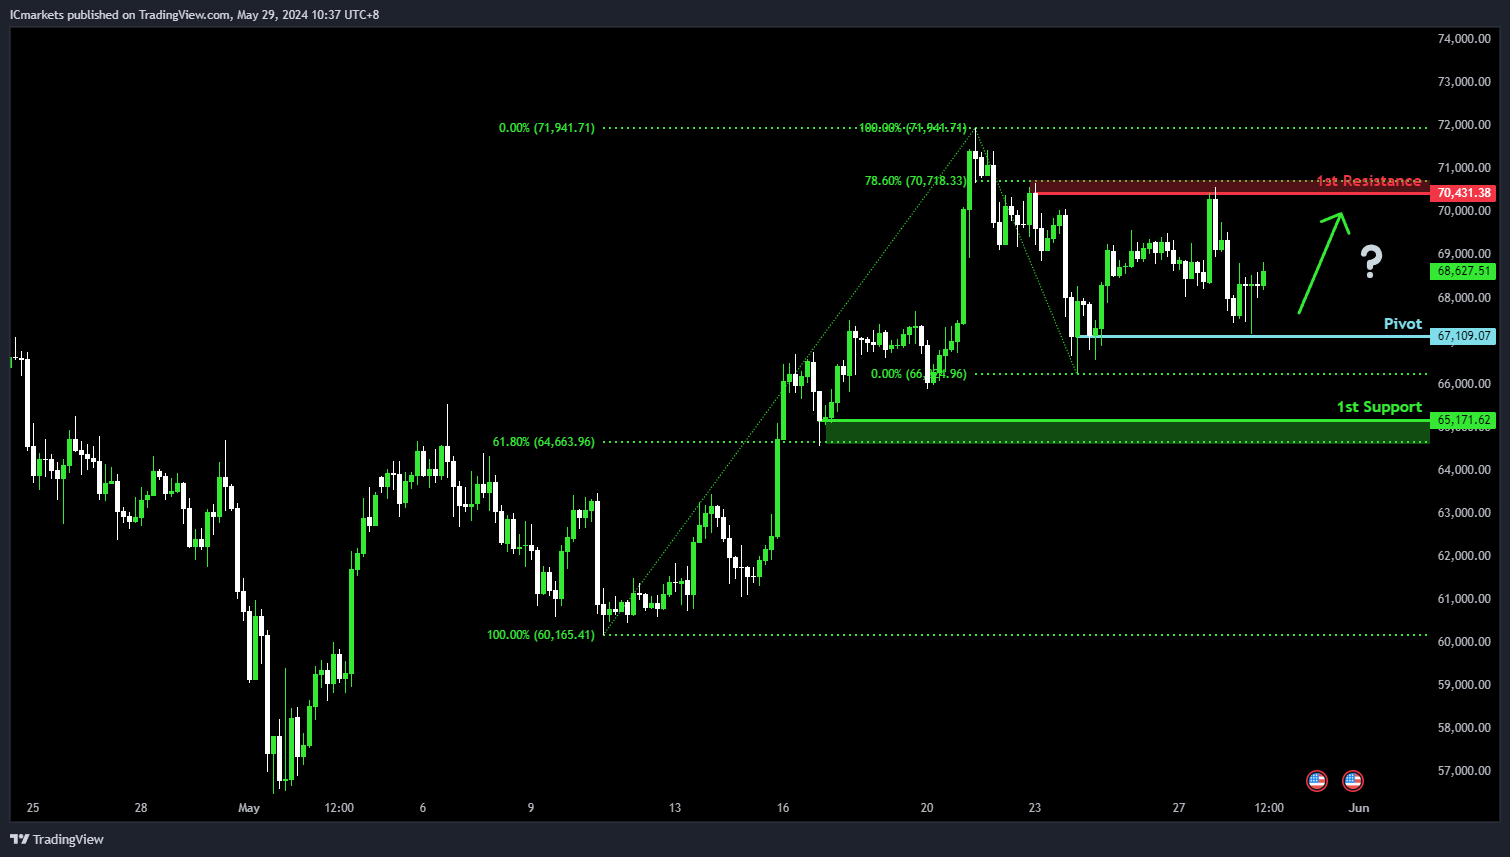
BTC/USD (Bitcoin):
Potential Direction: Bullish
Overall momentum of the chart: Neutral
Price has made a bullish reaction off the pivot and could potentially rise towards the 1st resistance.
Pivot: 67,109.07
Supporting reasons: Identified as a pullback support, suggesting an area where buying interests could pick up and stage a rebound in price.
1st support: 65,171.62
Supporting reasons: Acts as a pullback support that aligns close to a 61.8% Fibonacci retracement level, suggesting an area where buying interests could pick up to halt further downward movements.
1st resistance: 70,431.38
Supporting reasons: Marked by a pullback resistance that aligns close to a 78.6% Fibonacci retracement level, indicating a significant barrier that could cap further upward movements.
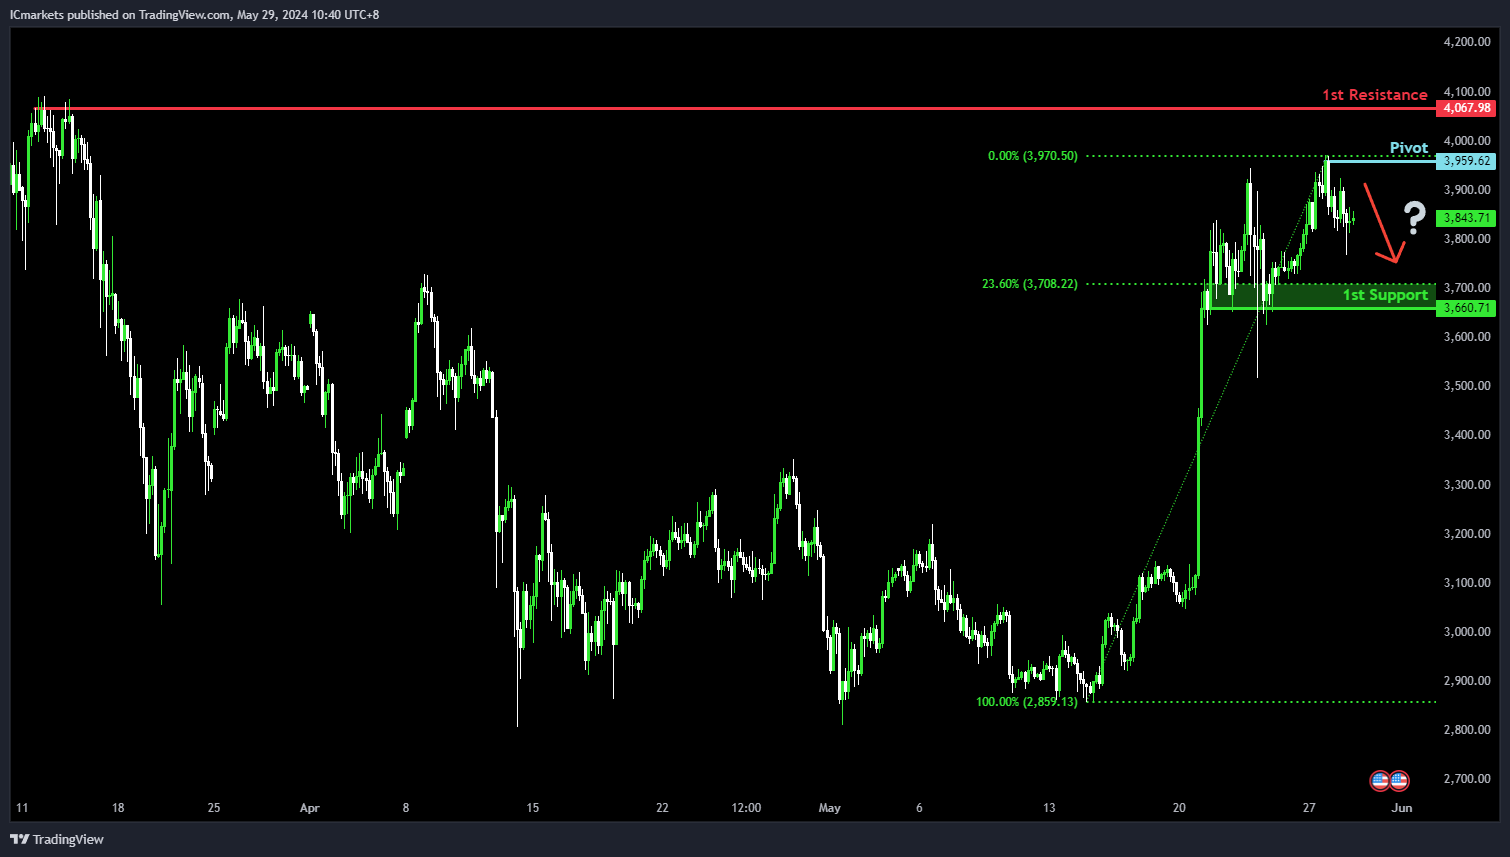
ETH/USD (Ethereum):
Potential Direction: Bearish
Overall momentum of the chart: Neutral
Price is rising towards the pivot and could potentially make a bearish reaction off this level to drop towards the 1st support.
Pivot: 3,959.62
Supporting reasons: Identified as a pullback resistance, suggesting an area where selling pressures could intensify.
1st support: 3,660.71
Supporting reasons: Identified as a pullback support that aligns with a 23.6% Fibonacci retracement level, suggesting a significant area which could provide a strong foundation to halt further downward movements.
1st resistance: 4,067.98
Supporting reasons: Identified as a sewing-high resistance, marking a significant barrier that could cap further upward movements.
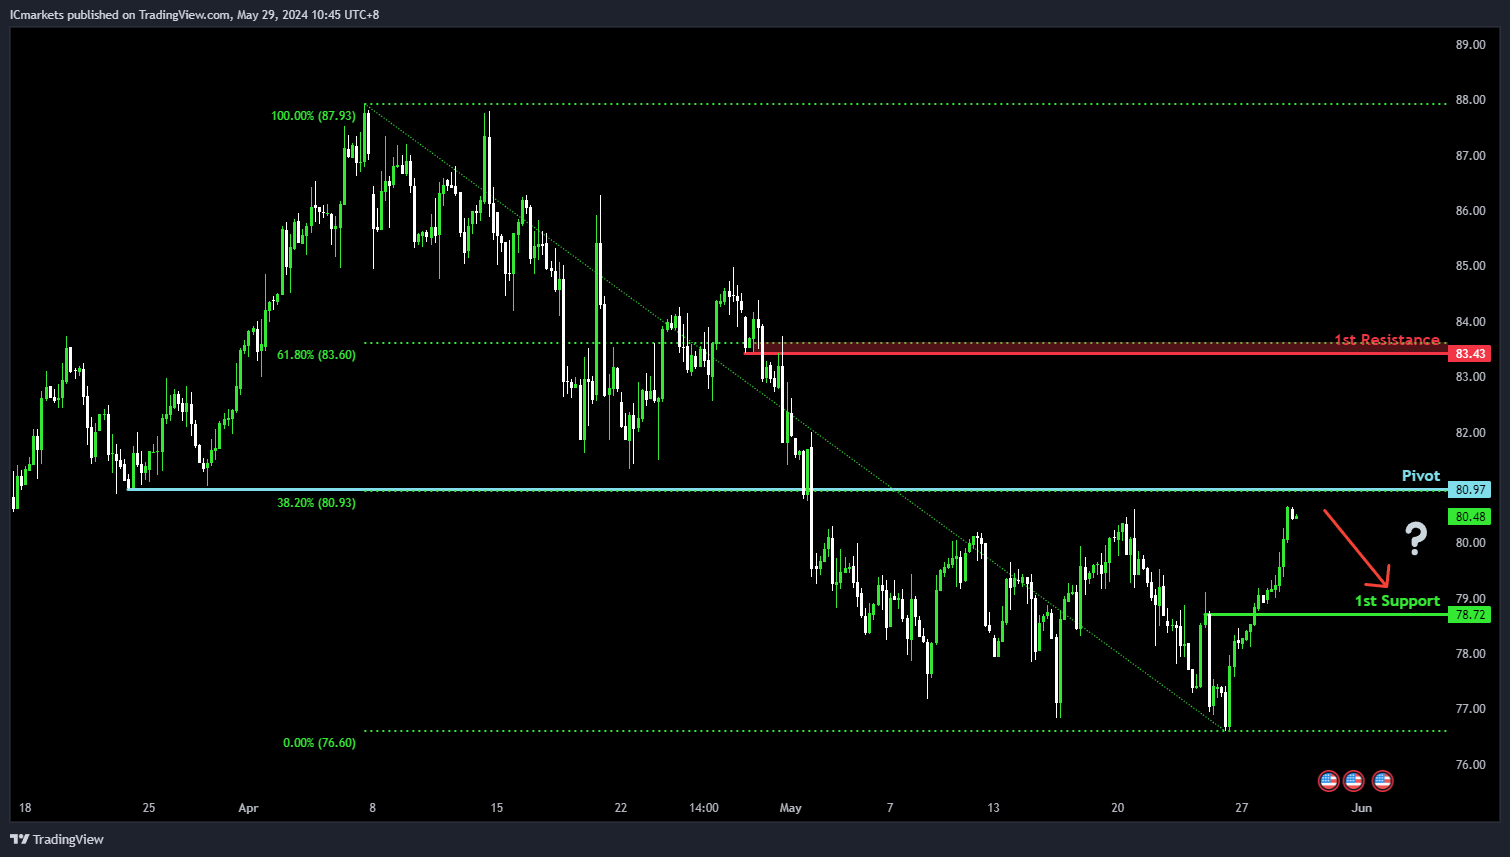
WTI/USD (Oil):
Potential Direction: Bearish
Overall momentum of the chart: Neutral
Price is rising towards the pivot and could potentially make a bearish reaction off this level to drop towards the 1st support.
Pivot: 80.97
Supporting reasons: Identified as a pullback resistance that aligns with a 38.2% Fibonacci retracement level, suggesting an area where selling pressures could intensify.
1st support: 78.72
Supporting reasons: Identified as a pullback support, suggesting a significant area where price could find strong buying interests and provide a solid foundation to halt further downward movements.
1st resistance: 83.43
Supporting reasons: Identified as an overlap resistance that aligns close to a 61.8% Fibonacci retracement level, marking a significant barrier that could cap further upward movements.
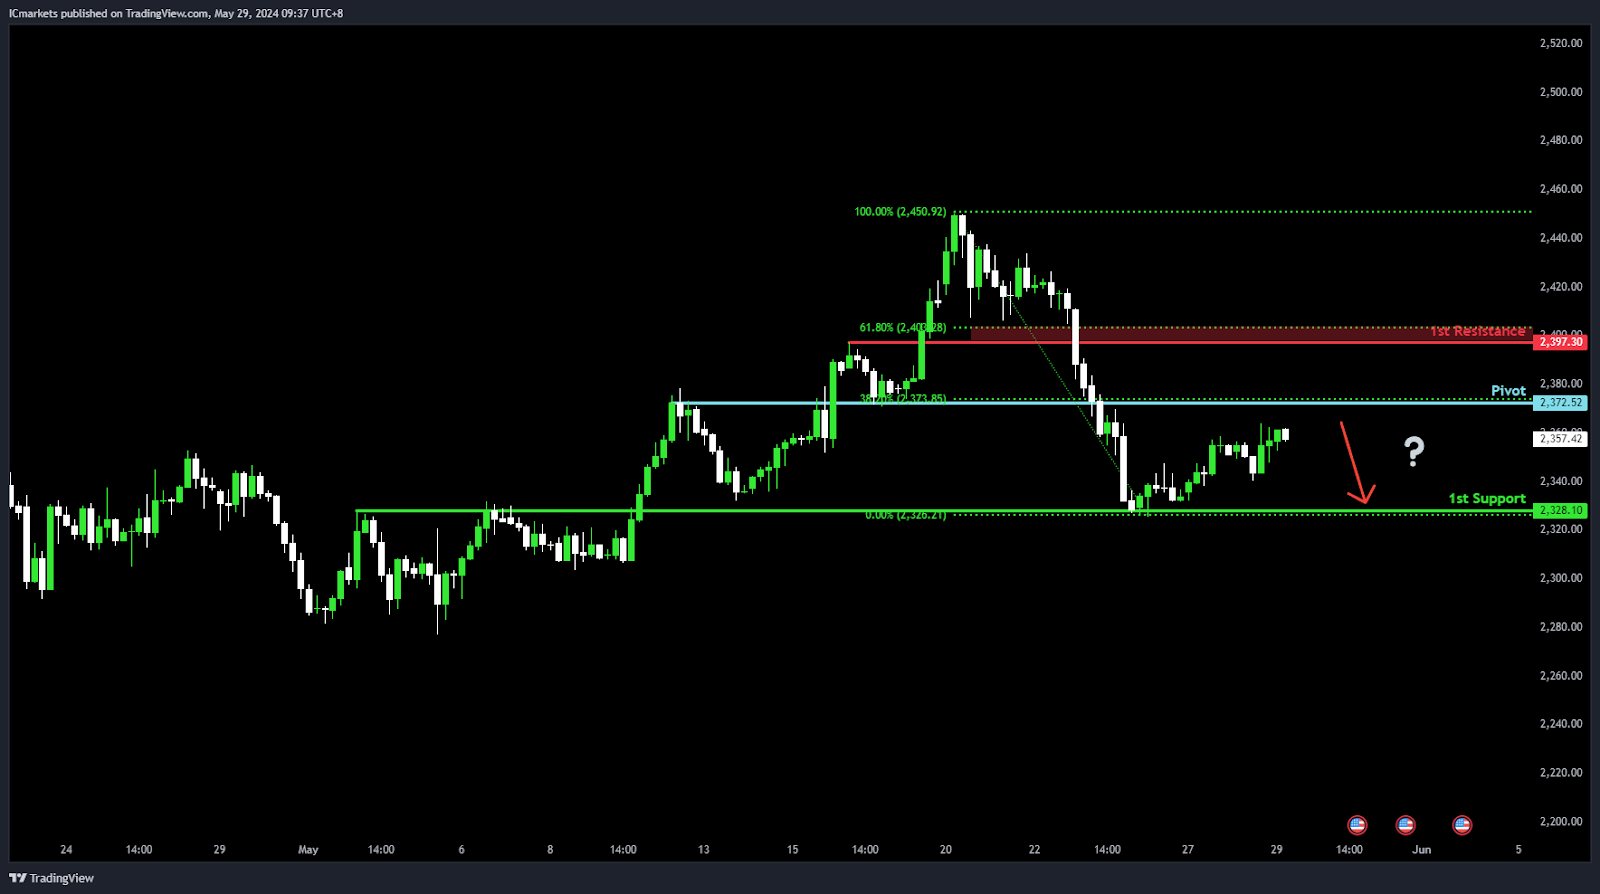
XAU/USD (GOLD):
Potential Direction: Bearish
Overall momentum of the chart: Bearish
Price could potentially make a bearish reaction off pivot and drop to 1st support.
Pivot: 2372.00
Supporting reasons: Identified as pullback resistance, indicating a level where selling pressure may intensify. It coincides with the 38.20% Fibonacci Retracement, suggesting a significant area where bears may take control.
1st support: 2328.10
Supporting reasons: Recognized as an overlap support, indicating a historical level where buying interest has emerged. This level may act as a support zone for price movement.
1st resistance: 2397.30
Supporting reasons: Noted as pullback resistance, suggesting a level where selling pressure may increase. It coincides with the 61.80% Fibonacci level, reinforcing its potential significance as a resistance level.
The accuracy, completeness and timeliness of the information contained on this site cannot be guaranteed. IC Markets does not warranty, guarantee or make any representations, or assume any liability regarding financial results based on the use of the information in the site.
News, views, opinions, recommendations and other information obtained from sources outside of www.icmarkets.com.au, used in this site are believed to be reliable, but we cannot guarantee their accuracy or completeness. All such information is subject to change at any time without notice. IC Markets assumes no responsibility for the content of any linked site.
The fact that such links may exist does not indicate approval or endorsement of any material contained on any linked site. IC Markets is not liable for any harm caused by the transmission, through accessing the services or information on this site, of a computer virus, or other computer code or programming device that might be used to access, delete, damage, disable, disrupt or otherwise impede in any manner, the operation of the site or of any user’s software, hardware, data or property.


