EUR/USD:
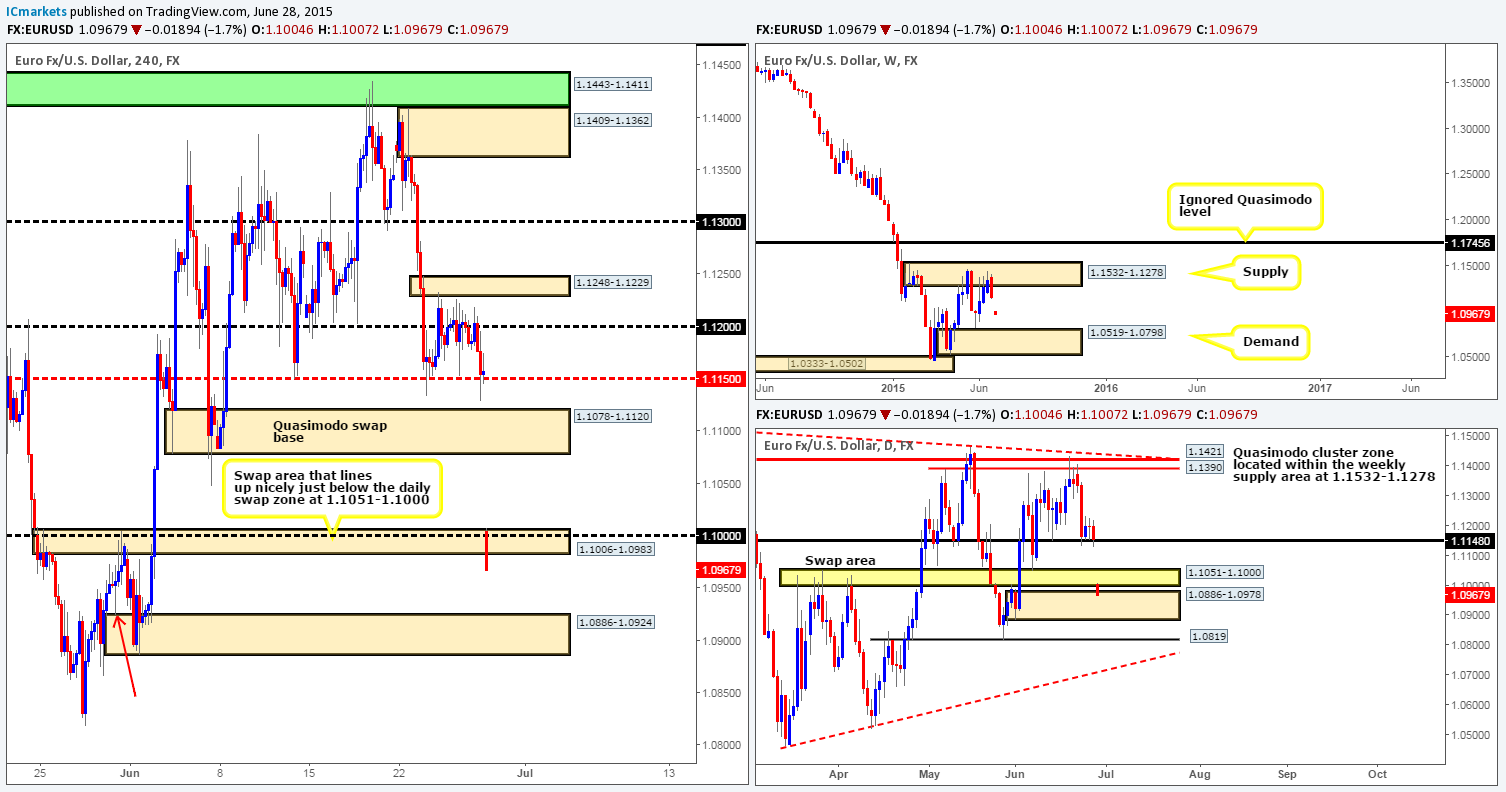
Weekly view – Last week saw the EUR/USD react bearishly from weekly supply at 1.1532-1.1278, consequently forming a bearish engulfing candle into the close 1.1157 and wiping out any gains accumulated the week before. Trade opened 153 pips lower this morning at 1.1004, which, in our opinion, could potentially fuel a further decline this week down towards weekly demand at 1.0519-1.0798.
Overall, the trend on this pair is still pointing south, and as far as we can see, it will remain this way until a convincing push above the current weekly supply area takes place.
Daily view: From Wednesday onwards last week, price was seen resting on top of a daily swap level coming in at 1.1148. We also reported in Friday’s analysis that we believed bids to be weak at this level going into the weekend. As you can see, the weekend gap saw price dive lower, taking out a daily swap area at 1.1051-1.1000, and connecting with a daily demand area seen at 1.0886-1.0978.
4hr view: Fuelled by the growing political uncertainty in Greece, the 4hr timeframe saw price gap below a 4hr Quasimodo support base at 1.1078-1.1120, and effortlessly pierce a 4hr swap area at 1.1006-1.0983 (positioned just above the aforementioned daily demand area). Technically, the push below this 4hr swap area has likely opened up the gates to further downside towards the 4hr demand area at 1.0886-1.0924, which if you look closely is also a 4hr Quasimodo support level too (note the red arrow pointing to the left shoulder at 1.0924).
Although price is currently shaking hands with daily demand at 1.0886-1.0978 at the moment, we feel there is a good chance this market will see further downside today (a gap-fill is unlikely in our view) and possibly into the week, as the weekly scale shows no significant support until around the 1.0800 region (just above the aforementioned weekly demand area).
Assuming we get some sort of pullback either to the 1.1000 handle or the recently broken 4hr Quasimodo base today/into the week, we’ll look to enter short with lower timeframe confirmation. Targets from 1.1000 would simply be the 4hr demand area at 1.0886-1.0924. Targets for any shorts taken at the underside of the aforementioned 4hr Quasimodo base would be dependent on how price approached this area.
Levels to watch/live orders:
- Buys: Flat (Stop loss: N/A).
- Sells: 1.1000 [Tentative – confirmation required] (Stop loss: dependent on where one confirms this level) 1.1078-1.1120 [Tentative – confirmation required] (Stop loss: dependent on where one confirms this area).
GBP/USD:
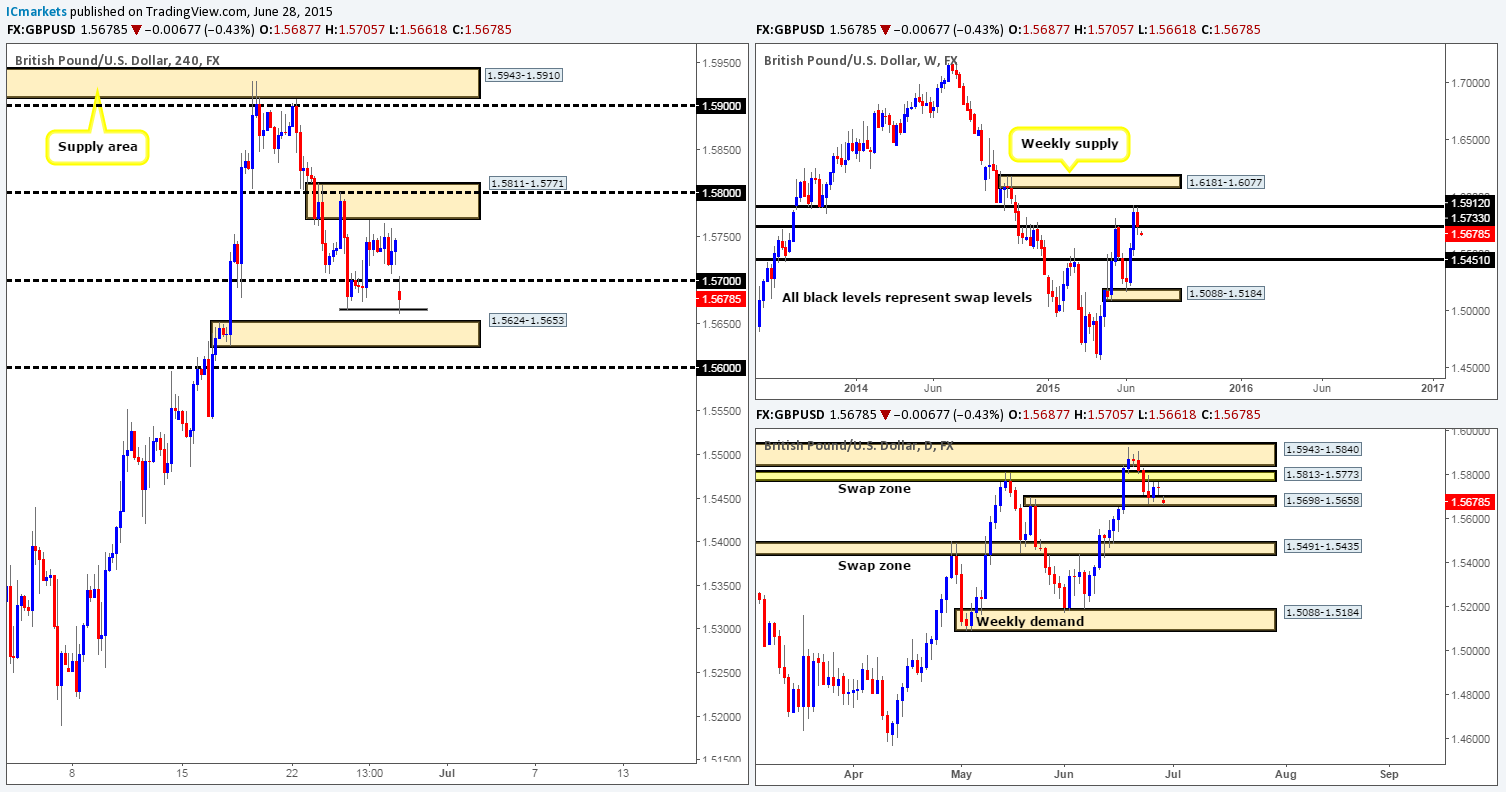
Weekly view – From the weekly timeframe, we can see that the GBP depreciated 120 pips in value last week from the underside of a weekly swap level coming in at 1.5912. This, as you can see, forced price to cross swords with 1.5733 – another weekly swap level. Despite this, trade opened 60 pips lower this morning at 1.5687, consequently pushing price below this weekly swap level. If the sellers manage to hold out below this barrier this week, it is likely the GBP would continue to sell off down to at least the 1.5451 region.
Daily view: The weekend gap has forced price back down into a daily swap area at 1.5698-1.5658 (located just below the weekly swap level mentioned above at 1.5733). It is clear to see from this timeframe that in order for further selling to be seen on the weekly timeframe, this daily swap area will need to be taken out before. It will be interesting to see what the 4hr timeframe has to say about this…
4hr view: The 4hr timeframe shows that the weekend gap forced the buyers and sellers into an immediate battle for position between 1.5700 and Wednesday’s low 1.5666. From where we’re standing, we believe a possible gap-fill is possible today, and If 1.5700 is broken and holds as support; there could be a potential intraday long opportunity (as long as lower timeframe confirmation is present) up to the 4hr supply/round number area at 1.5811-1.5771/1.5800 (positioned within the daily swap area mentioned above at 1.5813-1.5773).
With regards to selling, our team has very little interest in shorting this market until we see both the 4hr demand area at 1.5624-1.5653 and the round number seen just below it at 1.5600 taken out (this would also clear out the daily swap area at 1.5698-1.5658 as well).
Therefore, unless we see a very clear break above and retest of 1.5700, or a clean swoop below 1.5600, we’ll likely remain flat in this market.
Levels to watch/ live orders:
- Buys: Flat (Stop loss: N/A).
- Sells: Flat (Stop loss: N/A).
AUD/USD:
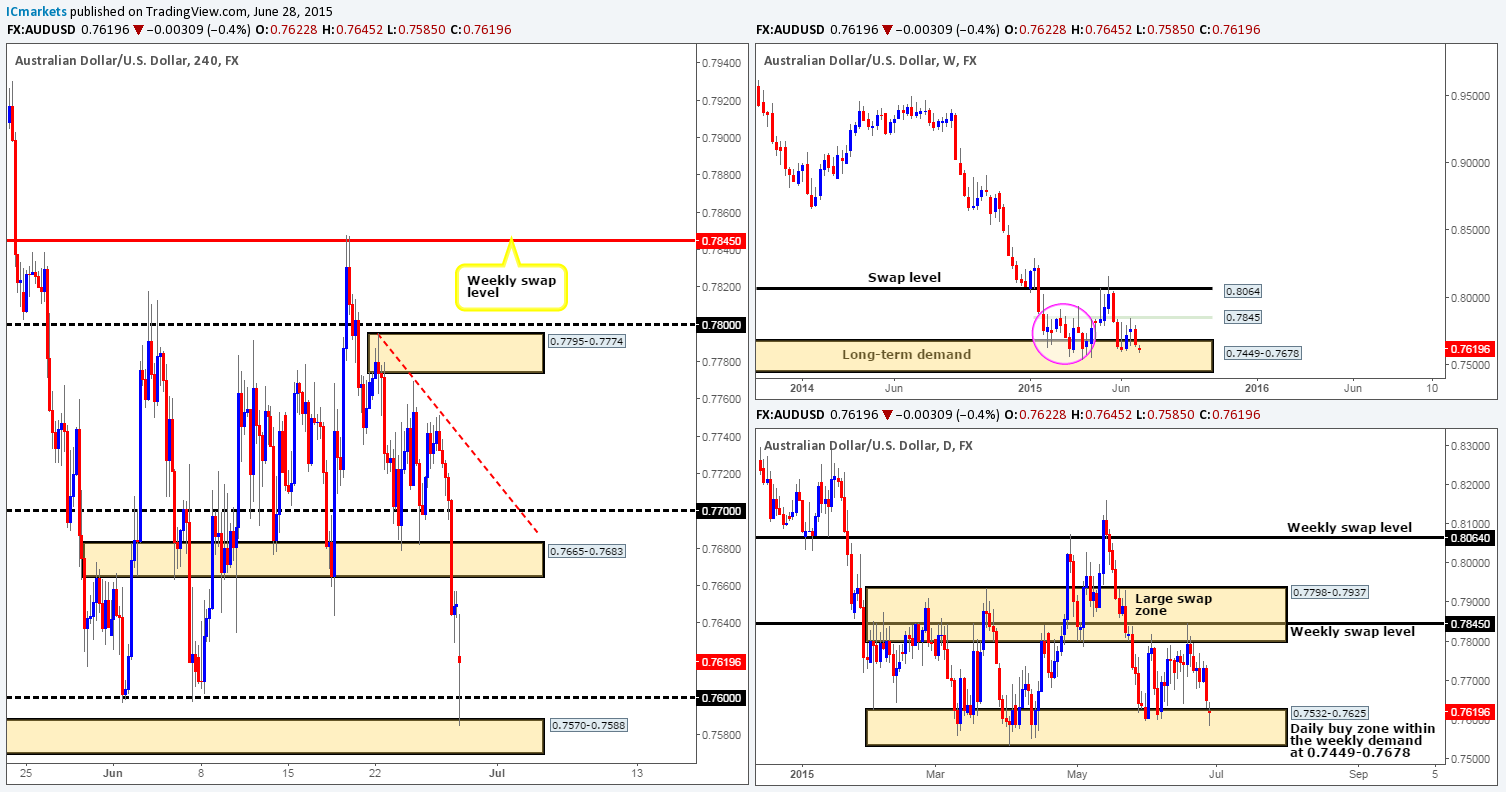
Weekly view – The weekly timeframe shows that the AUD/USD remains capped between a long-term weekly demand area at 0.7449-0.7678 and a minor weekly swap level seen at 0.7845. Judging by the sloppy reaction seen (pink circle – 02/02/15-06/04/15) between these two aforementioned weekly areas a few months ago though, things could potentially get messy here again before we see any decisive move take place. From a long-term perspective, nonetheless, the trend direction on this pair is still very much south in our opinion, and will remain this way until we see a convincing break above 0.8064.
Daily view: From the daily timeframe, it is clear that price has entered into a phase of consolidation between 0.7798-0.7937 (a large daily swap zone that surrounds the aforementioned weekly swap level), and 0.7551-0.7624 (a daily demand area that is located within the aforementioned weekly demand zone). However, with the open stretching price 30 pips south this morning (barely noticeable on the weekly scale) into the jaws of the lower limits of the current daily range, anyone considering taking shorts today/this week may want to take a note of this.
4hr view: For those who read Friday’s report on this pair, you may recall us mentioning to watch for the break of an ascending 15 minute trendline extended from the low 0.7722, which formed at the underside of a 4hr downtrend line taken from the high 0.7795. If you check out the 15 minute timeframe, there was a picture-perfect sell signal on the break and retest of this 15 minute beauty. Unfortunately for us though, we were not at our desks, well done to anyone who managed to catch this move as the selloff was brutal going into Friday’s close 0.7650.
The weekend gap, as you can see has forced price to fake below 0.7600 into a small, yet clearly resilient 4hr demand area at 0.7570-0.7588, which should not really come as much of a surprise considering that this 4hr demand zone is sitting within both weekly and daily demand (see above). Entering long on the basis of this upside momentum is not something our team would be comfortable taking part in without lower timeframe confirmation also being present. With that, our objective today is simple, watch how the lower timeframe price action behaves going into the more liquid sessions today, as from the higher timeframe picture, it looks as though we may see a rally higher take place this week.
Levels to watch/ live orders:
- Buys: 0.7570-0.7588 region [Tentative – confirmation required] (Stop loss: 0.7566).
- Sells: Flat (Stop loss: N/A).
USD/JPY:
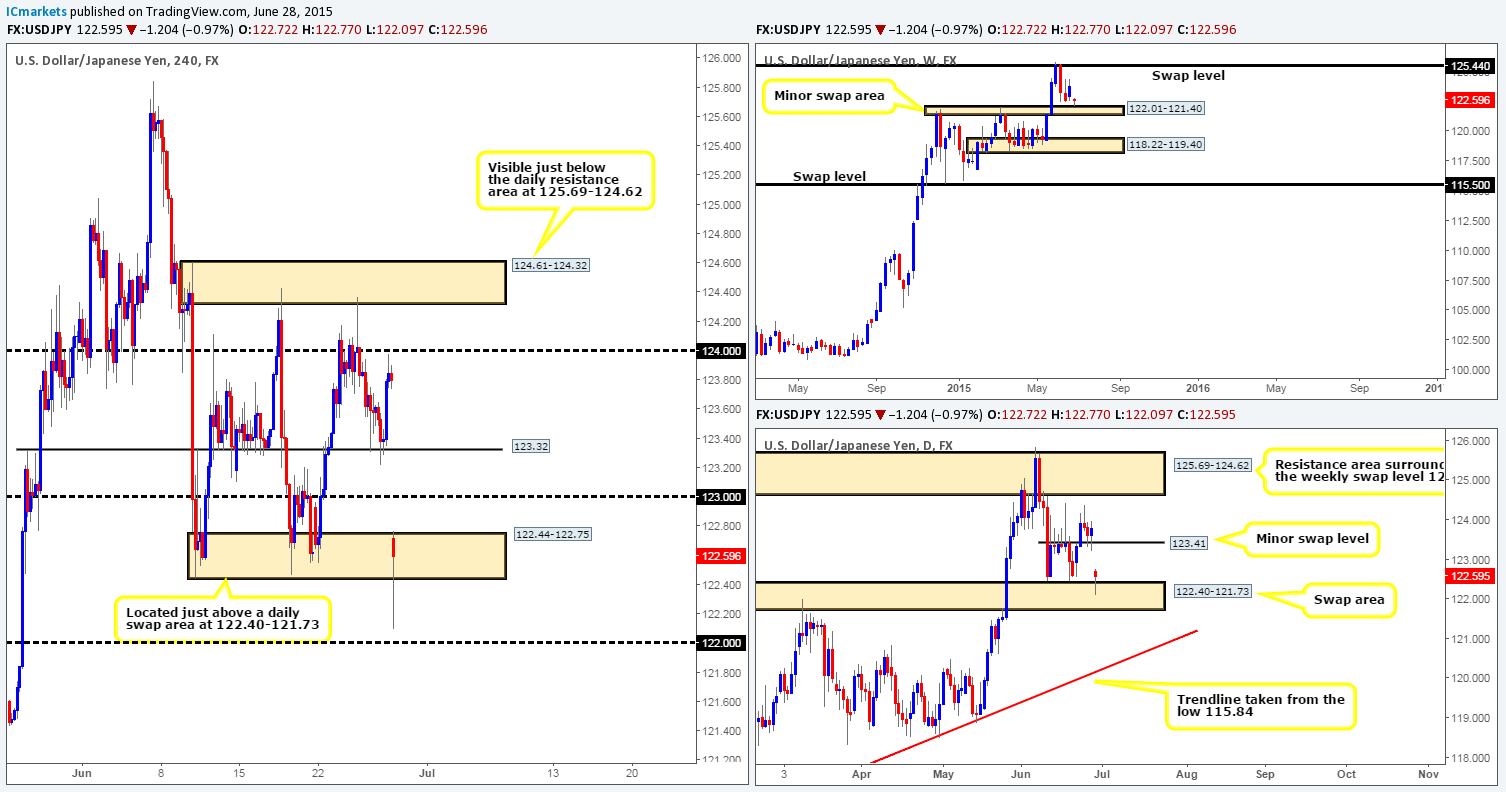
Weekly view – Last week’s action saw price remain within the confines of the weekly swap level 125.44 and a weekly swap area coming in at 122.01-121.40. The open 122.72, however, saw price gap south a little over 100 pips, which as a consequence placed price within touching distance of the aforementioned weekly swap area. From a long-term perspective, nonetheless, the uptrend on this pair is still very much intact, and will remain this way in our opinion until the weekly swap level 115.50 is consumed.
Daily view: Bids around the minor daily swap level at 123.41 were clearly strong enough to hold the market higher on Thursday and Friday. However, the rather vicious gap this morning put a stop to this, pushing price down into a daily swap area at 122.40-121.73 (located just above the aforementioned minor weekly swap area).
4hr view: From the 4hr timeframe, we can see that this morning’s gap has forced price to viciously spike below a 4hr demand area at 122.44-122.75, which missed connecting with the 122.00 handle by about 10 pips.
Considering the market’s position on the higher timeframes (see above in bold) at the moment, it is likely this market will continue north today and possibly into the week filling gap. With that being said, we would not feel comfortable entering long here until there is clear lower timeframe confirmation from either the 15 or 30 minute timeframe. In the event there is a respectable entry seen, the first trouble area for us would be around the 123.00 handle. This could be a good place to take partial profits. Our next area of interest sits just above at 123.32 – a 4hr swap level. It would be here that we’d likely take off most of our position due to it being a proven area of support and resistance in the past.
Levels to watch/ live orders:
- Buys: 122.44-122.75 [Tentative – confirmation required] (Stop loss: dependent on where one confirms this area).
- Sells: Flat (Stop loss: N/A).
USD/CAD:
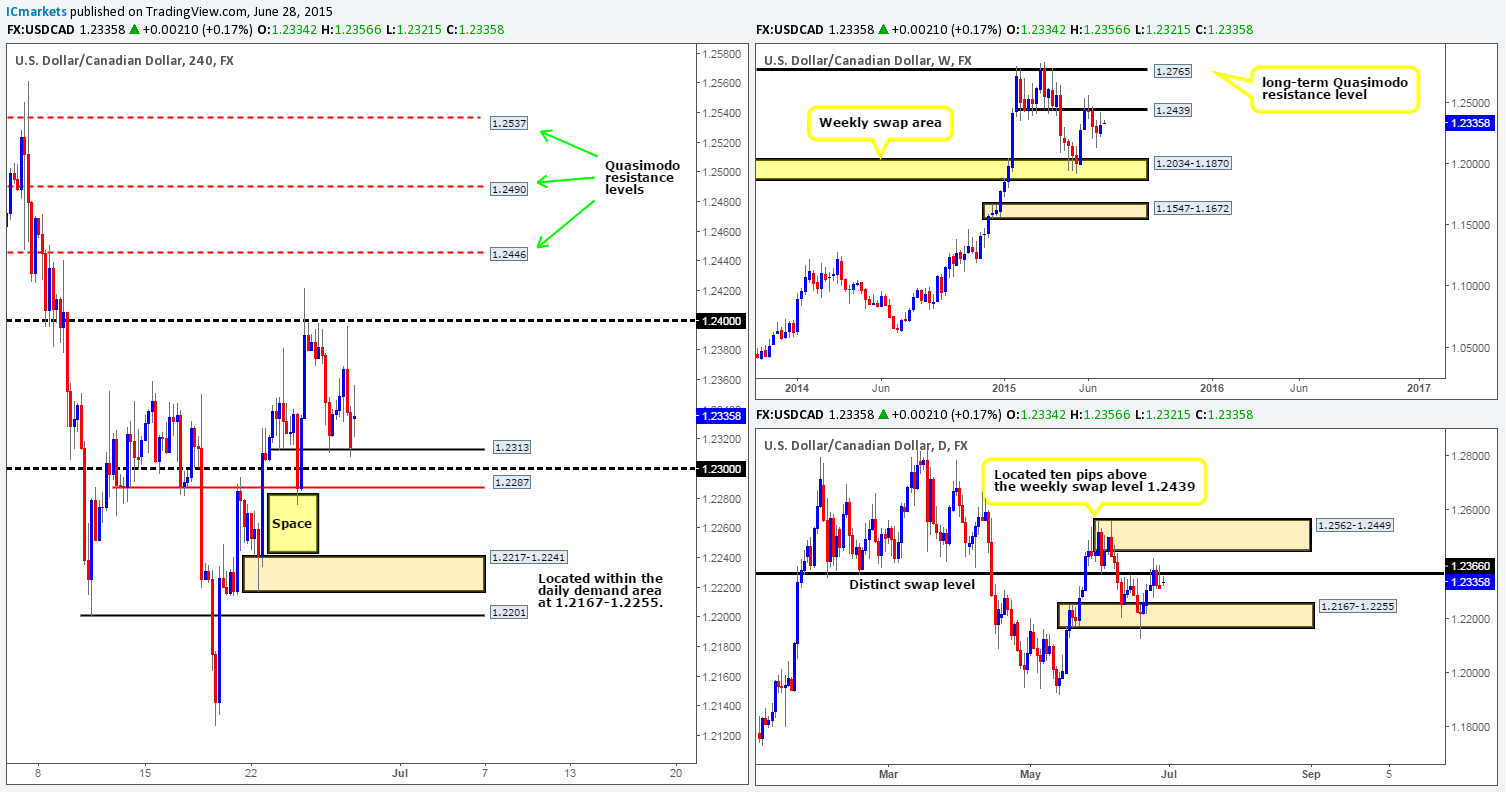
Weekly view – Price sold off from just below a clear weekly swap level at 1.2439 last week, consequently forming an average-looking bearish pin-bar candle going into the close at 1.2314. Despite this, our long-term bias on this pair remains long, and it will only be once/if we see a break below the weekly swap area at 1.2034-1.1870 would our present bias likely shift.
Daily view: Wednesday through to Friday saw price action oscillate around a very obvious daily swap level coming in at 1.2366. A continuation move south from here would likely place price back within daily demand at 1.2167-1.2255. Conversely, a move higher could potentially push this market into the jaws of a daily supply area seen at 1.2562-1.2449 (located ten pips above the aforementioned weekly swap level).
4hr view: From the 4hr scale, we can see that price closed up for the week testing a very minor 4hr support level seen at 1.2313. Bids were clearly strong around this level as trade opened 20 pips higher this morning at 1.2334.
Buying on the basis of this alone is not really something we’d stamp high probability. Ultimately we’d like to see price decline in value and reconnect with 1.2312, thus filling the gap and opening up the possibility to a fakeout lower towards the 1.2300/1.2287 region. With lower timeframe confirming price action at this area, intraday longs could be a possibility. Targets would be kept short and sweet here though since the higher timeframe picture is certainly not clear, well not as clear as we’d like it to be when risking capital.
4hr levels to keep an eye on during the week are as follows:
For shorts:
- The round number 1.2400.
- Three four Quasimodo resistance levels (all located within the aforementioned daily supply area) 1.2446/1.2490/1.2537.
For longs (all areas located within the aforementioned daily demand area):
- The 4hr demand area at 1.2217-1.2241.
- The 4hr Quasimodo support level at 1.2201.
Levels to watch/ live orders:
- Buys: 1.2300/1.2287 [Tentative – confirmation required] (Stop loss: dependent on where one confirms this area) 1.2217-1.2241 [Tentative – confirmation required] (Stop loss: 1.2213) 1.2201 [Tentative – confirmation required] (Stop loss: dependent on where one confirms this level).
- Sells: 1.2400 [Tentative – confirmation required] (Stop loss: dependent on where one confirms this level) 1.2446/1.2490/1.2537 [Tentative – confirmation required] (Stop loss: dependent on where one finds lower timeframe selling confirmation).
USD/CHF:
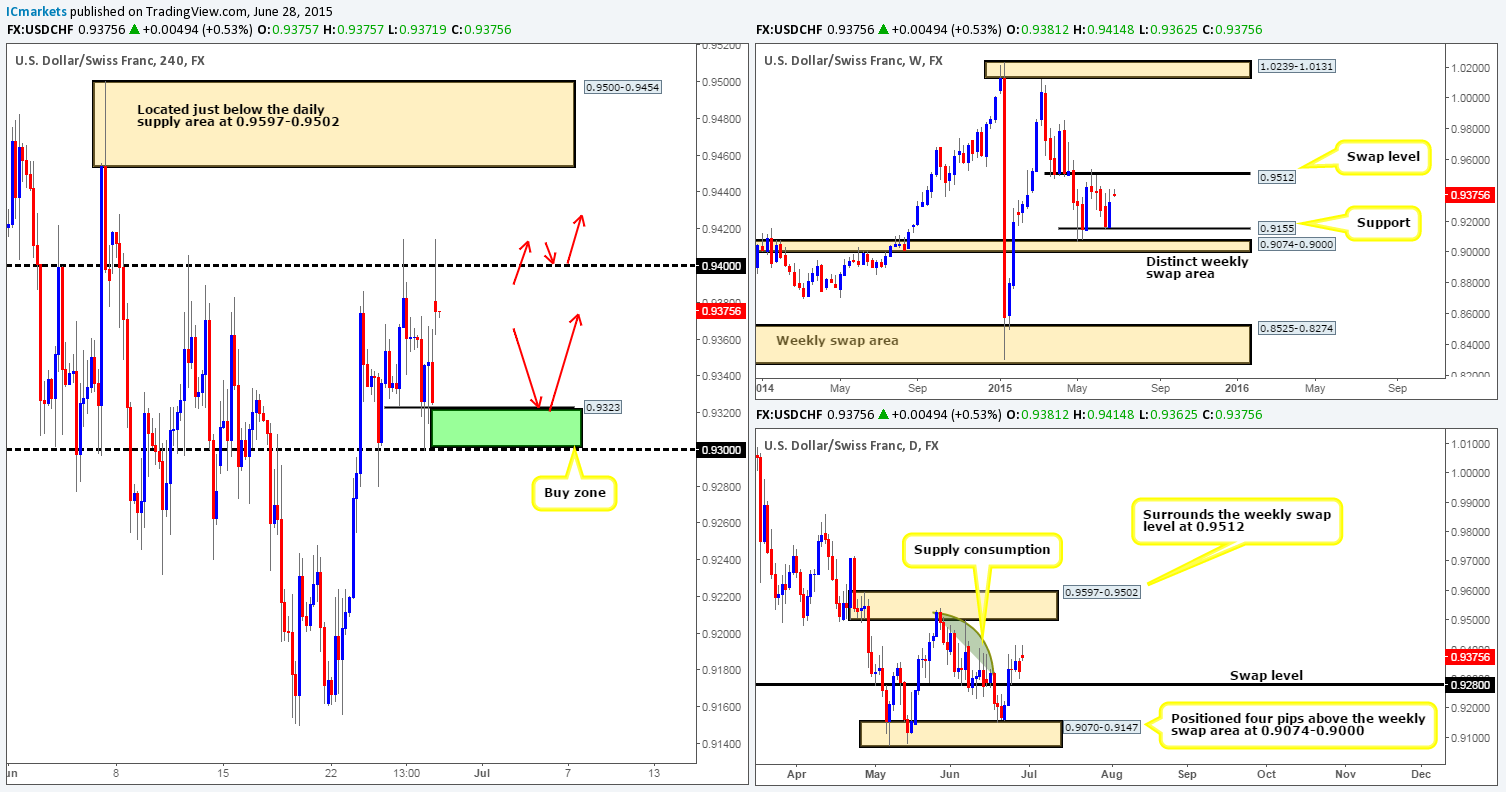
Weekly view – After four weeks of lower lows, the USD/CHF bounced back last week rebounding cleanly off of a weekly support level at 0.9155, gaining about 160 pips into the close 0.9326. In the event that the buyers can continue with this tempo going into this week, it is likely we’ll see prices challenge the weekly swap level coming in at 0.9512.
Daily view: From this picture, we can say quite confidently that this pair will head north as long as bids remain strong around the daily swap level 0.9280. The reason we say this is simply because price has now entered into what we like to call a consumption zone (the green arc pattern). By consumption zone we simply mean an area where we feel (in this case) supply has already likely been taken out at least until the daily supply area seen at 0.9597-0.9502.
4hr view: The latest coming in from the 4hr scale shows trade opened 55 pips higher than Friday’s close at 0.9381, which as you can see, forced price to fake above the round number 0.9400 and literally connect to-the-pip with Thursday’s high 0.9414, causing the market to sell off and close back below 0.9400.
Given that our analysis from the higher timeframes is telling us longs are possibly going to be the more dominant force this week (see above), the only two places we’d feel comfortable looking for buy entries on this pair so far this week would be the green buy zone sandwiched in between 0.9323 and 0.9300, and above 0.9400 (break/retest setup) as per the red arrows. Other than this guys, we’re happy to take a back seat on this pair until we see more conducive price action present itself.
Levels to watch/ live orders:
- Buys: 0.9323/0.9300 [Tentative – confirmation required] (Stop loss: 0.9294).
- Sells: Flat (Stop loss: N/A).
US 30:
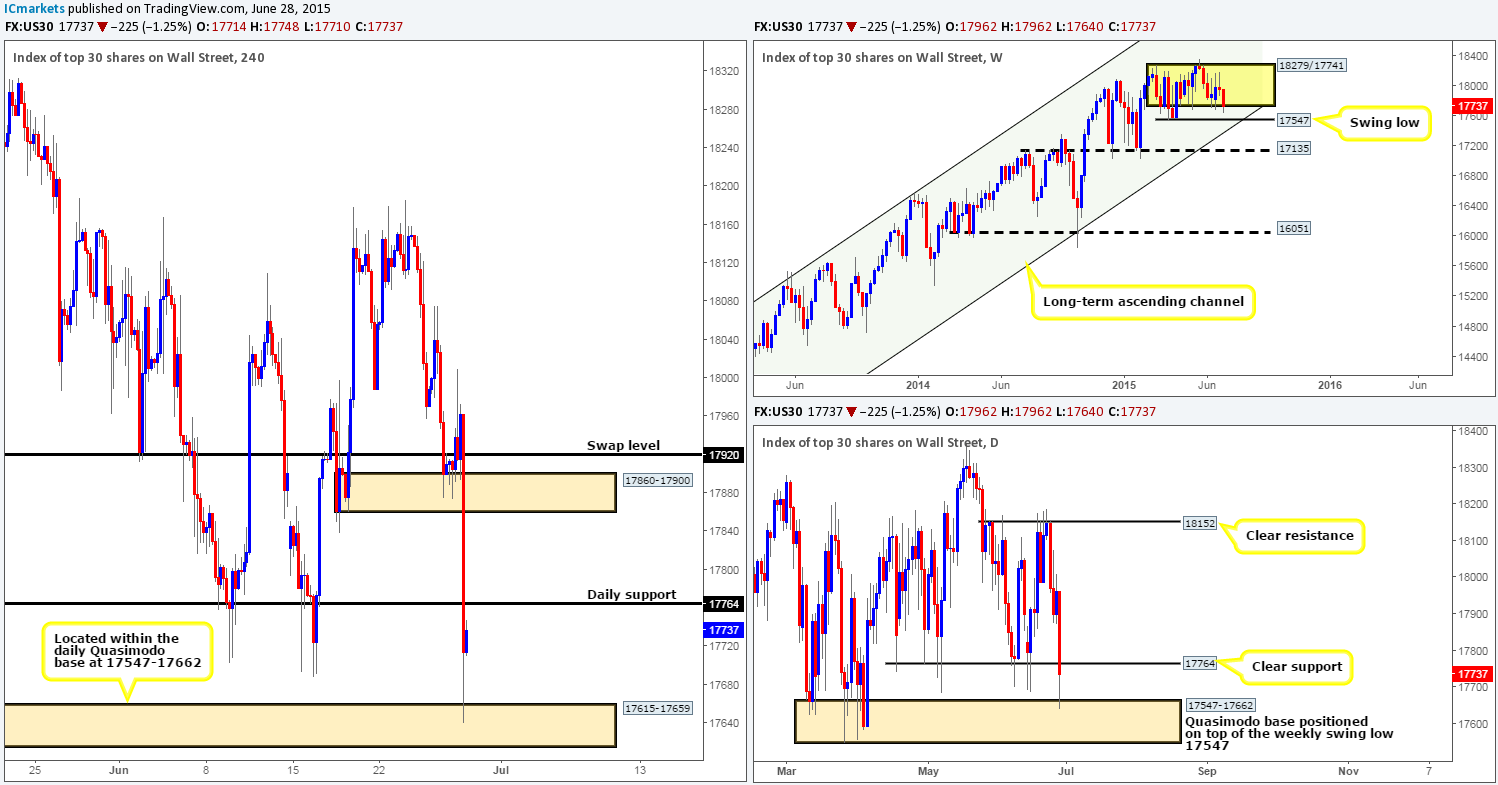
Weekly view – The weekly timeframe shows that the DOW did indeed see some volatility last week within its current range (18279/17741), but in the end only closed a mere 26 points below the open (17988) at 17962 – not really anything to get excited about. This week’s open 17962 on the other hand, has so far seen the floor drop from the DOW, causing price to attack the lower limits of the aforementioned weekly consolidation area (see above in bold for levels). From a longer-term perspective, however, the overall uptrend on this index is still very strong, and will remain this way in our opinion until we see a convincing push below 16051.
Daily view: From this angle, we can see that the recent descent has broken below a clear daily support hurdle at 17764, and collided with a daily Quasimodo support base at 17547-17662 (located on top of a weekly swing low 17547).
4hr view: The 4hr timeframe reveals just how aggressive the opening sell off really was – look at the strength of the candle, it was certainly an eye opener for a Monday morning! Nevertheless, price began to stabilize once it connected with a 4hr demand area at 17615-17659 (located within the aforementioned daily Quasimodo base).
Buying right now does indeed seem tempting considering where price is currently positioned on the higher timeframes (see above in bold) at the moment. Nonetheless, we would not feel comfortable entering long until the daily support level at 17764 (visible on the 4hr timeframe) was taken out as this could potentially now act as resistance and repel the market. Therefore, we have set an alert just above this level at 17775, and also set an alert below the current 4hr demand area at 17609 to warn us that price may be heading further south to the weekly swing low at 17547.
Levels to watch/ live orders:
- Buys: Flat (Stop loss: N/A).
- Sells: Flat (Stop loss: N/A).
XAU/USD (Gold)
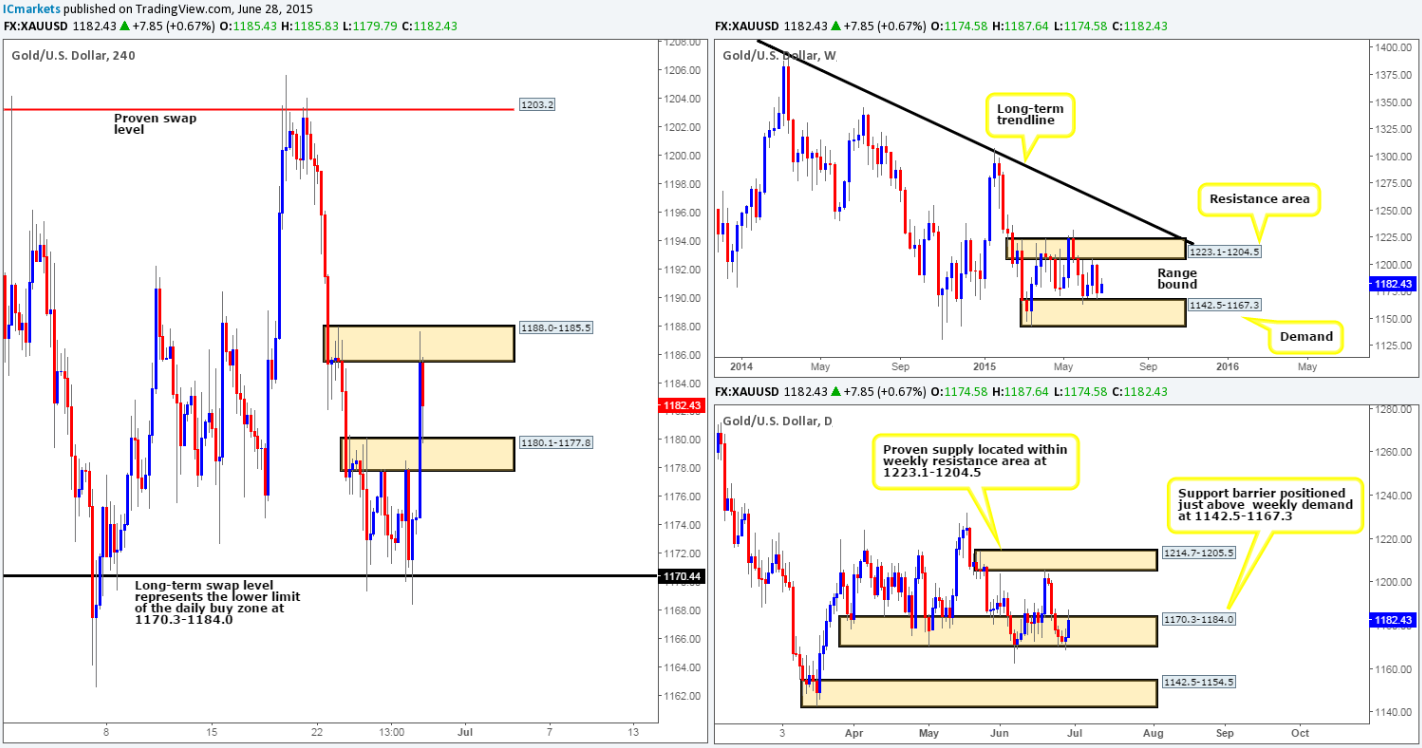
Weekly view – Last week saw the gold market plunge, consequently slamming itself into the lower limits of its current range (1142.5-1167.3 [Demand] 1223.1-1204.5 [Resistance area]) going into the close 1174.5. From a long-term perspective, however, gold is still trending south in our opinion, and It will only be once/if we see a close above the weekly trendline extended from the high 1488.0 would we begin to feel that this market may be reversing.
Daily view: Following Friday’s daily indecision candle that pierced the lower limit of a daily buy zone at 1170.3-1184.0, the market opened with a volatile push north this morning at 1174.5. Provided that the buyers can maintain this strength this week, we then feel there is a strong possibility price will soon be greeting the daily supply area coming in at 1214.7-1205.5 (located within the aforementioned weekly resistance zone).
4hr view: As you can see, Friday’s sessions continued to range between a long-term 4hr swap level at 1170.4 and a 4hr supply area at 1180.1-1177.8. This all changed this morning though as price smashed through the 4hr supply area and stabbed into another area of 4hr supply coming in at 1188.0-1185.5. Effectively, we believe this market to now be directionless until either a break above the current 4hr supply area is seen, or a push back below the recently broken 4hr supply area at 1180.1-1177.8 takes place, which of course is now acting demand.
One could, if they so wished, attempt to trade in between these two current zones. However, you may want to consider waiting for lower timeframe confirming price action before risking capital here, since the volatility in this market has been quite extreme so far.
Levels to watch/ live orders:
- Buys: Flat (Stop loss: N/A).
- Sells: Flat (Stop loss: N/A).

