Lower timeframe confirmation: is something we use a lot in our analysis. All it simply means is waiting for price action on the lower timeframes to confirm direction within a higher timeframe area. For example, some traders will not enter a trade until an opposing supply or demand area has been consumed, while on the other hand, another group of traders may only need a trendline break to confirm direction. As you can probably imagine, the list is endless. We, however, personally prefer to use the two methods of confirmation mentioned above in our trading.
EURUSD:
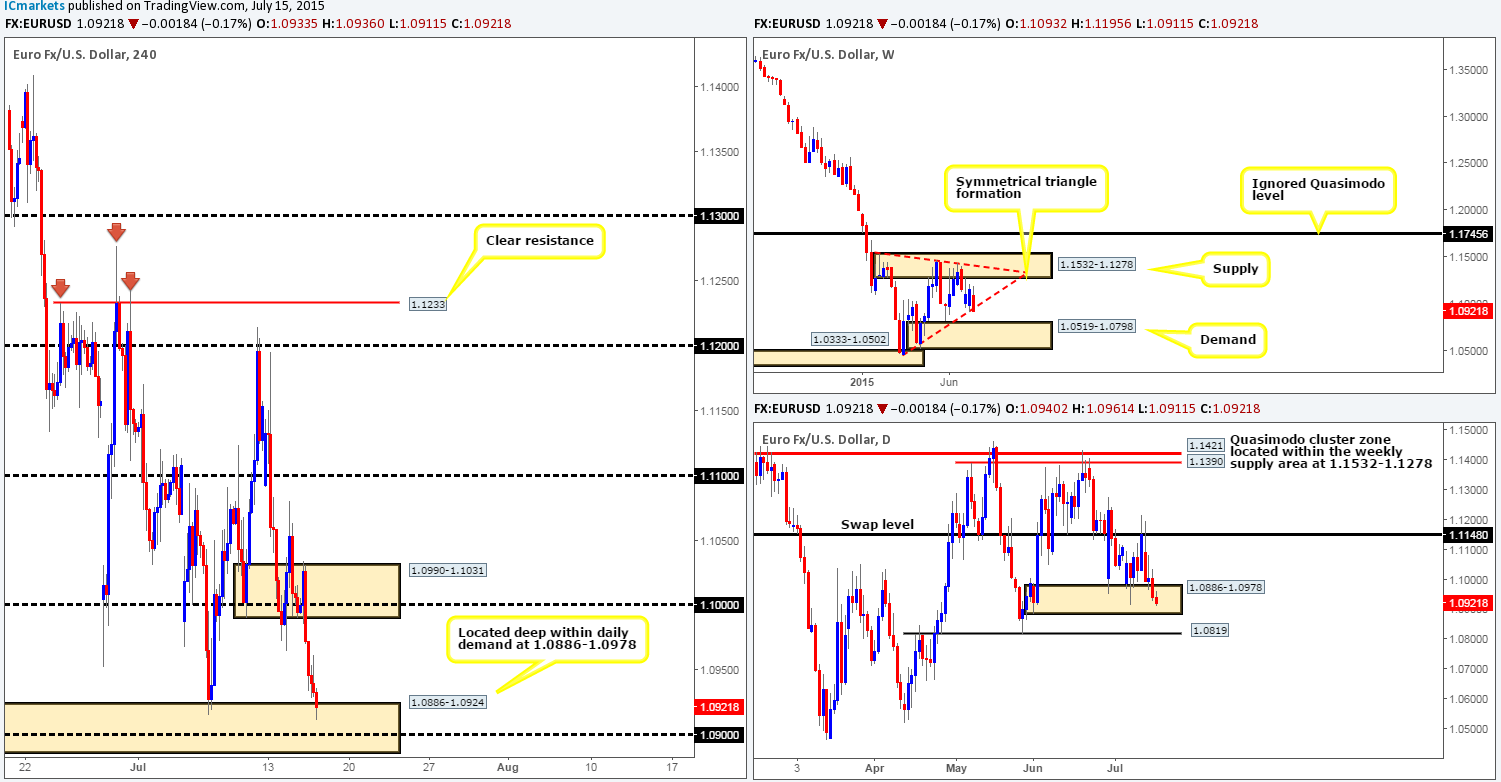
During the course of yesterday’s sessions, traders were seen attempting to bid the EUR currency higher from the 1.1000 handle, but failed miserably reaching only a high of 1.1034 on the day. Shortly after this, the EUR plummeted on the back of Yellen’s testimony before congress, which as you can see eventually reached the 4hr demand area at 1.0886-1.0924.
With downward pressure now being seen on higher timeframe support structures (ascending weekly trendline taken from the low 1.0468/daily demand area coming in at 1.0886-1.0978) at the moment, a ‘make or break’ decision clearly needs to be made on this pair.
Given the points made above, we have absolutely no interest in selling this pair at this time. All eyes are currently on the aforementioned 4hr demand zone at 1.0886-1.0924 due to the location of price on the higher timeframe picture (see above). We believe strong bids could come into the market and thrust this pair north. For us to be given the green light to buy this pair here, however, we’ll need to see some very attractive lower timeframe buying strength present itself.
Levels to watch/live orders:
- Buys: 1.0886-1.0924 [Tentative – confirmation required] (Stop loss: 1.0879).
- Sells: Flat (Stop loss: N/A).
GBP/USD:
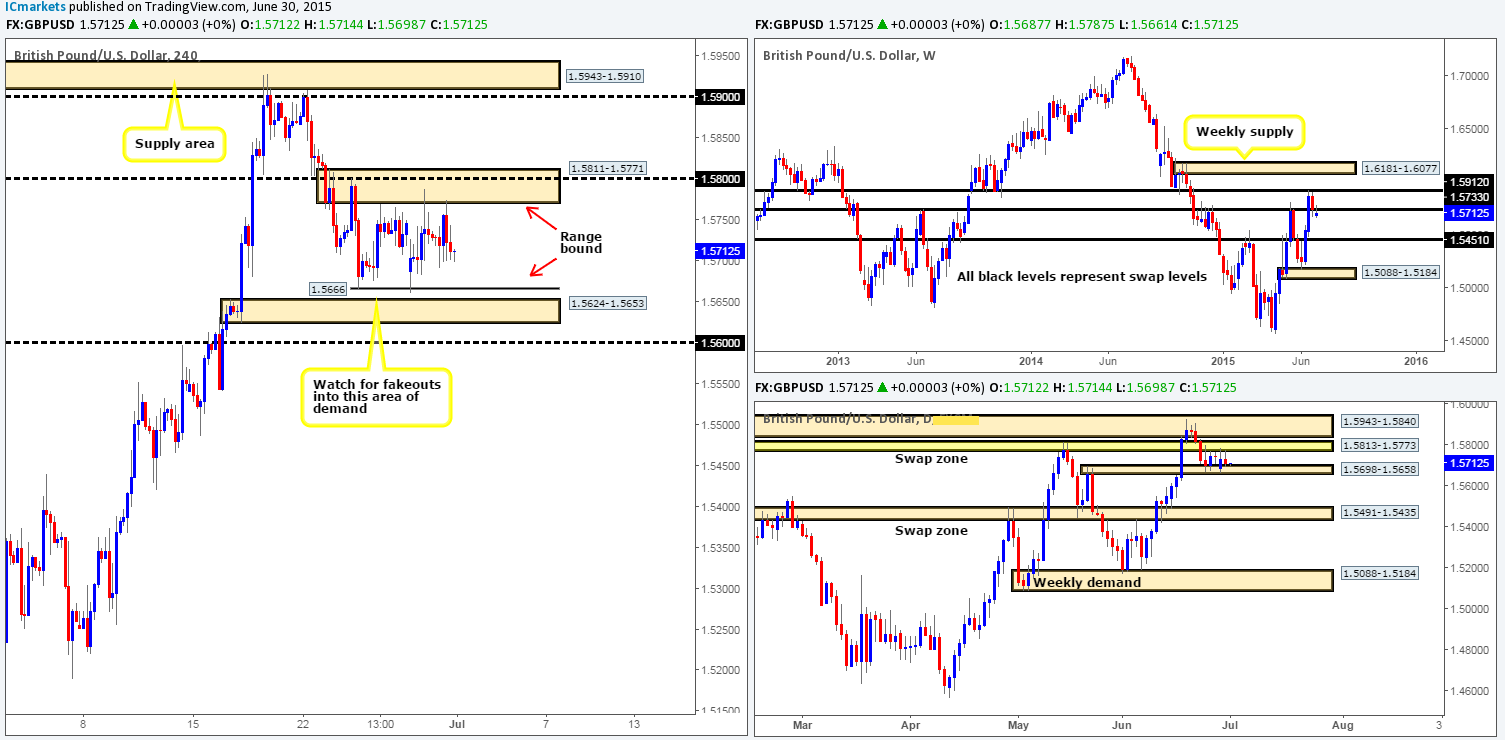
Recent action shows that Cable reached a high of 1.5673 before diving south towards the 1.5600 handle, which held firm into yesterday’s close 1.5631. For those who read our previous report, you may recall that we were considering entering long on any retest seen at 1.5600 if lower timeframe confirming price action was seen. Unfortunately, there was very little confirmation so we passed on the trade.
In addition to this, we also mentioned that we had placed a pending sell order at 1.5686 with a stop just above the high 1.5774 at 1.5778, as we believe a reaction will likely be seen within this area due to the following converging price action:
- 4hr supply area at 1.5731-1.5690 at 1.5739.
- Bearish Harmonic Gartley pattern which completes just above this 4hr supply area at 1.5739.
- Located very close to the weekly swap level at 1.5733.
- Positioned nicely within daily supply coming in at 1.5787-1.5687.
- Round number resistance seen at 1.5700.
Therefore, now that bids are currently holding this pair above 1.5600, we’re relatively confident that our sell order will be filled sometime today. With regards to targets for this short trade, we intend to follow Scott Carney’s trade management rules here (0.382 – move stop to breakeven and possibly take partial profits/0.618 take full profits).
Levels to watch/ live orders:
- Buys: Flat (Stop loss: N/A).
- Sells: 1.5686 (Stop loss: 1.5778).
AUD/USD:
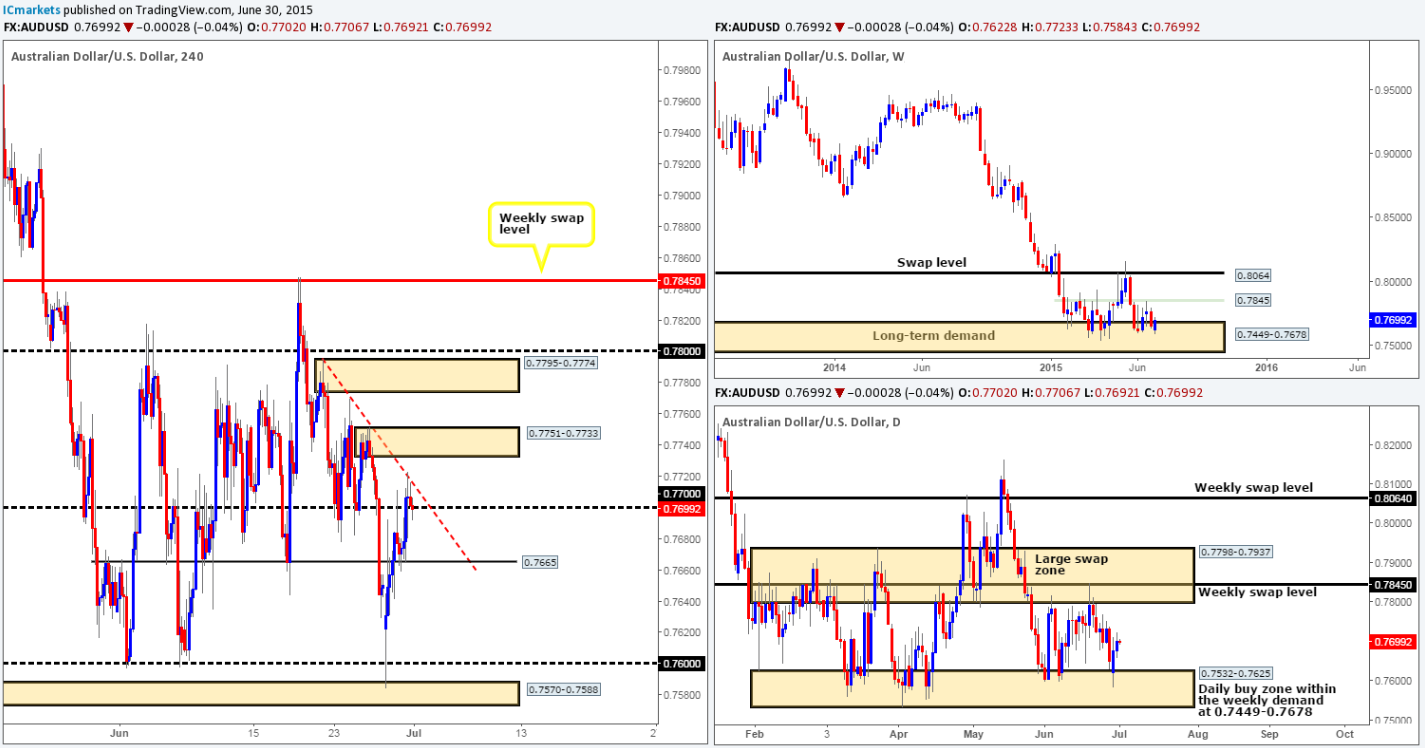
The latest coming in from the AUD/USD reveals that price took a hit during yesterday’s trade, forcing this market out of its current 4hr consolidation area (0.7498-0.7473/ 0.7371-0.7396) and into a small fakeout zone below around the mid-level barrier 0.7350.
At the time of writing, the bids look relatively strong from within this small crevice, which could possibly push the Aussie back up into its original 4hr range. However, this could be a very difficult move to trade today, since if you look across to the weekly and daily charts, you’ll see that price is currently drawing resistance from the underside of a long-term weekly demand (now acting supply) area at 0.7449-0.7678, and also its partner demand (now supply) area on the daily scale at 0.7449-0.7598. Moreover, we still have a little way to go yet before price reaches the next support on the higher scale – a long-term weekly demand area at 0.7326-0.6951.
Does this mean we’re going to ignore any buy signals seen within the small 4hr fakeout area today? No, not necessarily. We do however want to see two things happen before we’d consider buying. Firstly, price will need to drive into those buy tails seen marked with a pink circle at 0.7371/0.7391/0.7382/0.7386, and secondly, we’d need to see some sort of lower timeframe buying confirmation present itself. Even if both of these elements are seen, however, one will still need to have strict trade management rules, since let’s not forget that by entering long in this vicinity, you’re effectively going against the higher timeframe grain so to speak.
Levels to watch/ live orders:
- Buys: 0.7350/0.7396 [Tentative – confirmation required] (Stop loss: dependent on where one confirms this area).
- Sells: Flat (Stop loss: N/A).
USD/JPY:
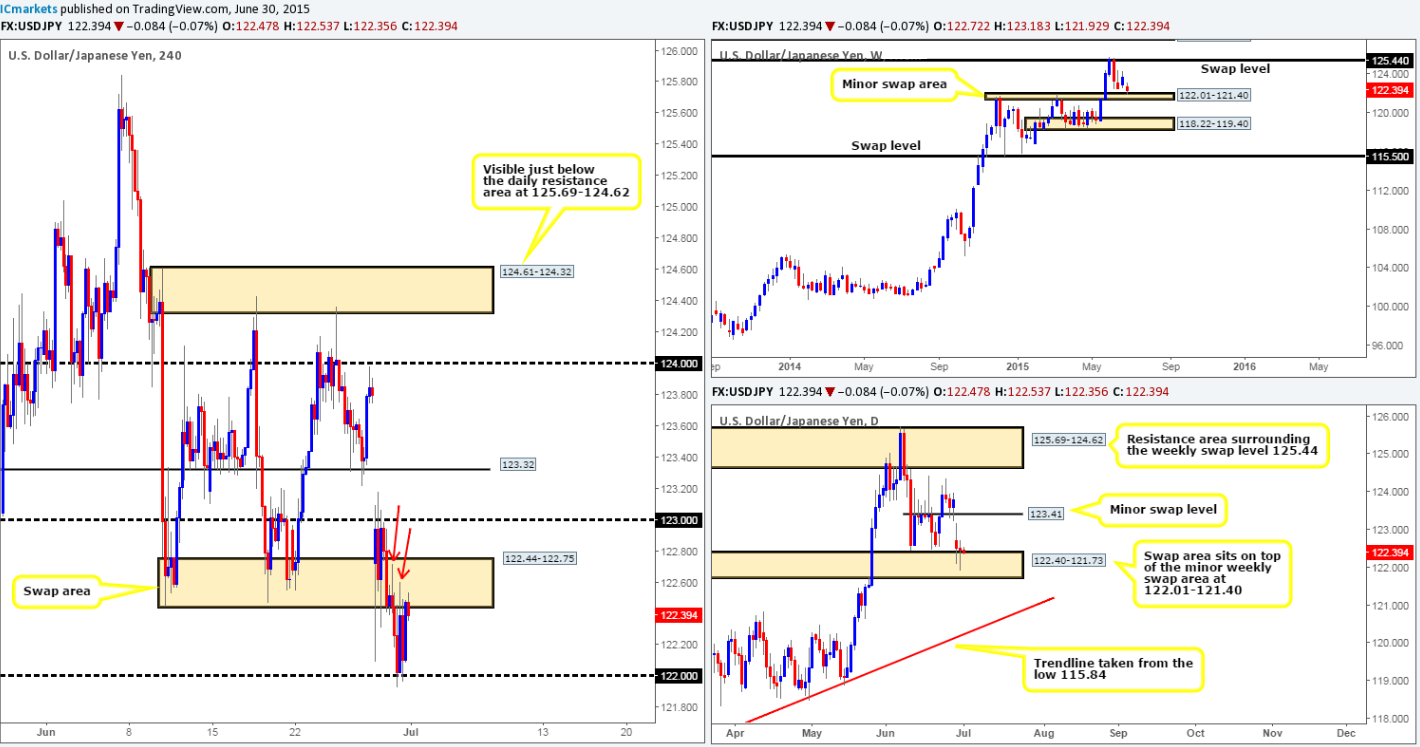
In the bigger picture, we can see that strong buying is taking place from the top-side of both a weekly swap area at 122.01-121.40, and a daily supply area (now acting demand) at 122.87-122.51. With this, we see very little active supply on the higher timeframes until price connects with a daily resistance area at 125.69-124.62, which also surrounds a weekly swap level coming in at 125.44.
As bullish as this pair sound right now, buying is unfortunately still out of the question for us as price is trading below potentially problematic resistance drawn at 124.00. Ultimately, what we’re looking for price to do today is use the buying pressure seen from the retest of the recently broken 4hr supply area at 123.71-123.49 to propel price further north above 124.00. This would not only likely set the stage for a continuation move north towards 125.00, but also provide a potential long opportunity to trade if price retests 124.00. Why we feel the path is clear above 124.00 comes from the supply consumption wicks seen marked with red arrows at: 123.97/124.36/124.43/124.61. These wicks were likely created by pro money used to collect unfilled sell orders in order to continue selling this market, thus once price returns to this area, which as you can see it nearly has, price will likely slice through this consumed zone like a hot knife through butter.
Levels to watch/ live orders:
- Buys: Flat (Stop loss: N/A).
- Sells: Flat (Stop loss: N/A).
USD/CAD:
Mid-way through the London session price exploded north, completely obliterating 1.2800 and 1.2900 during its onslaught. It was only once we saw price connect with the mid-level hurdle 1.2950 did the market show signs of weakness.
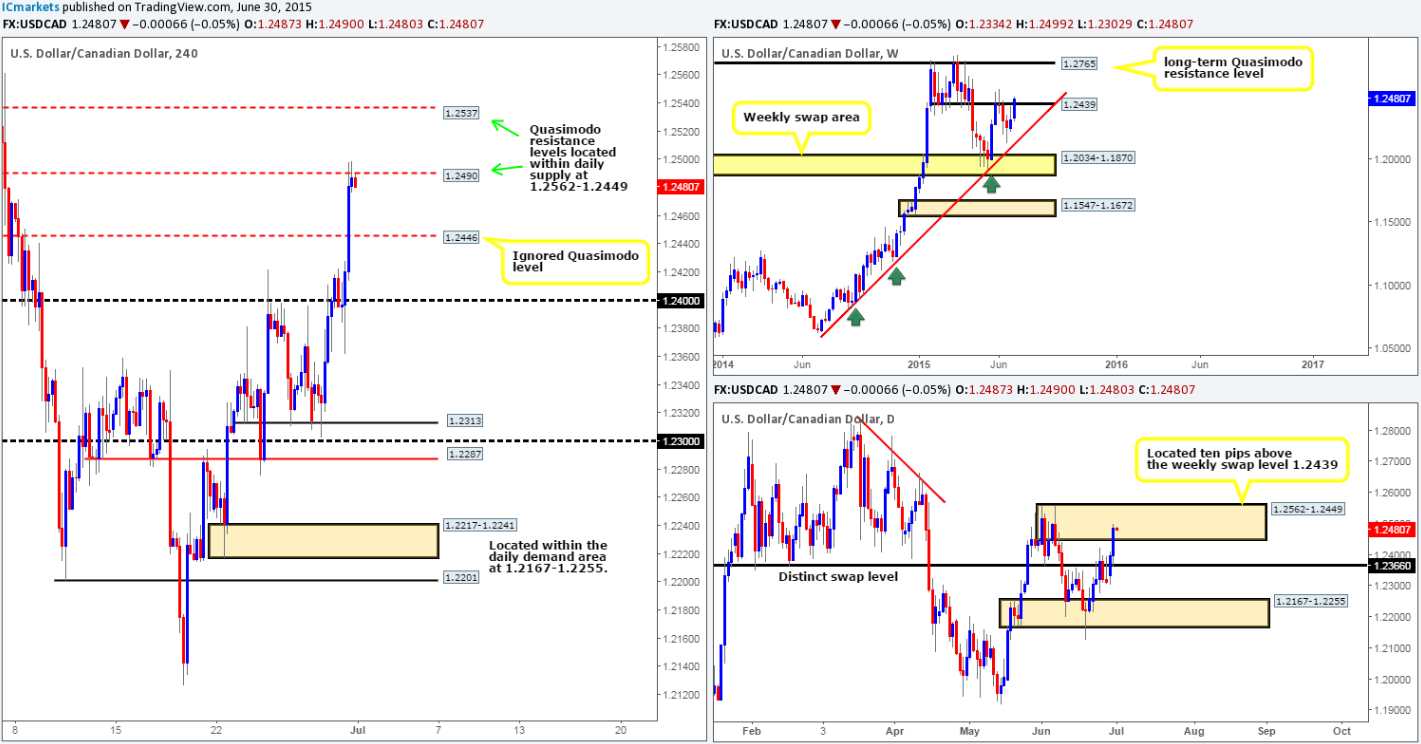
Now, this recent rally has seen price land within shouting distance of a very clean looking daily Quasimodo resistance level at 1.2965, which sits just below another Quasimodo resistance level at 1.3014 coming in from the weekly timeframe. Therefore, between these two zones (green rectangle), which includes the large round number 1.3000, is where we believe a relatively strong sell-off will take place. However, considering the strong uptrend the USD/CAD is in right now, and the fact that a fakeout could be seen above the upper limit of our sell zone (1.3014), we are not going to be placing any pending orders here today. Instead, we’re going to patiently watch the lower timeframe (30/240 min) action once/if price hits this zone for any selling confirmation. Targets will obviously depend on how price approaches this zone, but we feel 1.2900 will be the first problematic area to overcome.
Levels to watch/ live orders:
- Buys: Flat (Stop loss: N/A).
- Sells: 1.3014/1.2965 [Tentative – confirmation required] (Stop loss: dependent on where one finds confirmation).
USD/CHF:
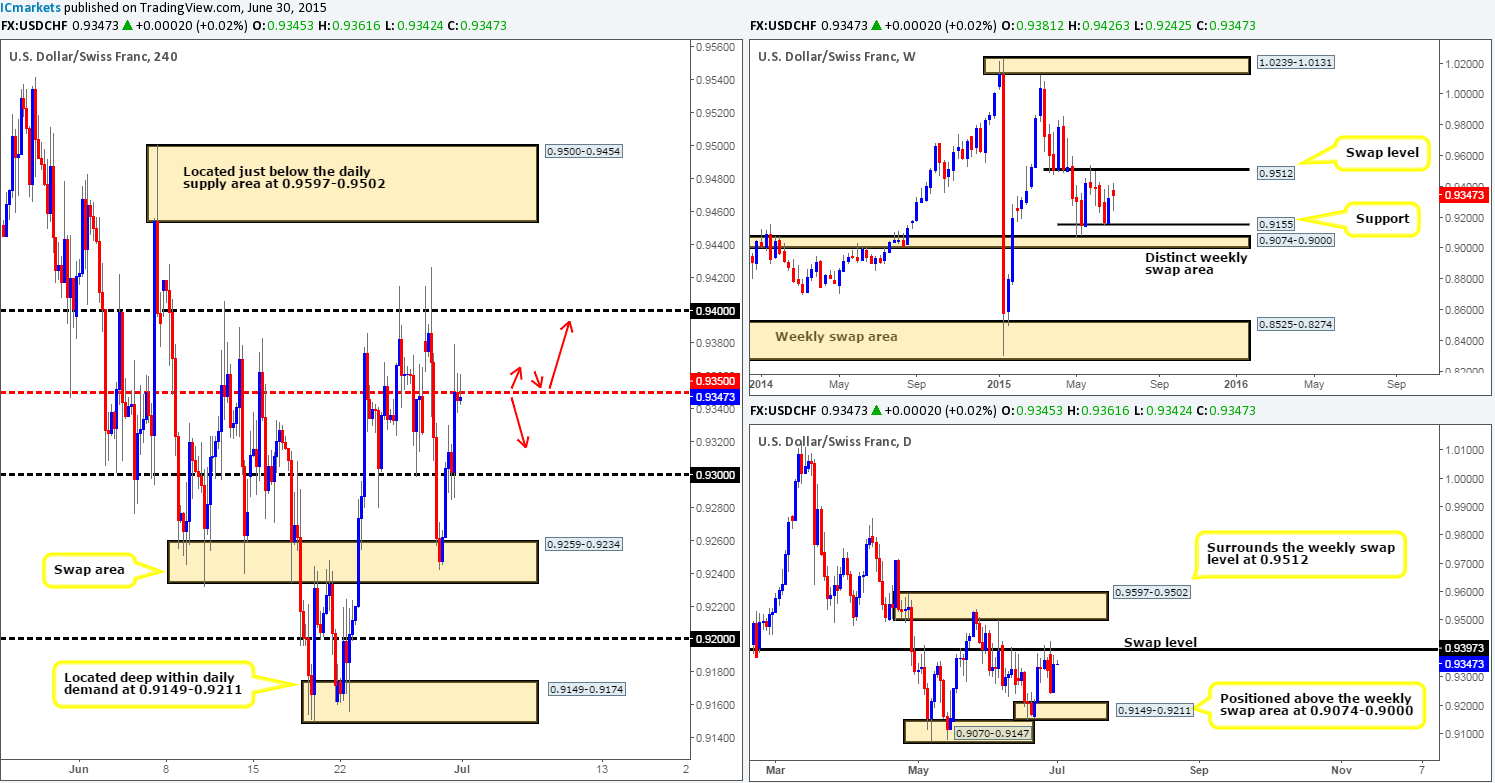
Throughout the course of yesterday’s trading sessions, follow-through buying was seen from Tuesday’s initial rebound off of 0.9400. This move surpassed 0.9500 and attacked a small, yet clearly resilient 4hr Quasimodo resistance level at 0.9537.
With both the weekly and daily charts now showing price trading side-by-side around resistive structures (0.9512/ 0.9597-0.9502) at the moment, we’re naturally favoring shorts over longs at this time. Does this mean we should all go placing sell orders in the market now? No, not quite. Well, if you’re aggressive in your trading, then that could be an option. We, on the other hand, tend to play this game on the more conservative side. As such, before considering shorts here, we would need to see a clean push below 0.9500, which, in effect, would be our cue to begin looking for price to retest either 0.9500 or the aforementioned 4hr Quasimodo resistance level as per the black arrows. Waiting for lower timeframe confirmed price action is highly recommended on any retest seen, since getting taken out on a fakeout only to see price drive in to your take-profit target is not something most traders enjoy seeing!
Levels to watch/ live orders:
- Buys: Flat (Stop loss: N/A).
- Sells: Flat (Stop loss: N/A).
DOW 30:
Yesterday’s movements on the DOW saw price chew through a ceiling of offers sitting around the 4hr supply area at 18076-18040, and then drop lower to collect any unfilled bids sitting at the top-side of the recently broken 4hr supply area (now acting demand) at 18010-17962. From here, the DOW pushed north which will likely continue into today’s sessions until we reach the 4hr Quasimodo resistance level at 18110.
18110 is an extremely high-probability turning point in this market, and we expect a bounce at the very least to be seen from here for the following reasons:
- Located just within a daily supply area seen at 18186-18103.
- Lines up just beautifully with the 88.6% Fibonacci retracement value.
- Shows space below for price to move into profit.
The only grumble we have with this short trade is the fact that we still see room on the weekly scale for prices to move north towards the upper limit of the current weekly range, 18279. Therefore, just to be on the safe said here, we will only trade from the aforementioned 4hr Quasimodo resistance level should it boast lower timeframe confirmation upon being hit.
Levels to watch/ live orders:
- Buys: Flat (Stop loss: N/A).
- Sells: 18110 [Tentative – confirmation required] (Stop loss: dependent on where one confirms this level).
XAU/USD: (Gold)
Gold dropped for a third consecutive day during the course of yesterday’s trade, resulting in price engulfing the 4hr buy zone at 1147.1-1152.2, and nearly shaking hands with a 4hr support level coming in at 1142.2.
Although this market has taken a tumble just recently, the weekly and daily timeframes still show price trading within overall demand (1142.5-1167.3/1142.5-1154.5) at the moment. Therefore, we cannot rule out the possibility of a rally higher just yet.
Taking into consideration the points made above, we believe there to be two possible ways to trade this pair long today:
- Wait for price to clear offers sitting around the 4hr swap level coming in at 1149.6, and look to enter (with lower timeframe confirmation) on any respectable retracement seen at this level.
- Assuming price cannot manage to get above the aforementioned 4hr swap level, the market will likely swing south and attack yesterday’s low 1143.2. This could be a perfect level for well-funded traders to break lower for liquidity. Think how many day traders will be looking to fade yesterday’s low. Millions would be our guess! Therefore, should the market break this zone and stop these traders out, liquidity will be available (sell stops to buy into) to bounce prices off of the 4hr support level sitting just below it at 1142.2. Furthermore, there will also likely be a lot of breakout traders also trying to catch a ride if yesterday’s low does break, and if our analysis is correct, all they will have done is shorted into higher timeframe demand and 4hr support. Therefore, once these breakout guys are stopped out (buy stops) this will add to the upside momentum seen from the 4hr support level. Buying from the 4hr support barrier using a pending buy order, however, is risky in our opinion, we’d much rather wait to see how the lower timeframe price action reacts here. If there is a rebound and strength is seen, we would then enter long at market.
Levels to watch/ live orders:
- Buys: 1142.2 [Tentative – confirmation required] (Stop loss: dependent on where one confirms this level).
- Sells: Flat (Stop loss: N/A).
