A note on lower timeframe confirming price action…
Waiting for lower timeframe confirmation is our main tool to confirm strength within higher timeframe zones, and has really been the key to our trading success. It takes a little time to understand the subtle nuances, however, as each trade is never the same, but once you master the rhythm so to speak, you will be saved from countless unnecessary losing trades. The following is a list of what we look for:
- A break/retest of supply or demand dependent on which way you’re trading.
- A trendline break/retest.
- Buying/selling tails – essentially we look for a cluster of very obvious spikes off of lower timeframe support and resistance levels within the higher timeframe zone.
- Candlestick patterns. We tend to only stick with pin bars and engulfing bars as these have proven to be the most effective.
EUR/USD:
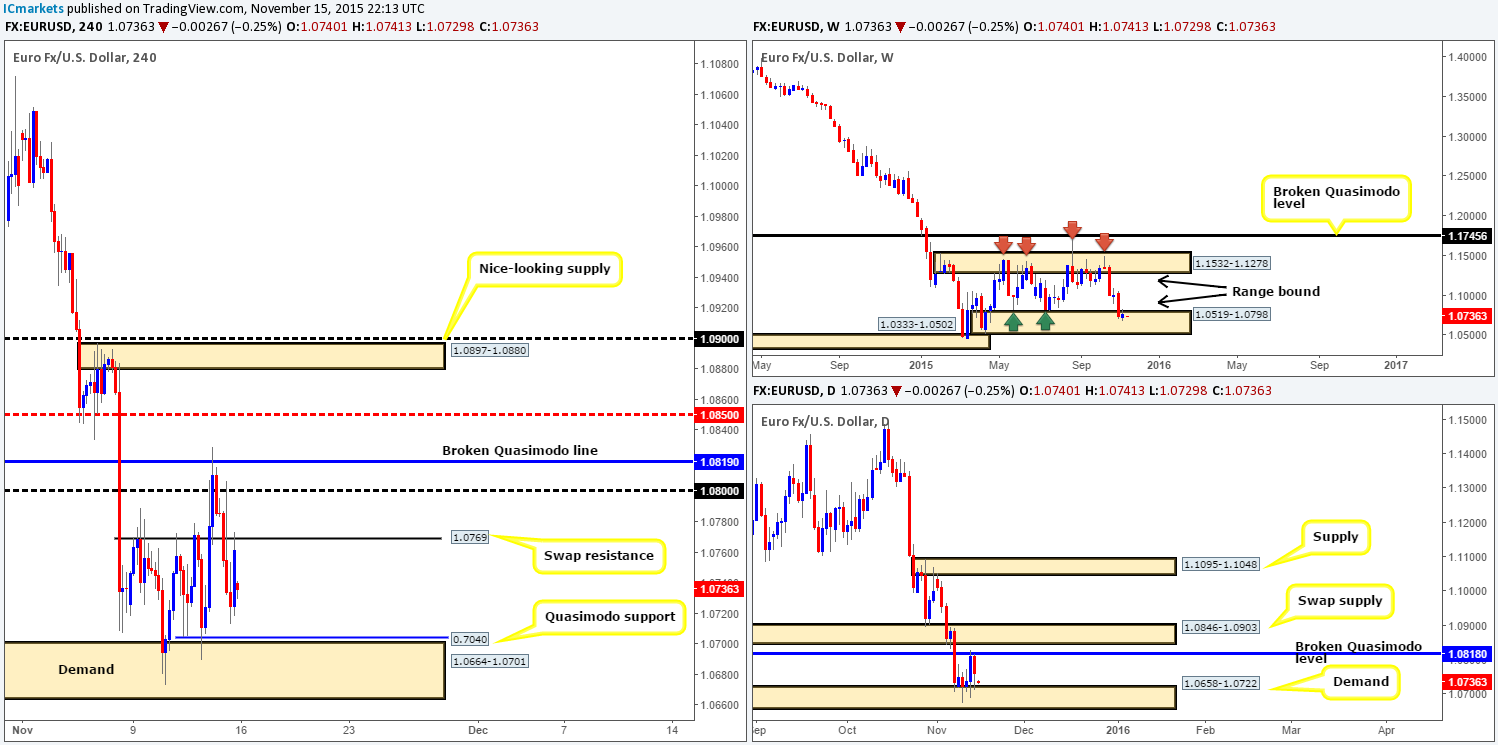
Weekly view: With the EUR gaining only around 30 pips by the close 1.0763, it’s clear to see that not much action took place last week. This surprised us if we’re honest, as price currently trades within range demand visible at 1.0519-1.0798, which has been proven twice – once back in late May at 1.0818 and also in mid-July at 1.0826 (green arrows). Due to this somewhat pitiful attempt to rally prices higher from here, there is a possibility that we may see a drive deeper into this zone before the bulls make any noteworthy challenge this week.
Weekly levels to watch this week fall in at: 1.0519-1.0798.
Daily view: On the other side of the spectrum, action on the daily timeframe shows price responded nicely to demand last week at 1.0658-1.0722 (converges with alternate AB=CD extreme [Fibonacci ext. 127.2%] around 0.7000). However, the rally from here was short-lived due to a strong ceiling of offers being filled at the broken Quasimodo level coming in at 1.0818.
In light of price trading at a weekly range demand (see above) right now, we feel that we may eventually see this market jab beyond the broken Quasimodo level and connect with the swap supply zone lurking just above at 1.0846-1.0903. It will be interesting to see what the H4 timeframe has on offer…
Daily levels to watch this week fall in at: 1.0658-1.0722/1.0818/1.0846-1.0903.
4hr view: From this side of the field, it is clear to see that Friday was not a good day for anyone long the Euro, unless of course you managed to enter long during the American afternoon session that is! Price fell relatively sharply from below psychological resistance 1.0800 and ended the day printing session lows of 1.0712. It was at this point, a few hours before the week’s close, a short-covering ascent was seen back up to the underside of 1.0769 – now a swap resistance level.
Going forward, this morning’s open 1.0740 saw a twenty-pip gap lower, which was likely due to the recent events in Paris late Friday evening.
Technically, we are biased to the long-side of this market right now… For one, we have weekly action trading within demand, and two, thanks to the recent gap lower, daily is also positioned just above demand (see above), and three, we see H4 price hovering above a Quasimodo support level at 0.7040, bolstered by an already-proven demand base seen at 1.0664-1.0701 (Both of which are closely situated around the current aforementioned higher timeframe demands).
Therefore, we are going to be looking to buy with lower timeframe confirmation around the 0.7040 mark today should price reach this low. Ideally, we do not want to see a break below Thursday’s low 1.0689 as this would invalidate our Quasimodo pattern. Assuming all of the above goes to plan, our immediate take-profit area will be somewhere around swap resistance at 1.0769, followed then by psychological resistance 1.0800.
Levels to watch/live orders:
- Buys: 1.7040 [Tentative – confirmation required] (Stop loss: dependent on where one confirms this level).
- Sells: Flat (Stop loss: N/A).
GBP/USD:
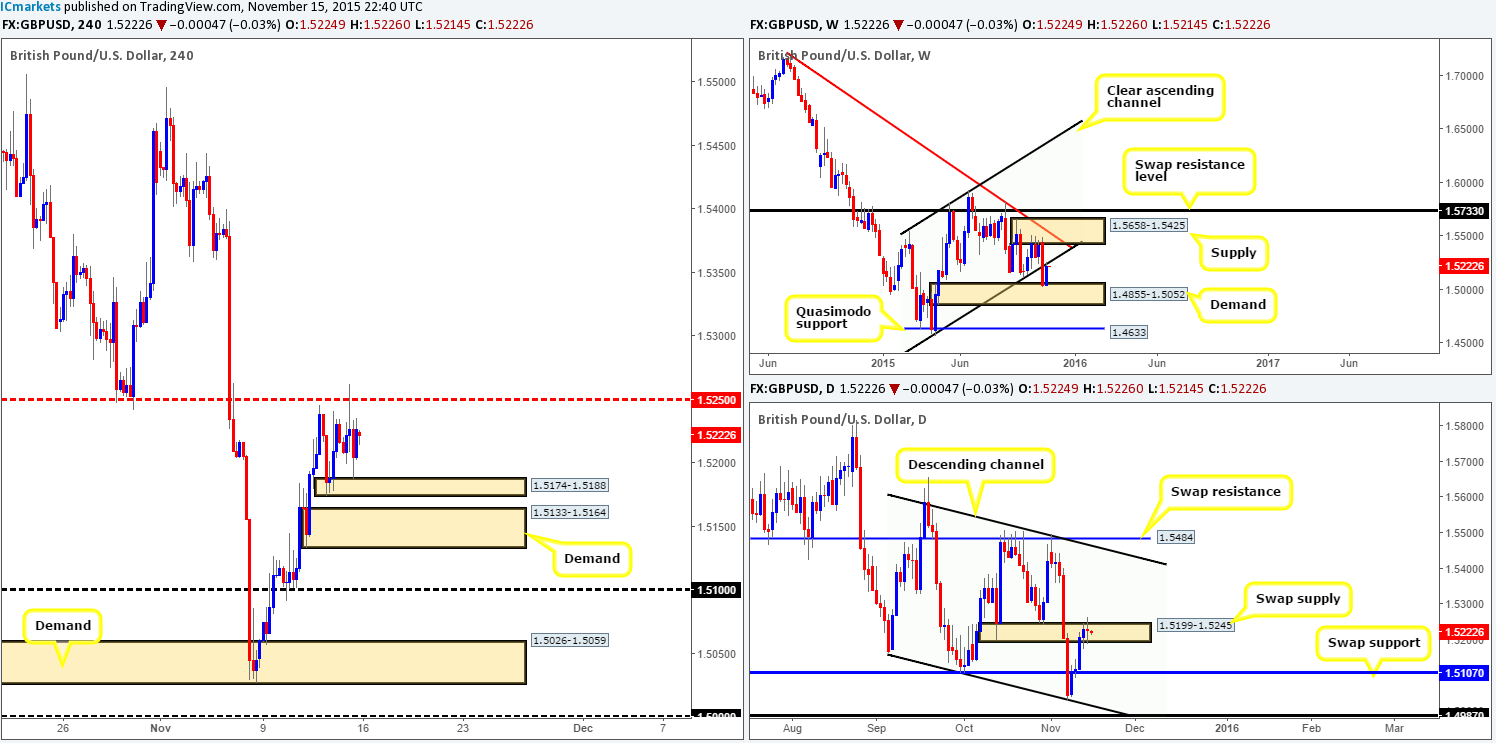
Weekly view: Cable posted modest gains last week thanks to demand seen at 1.4855-1.5052. The pair rallied close to 190 pips, erasing around 50% of the prior week’s losses and also drove into the recently broken channel support-turned resistance line (1.4564) by the close 1.5227. In the event of a break above this channel line, it’s very likely market action will continue north to shake hands with supply coming in at 1.5658-1.5425.
Weekly levels to watch this week fall in at: 1.4855-1.5052/Channel resistance/ 1.5658-1.5425.
Daily view: Moving down a level, we can see that price rebounded beautifully from a descending channel support taken from the low 1.5162, and continued marching north towards a swap supply zone at 1.5199-1.5245. Given that there’s space to move both above (towards channel resistance [1.5586]) and below (towards swap support at 1.5107) this zone this week, and the fact that Friday’s trade printed a clear-cut indecision candle within the area, it is proving difficult to judge this week’s direction at this time. Let’s see what information we can glean from the H4…
Daily levels to watch this week fall in at: Channel support/ 1.5199-1.5245/Channel resistance.
4hr view: For anyone who read Friday’s report (http://www.icmarkets.com/blog/friday-13th-november-keep-an-eye-on-u-s-dollar-related-markets-around-1-30pm-gmt-today-heavy-market-action-expected/), you may remember us mentioning that we had our eye on the mid-level resistance 1.5250 for shorts. As we can all see, price hit this level beautifully and moved low enough for profit. Unfortunately, we found little to no confirming price action on the lower timeframes before the drop took place. Well done to any of our readers who did manage to sell here – a nice end to the week!
With little change seen going into this morning’s open 1.5224, the 1.5250 barrier is once again the level to watch above. We would, given the right lower timeframe confirmation pattern, look to short from here again today, but at the same time are more than prepared for it to break. In the event a break above does happen, the space seen above here makes it a fantastic area to look for a confirmed long from on any retest seen (confirmation required).
Below, however, we would not consider entering long on this pair until around the psychological support level 1.5100 (positioned nicely around the daily swap [support] area at 1.5107). This simply comes down to preference here guys. The near-term demands seen at 1.5174-1.5188/ 1.5133-1.5164 have absolutely no connection with the higher timeframes whatsoever, thus making them low probability and only good for a bounce at best in our opinion.
Levels to watch/ live orders:
- Buys: 1.5100 [Tentative – confirmation required] (Stop loss: dependent on where one confirms this level) Watch for offers to be consumed around 1.5250 and then look to trade any retest seen at this level (confirmation required).
- Sells: 1.5250 [Tentative – confirmation required] (Stop loss: dependent on where one confirms this level).
AUD/USD:
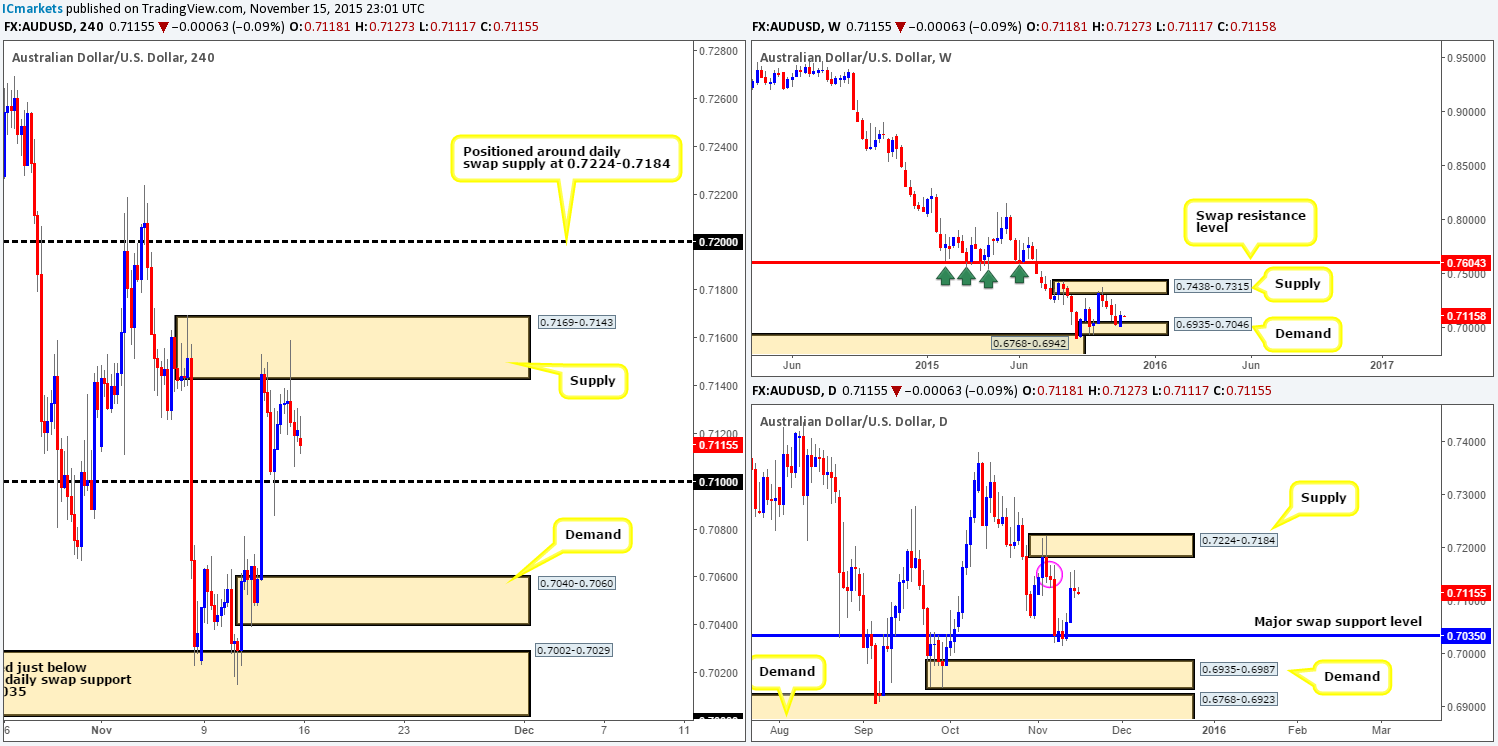
Weekly view: Following a sluggish four-week decline, last week’s action saw the Aussie dollar correct itself from demand seen at 0.6935-0.7046, gaining close to 90 pips by the close 0.7121. In addition to this, a relatively sturdy-looking bullish engulfing candle formed, which if respected going into this week’s trade, further buying could take place back up to supply drawn from 0.7438-0.7315.
Weekly levels to watch this week fall in at: 0.6935-0.7046/0.7438-0.7315.
Daily view: From this viewpoint, price rallied nicely from the swap support level at 0.7035 during mid-week trade. This brought price up to a minor supply zone seen marked with a pink circle at 0.7168-0.7141, which, as you can see, forced this market to paint two selling wicks into the weekend. The reason we have labeled this zone a minor simply comes from seeing a far more attractive-looking supply just above it at 0.7224-0.7184. Therefore, if you’re considering selling based on the recent selling wicks, trade cautiously as there may be further buying seen yet!
Daily levels to watch this week fall in at: 0.7035/0.7168-0.7141/0.7224-0.7184.
4hr view: Friday’s H4 action stamped in a relatively vicious selling wick from within supply at 0.7169-0.7143, but saw little follow-through thereafter. Given that the open 0.7118 made very little difference to the structure of this pair, much of the following analysis will be similar to Friday’s report…
Considering that price is now lodged (mid-range) between psychological support 0.7100 and the aforementioned supply zone, we have the following noted…
- Given that price is trading from weekly demand and daily action is, as far as we see, likely heading higher (see above) selling anywhere other than around psychological resistance 0.7200 (located around the above said daily supply) would be too risky for our liking. Therefore, do trade cautiously if you’re looking to short the current H4 supply today!
- Should price re-visit the 0.7100 support on the other hand, we may, dependent on how the lower timeframes react and of course the time of day, take a long from here in the hope that higher timeframe buying pressure will hold this level firm and take out the current H4 supply and hit 0.7200.
Levels to watch/ live orders:
- Buys: 0.7100 region [Tentative – confirmation required] (Stop loss: dependent on where one confirms this level).
- Sells: 0.7200 region [Tentative – confirmation required] (Stop loss: dependent on where one confirms this level).
USD/JPY:
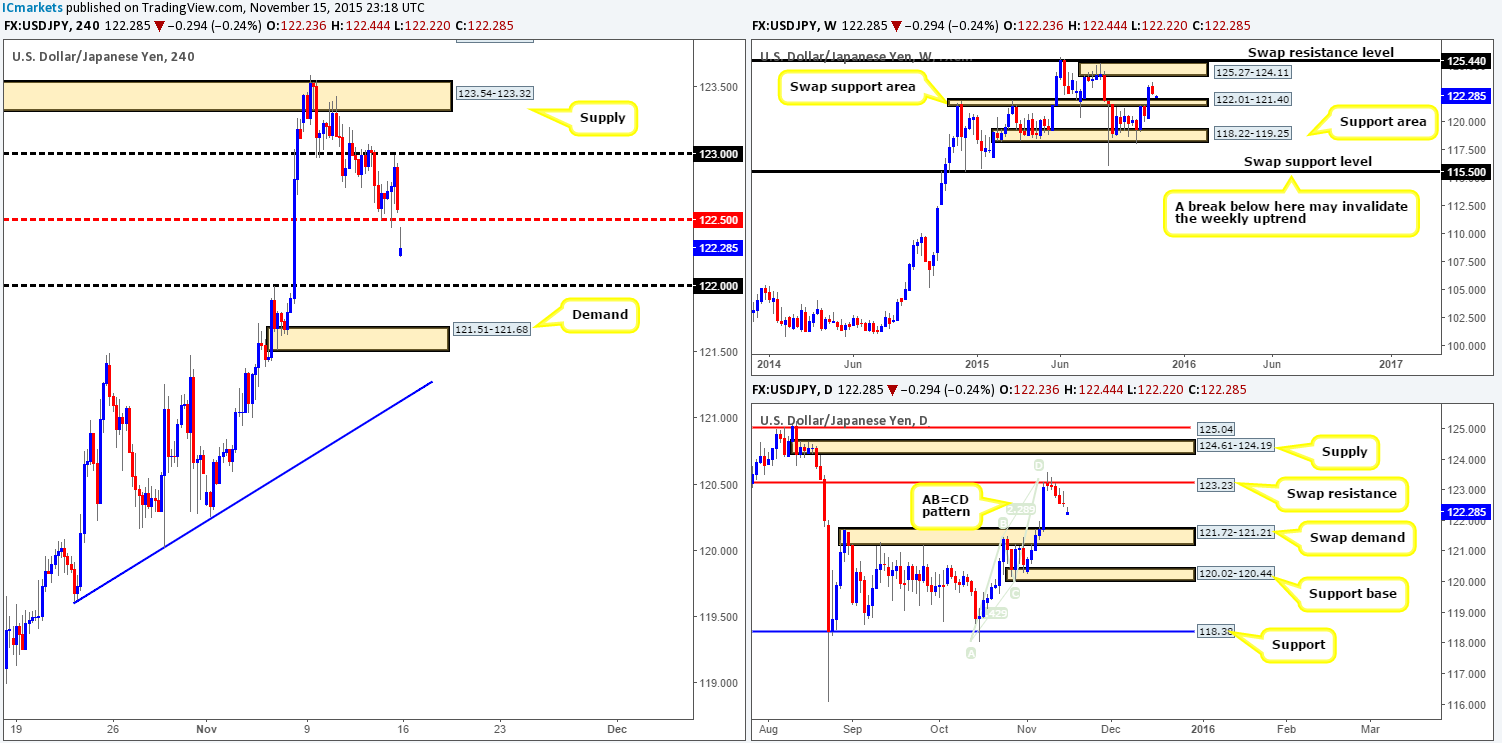
Weekly view: Following the bullish stampede seen two weeks ago, last week’s action was very quiet (down 54 pips) with little to no change seen to the structure into the close 122.57. As such, zones we have our eye on this week are: the swap support area at 122.01-121.40, and the supply zone seen above at 125.27-124.11, followed closely by the swap resistance level just above it at 125.44.
Weekly levels to watch this week fall in at: 122.01-121.40/125.27-124.11/125.44.
Daily view: On the other side of the platform, however, daily action reveals that price responded relatively well to the merging swap resistance level at 123.23 and AB=CD bear top at 123.43. In the event that the sellers remain in control this week, we could see a further decline down towards swap demand coming in at 121.72-121.21 (sits within the above said weekly swap [support] area). A break above this daily level, nevertheless, would likely force this market north up to supply seen at 124.61-124.19, and possibly even up to a Quasimodo resistance barrier just above it at 125.04 (both located within the aforementioned weekly supply area).
Daily levels to watch this week fall in at: 123.23/121.72-121.21/124.61-124.19/125.04.
4hr view: Overall, Friday’s trade was nothing to get excited about. Active bids defended mid-level support 122.50 going into the U.S. open, forcing price to highs of 122.98, before dropping and erasing most of the day’s gains by the week’s end.
This morning’s open, nonetheless, saw a 35-pip gap lower, breaking below 122.50 and reaching lows of 122.20. As can be seen from the chart, traders are currently filling this gap as we write, which will likely bring this market back up into the hands of 122.50 – a nice sell zone. The reason for this being considered an area to look for sells comes from the following… For starters, there is little stopping prices from moving lower on both the weekly and daily charts (see above) down to psychological support 122.00. Just to be clear here guys, should you manage to trade short from 122.50 and price does move in your favor, be very careful wishing for more than 122.00. Reason being is this number converges with the top-side of the weekly swap (support) area at 122.01, and is also positioned not too far from the daily swap demand at 121.72.
On that note, aside from looking to short from 122.50, we also have our eye on 122.00 for possible longs, and possibly the demand area seen below it at 121.51-121.68. This base, not only lines up perfectly with the aforementioned daily swap demand, but also sits within the weekly swap (support) area just mentioned above as well.
Levels to watch/ live orders:
- Buys: 122.00 [Tentative – confirmation required] (Stop loss: dependent on where one confirms this level) 121.51-121.68 [Tentative – confirmation required] (Stop loss: dependent on where one confirms this area).
- Sells: 122.50 region [Tentative – confirmation required] (Stop loss: dependent on where one confirms this level).
USD/CAD:
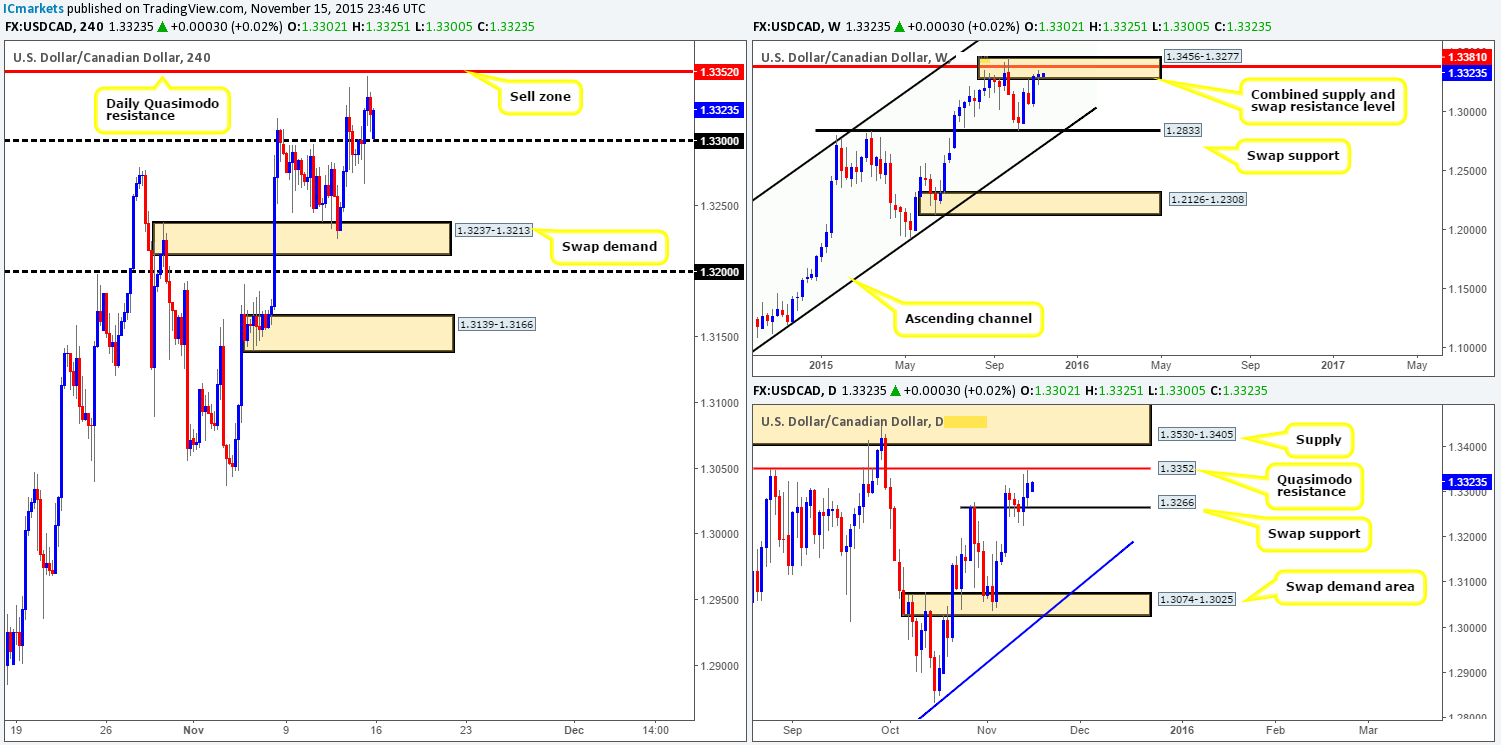
Weekly view: Considering that price was (and still is) trading within the borders of a combined supply/ swap resistance area seen at 1.3456-1.3277/1.3381, last week saw little noteworthy selling. In fact, the market ended the week 20 pips in the green at the close 1.3320! There are two ways in which one can look at this. On the one hand, this could be considered selling weakness within the weekly area, and prices may rally higher as a result. On the other hand, last week’s small range candle could be looked at as diminishing momentum, thus portending to a probable drop in value.
From where we’re standing, the last line of defense within this area is the swap resistance level located within the zone mentioned above at 1.3381 – A close above here will very likely send prices higher.
Weekly levels to watch this week fall in at: 1.3456-1.3277/1.3381.
Daily view: Winding down a level, the daily chart reveals that price sluggishly rebounded from swap support at 1.3266 last week, eventually forcing this market up to just below the Quasimodo resistance line at 1.3352 (positioned within the above said weekly supply/ swap resistance area). A rejection from this region this week could see this market tumble back down to at least the aforementioned swap support. A break higher, however, has the large supply at 1.3530-1.3405 to target.
Daily levels to watch this week fall in at: 1.3352/1.3266/ 1.3530-1.3405.
4hr view: In Friday’s report (http://www.icmarkets.com/blog/friday-13th-november-keep-an-eye-on-u-s-dollar-related-markets-around-1-30pm-gmt-today-heavy-market-action-expected/) we mentioned that our team was interested in shorting from the above said daily Quasimodo resistance level. As you can see though, price annoyingly missed this hurdle by all of three pips before dropping lower into the close.
This morning, however, saw the Loonie gap eighteen pips lower at the open 1.3302. This gap, as you can see, was quickly filled and price continues to display bullish strength for now. In the event that this strength remains going into today’s more liquid sessions, we see little stopping this pair reaching the above said daily Quasimodo resistance level. If this occurs, our team will look to short this number should lower timeframe confirmation present itself (confirmation required to avoid any fakeout that may take place).
A break below psychological support 1.3300, however, has the daily swap (support) level to target at 1.3266. Now, a short on the break and retest of 1.3300 is not something we’d be interested in due to how close the 1.3266 daily level is. Furthermore, looking to go long from this daily level would also be something we’d step aside from. Not only would you potentially be buying into weekly flow here, but also trading an already weak-looking daily level due to its sluggish response last week (see above).
Levels to watch/ live orders:
- Buys: Flat (stop loss: N/A).
- Sells: 1.3352 [Tentative – confirmation required] (Stop loss: dependent on where one confirms this level).
USD/CHF:
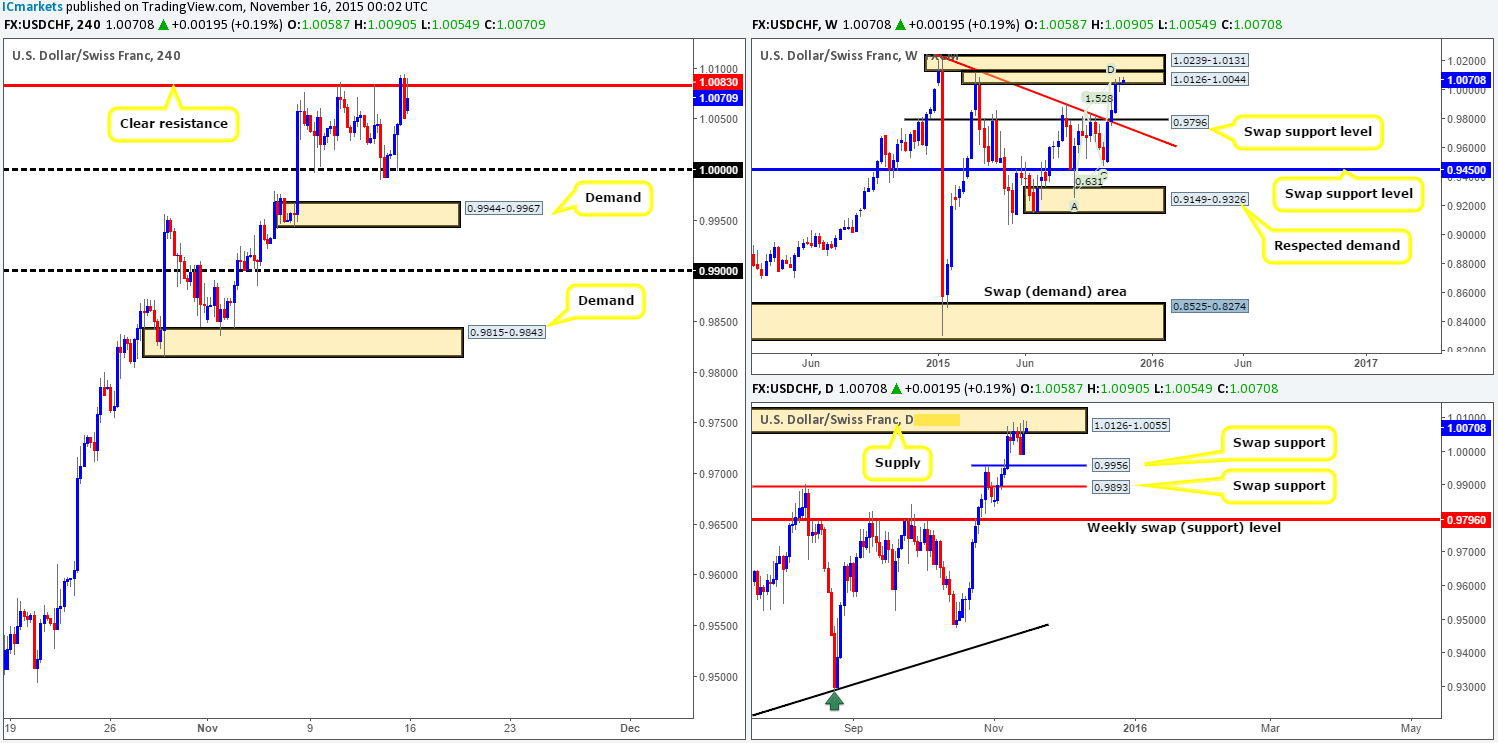
Weekly view: The balance of bids and offers here were clearly even last week by the close 1.0051. Price formed an indecision candle at the lower limits of a stacked weekly supply formation at 1.0126-1.0044 (upper zone is seen at 1.0239-1.0131), which merges nicely with an AB=CD Harmonic pattern completing around the 1.0046 region. Despite this tentative response here, we’re still biased to the sell-side of this market for the time being. Downside targets to keep an eye on this week and possibly the following week are the swap support level at 0.9796, and the recently broken trendline resistance-turned support (1.0239).
Weekly levels to watch this week fall in at: 1.0126-1.0044/0.9796/trendline resistance-turned support.
Daily view: From this viewpoint, one can see that the USD/CHF remained trading at the underside of supply coming in at 1.0126-1.0055 last week. No surprise there really as this zone ties in lovely with the weekly supply area mentioned above at 1.0126-1.0044. Should the sellers make an appearance here this week, we’ll be looking to the near-term swap support at 0.9956, followed by 0.9893 – another swap support level.
Daily levels to watch this week fall in at: 1.0126-1.0055/0.9956/0.9893.
4hr view: It’s pretty clear who came out victorious during Friday’s trade. A beautiful rally was seen from parity, forcing price to once again touch gloves with resistance seen at 1.0083. With trade action still kissing the underside of this barrier at this morning’s open 1.0058, we may see yet another decline from this region considering that it is positioned within both weekly and daily sell zones (see above). That being the case, our team is going to be keeping a close eye on how the lower timeframe action develops around this H4 number today. Supposing that we spot a lower timeframe short setup here, we’ll confidently take the trade, targeting parity first and foremost.
However, should this H4 level give way today, we then see little above on the H4 up until the 1.0239-1.0186 sell zone. Therefore a break above and retest of the current H4 level would, in effect, be a cue to begin looking for a confirmed entry long. Extreme caution would be needed with this trade, nonetheless, due to price still trading within higher timeframe supply.
Levels to watch/ live orders:
- Buys: Watch for offers to be consumed around 1.0083 and then look to trade any retest seen at this level (confirmation required).
- Sells: 1.0083 [Tentative – confirmation required] (Stop loss: dependent on where one confirms this level).
DOW 30:
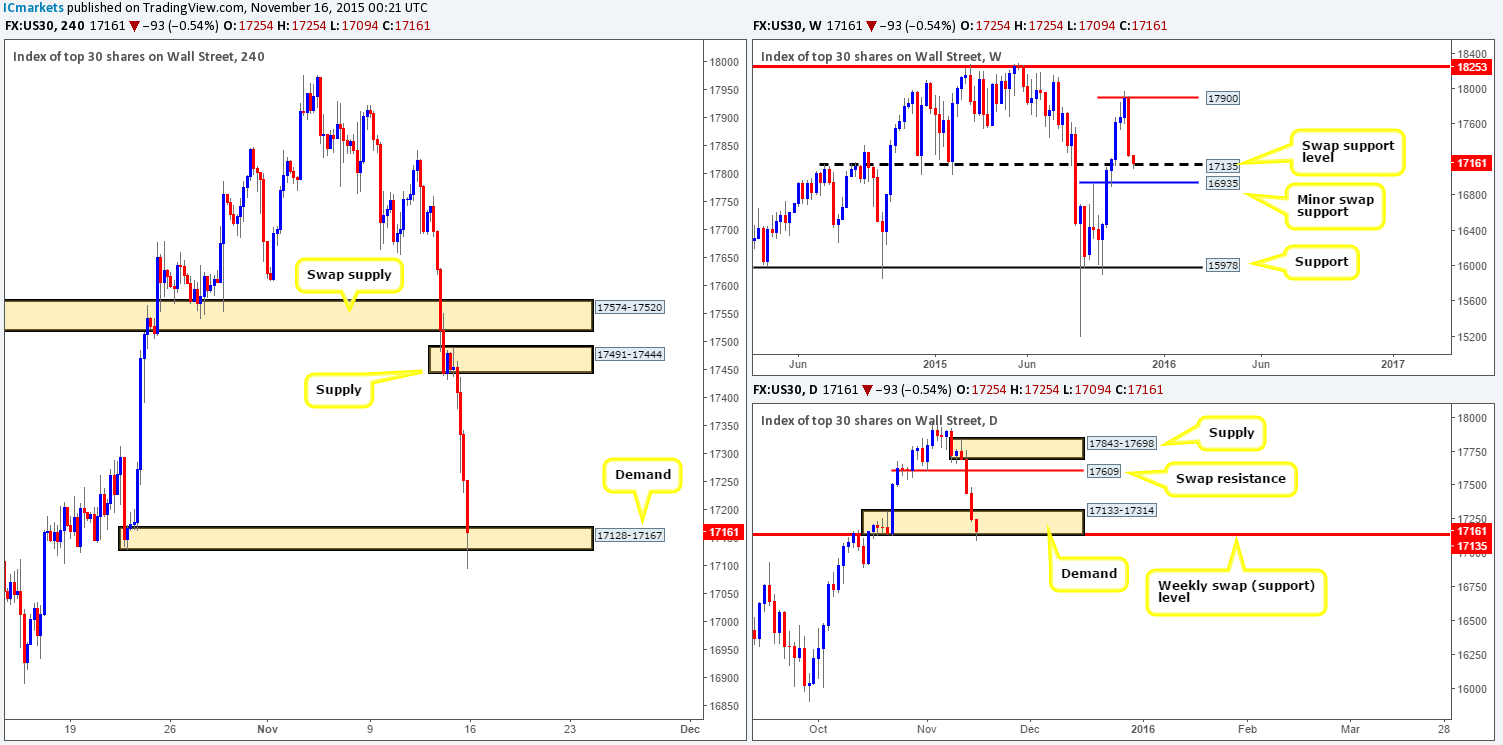
Weekly view: The DOW suffered a nasty decline in value last week from around the 17900 region, losing around 650 points and closing the week out just above a swap support level drawn from 17135 at 17254. Taking into consideration that the this week’s opening action has recently forced price down to the swap support level at 17135, it will be interesting to see what the lower timeframes have to report…
Weekly levels to watch this week fall in at: 17900/17135.
Daily view: Down in the pits of the daily timeframe, price ended the week buried within demand seen at 17133-17314. This area appears strong from both the momentum seen at the base, and also the additional support from the weekly swap support level at 17135. Recent action, however, as you can see, has drove price below this demand in what appears to be a fake lower to collect stops. Let’s see what the H4 has on offer.
Daily levels to watch this week fall in at: 17133-17314/17135.
4hr view: Following Friday’s precipitous decline, the DOW’s opening sell-off from 17254 has viciously drove through the H4 demand zone at 17128-17167, as well as the daily demand mentioned above.
With the above in mind, we mustn’t forget that at the same time price is now attacking the weekly swap (support) level at 17135. Therefore, to short this market now is certainly not something we’re interested in. The sell stops taken from below both the H4 and daily demand would likely be enough liquidity for well-funded traders to buy into. This – coupled with the weekly swap support at 17135, we are going to be looking for a lower timeframe long entry, preferably on the 30/60 minute, around the current H4 demand area, and the only target we see that stands out is the supply coming in at 17491-17444.
Levels to watch/ live orders:
- Buys: 17128-17167 [Tentative – confirmation required] (Stop loss: dependent on where one confirms this area).
- Sells: Flat (Stop loss: N/A).
XAU/USD: (Gold)
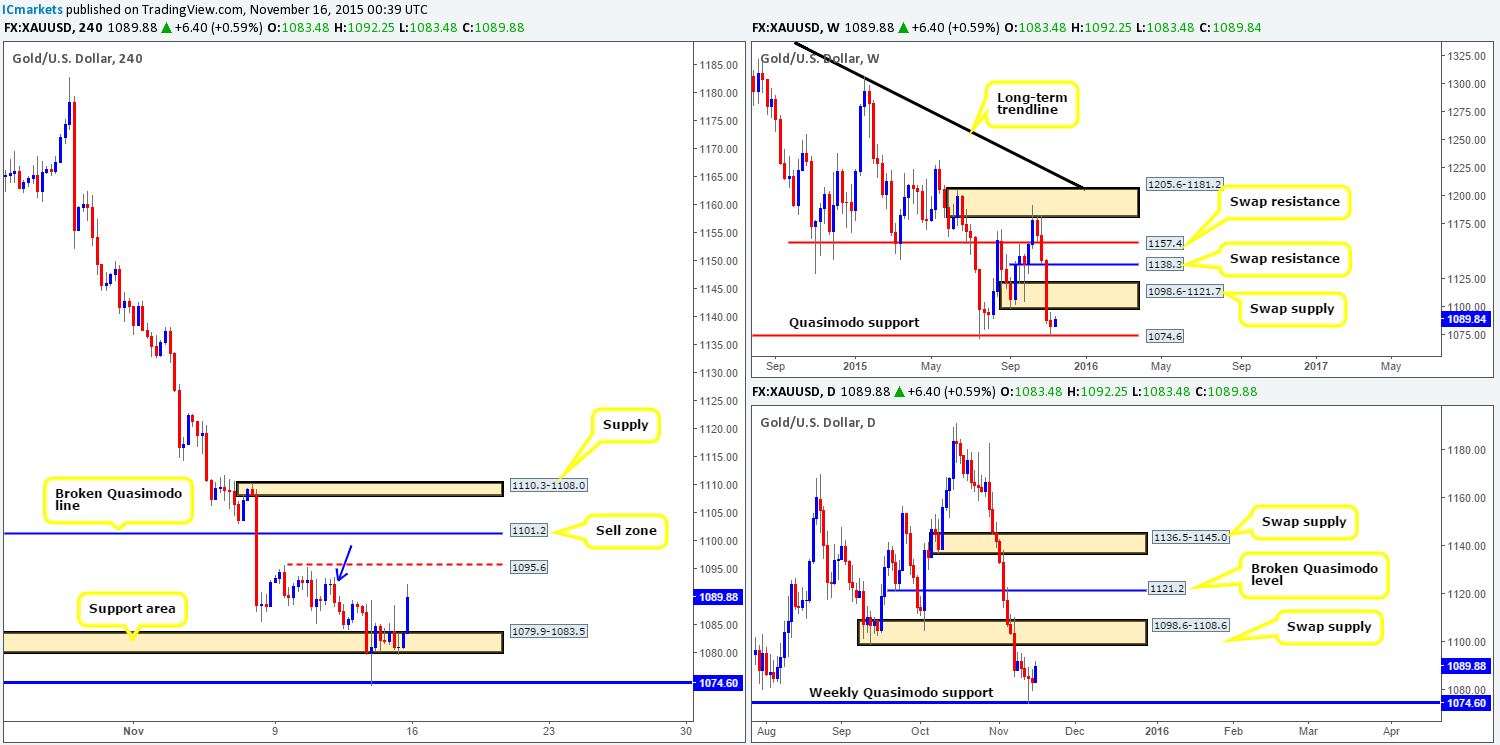
Weekly view: Overall, it was another relatively depressing week for the precious metal, losing around $5 in value by the close 1083.4. Now, in comparison to the prior losses, however, it appears that downside momentum has certainly eased. Technically, in our opinion, this was due to price recently plugging into bids sitting at the weekly Quasimodo support level at 1074.6. Providing that the buyers continue to defend this level this week, we may see price attack the underside of the demand-turned supply at 1098.6-1121.7. In the event that this level gives way, however, then the swap support level below it at 1027.6 is the next barrier to watch.
Weekly levels to watch this week fall in at: 1074.6/1027.6/1098.6-1121.7.
Daily view: Similar to the weekly timeframe, daily price is chalking up the same picture more or less. The only difference we see is that if the aforementioned weekly Quasimodo level does indeed give way, then instead of looking down to the weekly level 1027.6, there is a near-term daily swap (support) barrier to watch on the daily timeframe coming in at 1063.4.
Daily levels to watch this week fall in at: 1074.6/1098.6-1108.6/1063.4.
4hr view: As you can see, Friday’s action was relatively quiet with nothing really important to report other than yet another wick being stamped in at 1088.5 from the support area seen at 1079.9-1083.5. This morning’s open 1083.4, however, was completely the opposite. A strong wave of bids came into the market pushing Gold to highs of 1092.2 so far.
All in all, we feel this market is going to continue heading higher today despite the slight rebound being seen from supply marked with a blue arrow at 1093.4-1092.2. We see price taking out last Monday’s high at 1095.6 and connecting with the broken Quasimodo line at 1101.2. The reason for why should be obvious by now… Both higher timeframe charts are reacting well to the weekly Quasimodo support level mentioned above at 1074.6….
As far as looking to take advantage of a move higher, the best we can do is hope that a small pullback is seen to the support area so that we can look to enter long. If the above does come to fruition, we would still advise only entering long with confirmation since, other than this H4 area, there is little to stop price from continuing lower to revisit the weekly Quasimodo level.
Levels to watch/live orders:
- Buys: 1079.9-1083.5 [Tentative – confirmation required] (Stop loss: dependent on where one confirms this area).
- Sells: Flat (Stop loss: N/A).

