A note on lower timeframe confirming price action…
Waiting for lower timeframe confirmation is our main tool to confirm strength within higher timeframe zones, and has really been the key to our trading success. It takes a little time to understand the subtle nuances, however, as each trade is never the same, but once you master the rhythm so to speak, you will be saved from countless unnecessary losing trades. The following is a list of what we look for:
- A break/retest of supply or demand dependent on which way you’re trading.
- A trendline break/retest.
- Buying/selling tails/wicks – essentially we look for a cluster of very obvious spikes off of lower timeframe support and resistance levels within the higher timeframe zone.
- Candlestick patterns. We tend to only stick with pin bars and engulfing bars as these have proven to be the most effective.
We search for lower timeframe confirmation between the M15 and H1 timeframes, since most of our higher-timeframe areas begin with the H4. Stops are usually placed 5-10 pips beyond confirming structures.
EUR/USD:
Weekly gain/loss: + 74 pips
Weekly closing price: 1.1157
Weekly open price: 1.1167
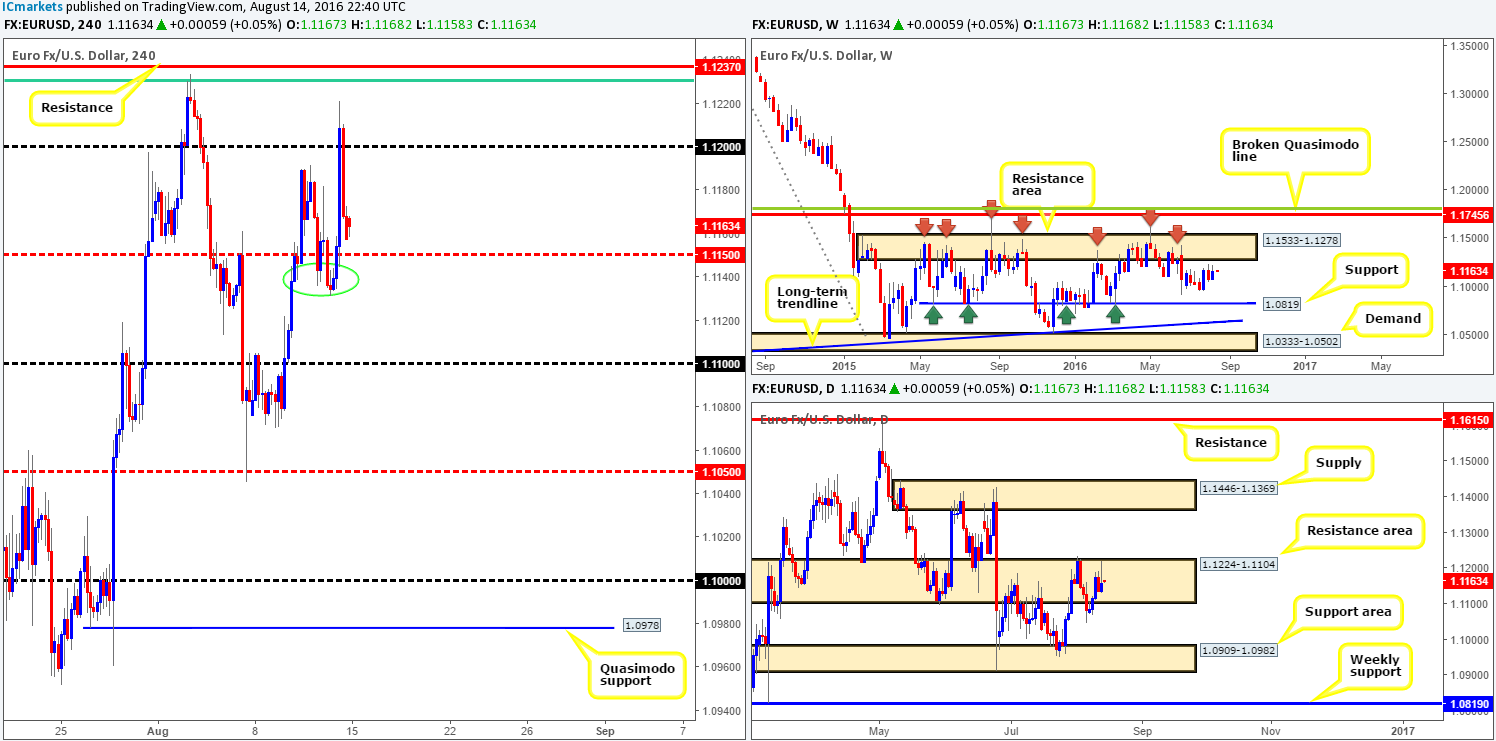
Weekly view: From the weekly chart, the candles show price continues to loiter just ahead of a major weekly resistance area coming in at 1.1533-1.1278. This zone has capped upside in this market since May 2015, so should price shake hands with this area this week, a downside move is expected.
Daily view: Despite the weekly picture, daily price remains trading within a daily resistance area seen at 1.1224-1.1104. In the event that the bears stamp further authority on this barrier this week, the next downside target to have noted comes in around the daily support area at 1.0909-1.0982. On the flip side, a break higher could see prices extend north towards a daily supply area at 1.1446-1.1369 (positioned within the above said weekly resistance area).
H4 view: A quick recap of Friday’s trade on the H4 shows that the EUR aggressively whipsawed through the 1.12 barrier, before closing day just above the H4 mid-way support 1.1150. This end-of-week-move was, as far as we can see, set in motion by weaker than expected US retail sales data.
Direction for the week: Given that there’s a chance the shared currency may pop higher to tag in the above said weekly resistance area this week, the strength of the daily resistance zone is put into question! As such, direction for the week is limited.
Direction for today: A clear break of the H4 lows circled in green around the 1.1135ish area would likely open the trapdoor for a move down to the 1.11 handle. Additionally, a break below the above noted lows would be a positive move for sellers within the current daily resistance area. Should 1.1150 be respected, however, the 1.12 hurdle would likely be the next line on the hit list, followed closely by a H4 resistance at 1.1237 and then the underside of the weekly resistance barrier.
Our suggestions: One could look to play this market intraday today, using 1.1150/1.1135 as an area to judge short-term direction (see above in bold). Nevertheless, In that the bigger picture is not, shall we say, trading in unison right now, our team has decided to step aside today and reassess going into tomorrow’s sessions.
Levels to watch/live orders:
- Buys: Flat (Stop loss: N/A).
- Sells: Flat (Stop loss: N/A).
GBP/USD:
Weekly gain/loss: – 148 pips
Weekly closing price: 1.2916
Weekly open price: 1.2920
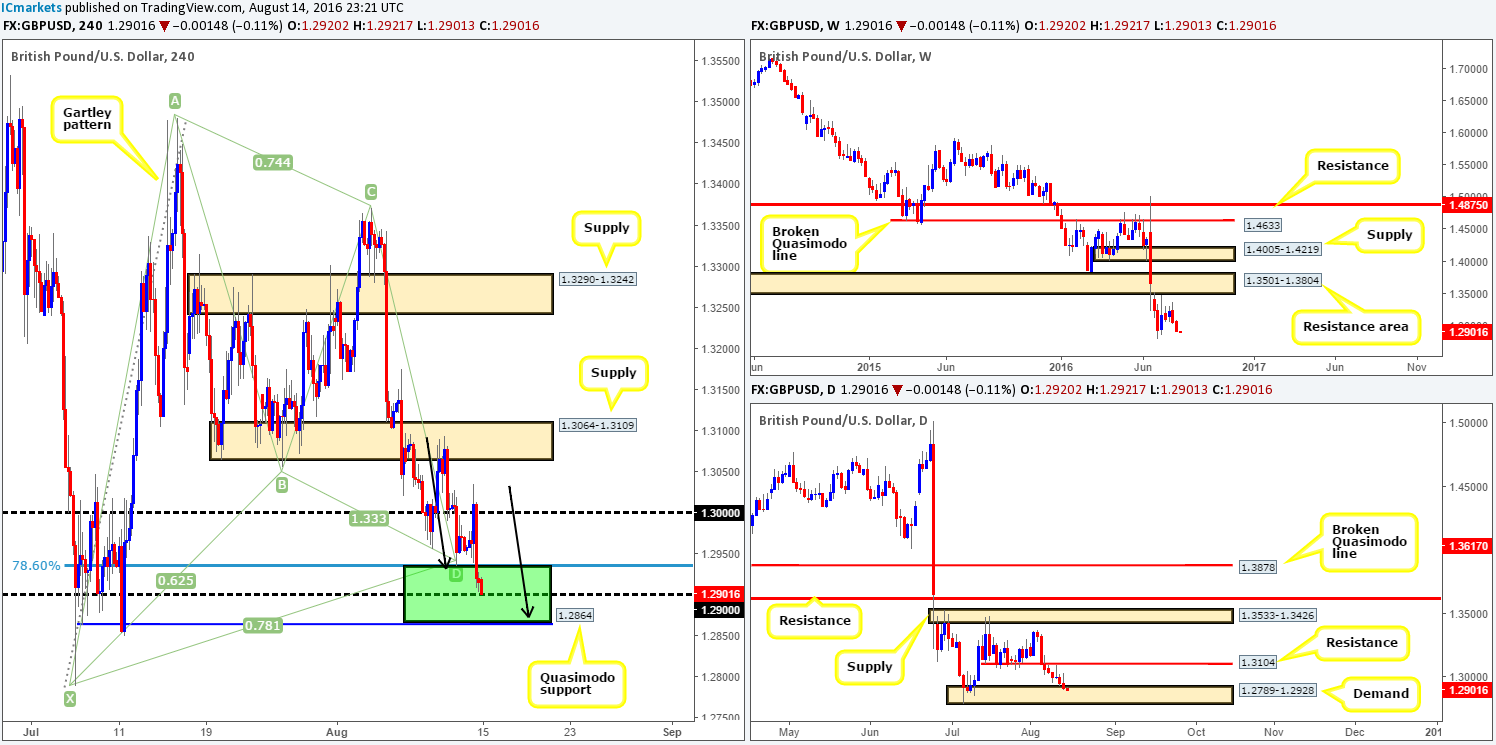
Weekly view: Following a clear-cut weekly bearish engulfing candle, the GBP followed-through last week with a sell off, bringing the currency to lows of 1.2903. As far as weekly structure is concerned we can see that there’s a weekly resistance area at 1.3501-1.3804, while to the downside there’s little support seen to the left of current price until the market reaches the 1.20 region (to see this, one will need to re-visit 1986).
Daily view: Looking down to the daily chart, however, price recently touched gloves with a daily demand base coming in at 1.2789-1.2928. Friday’s daily candle chalked up a relatively nice-looking inverted pin bar from this area, which when formed within or around an area of interest can sometimes be a powerful indicator that a bounce is on the cards. Should this come into view, the daily resistance level at 1.3104 would likely be the next target in the firing range.
H4 view: Friday’s weaker than expected US retail sales reading boosted the GBP’s attractiveness, consequently forcing H4 price to break above the key figure 1.30. After failing to sustain gains beyond this number, however, the market tumbled lower, resulting in price rounding the week off just ahead of the 1.29 handle.
Direction for the week: We’re sure when we write this that most would agree that the weekly chart looks frighteningly bearish! While this may be true, nevertheless, daily action remains kissing the top edge of a demand zone. Therefore, until this zone has been engulfed, direction, like the EUR/USD, is limited for the time being.
Direction for today: Despite the weekly chart’s position, our team believes that cable will likely bounce higher today/tomorrow. Here’s why:
- Price is now seen flirting with the 1.29 handle.
- Directly below 1.29 is a H4 Quasimodo support at 1.2864, which merges beautifully with a H4 AB=CD approach (see black arrows).
- The above levels are all related to a larger H4 harmonic Gartley reversal zone fixed between 1.2864/1.2935.
- And finally, let’s not forget that the daily picture is currently occupying a daily demand base at 1.2789-1.2928.
Our suggestions: Since the H4 harmonic bullish pattern has formed within a bearish downtrend we’d highly recommend waiting for lower timeframe confirmation to form before placing capital on the line. Optimal entry, as far as we can see, would be between 1.2864/1.29. Aggressive stops could be placed directly below this zone, while more conservative stops may be best set beyond the X point of the H4 harmonic pattern around the 1.2779ish area.
In regards to lower timeframe confirmation, this could be in the form of an engulf of supply followed by a retest, a trendline/break retest or simply a collection of well-defined buying tails seen around the harmonic reversal zone. This, in our opinion, will likely get you in at a better price and potentially avoid unnecessary drawdown.
Levels to watch/live orders:
- Buys: 1.2864/1.29 region [Tentative – confirmation required] (Stop loss: dependent on where one confirms this area).
- Sells: Flat (Stop loss: N/A).
AUD/USD:
Weekly gain/loss: + 31 pips
Weekly closing price: 0.7646
Weekly opening price: 0.7652
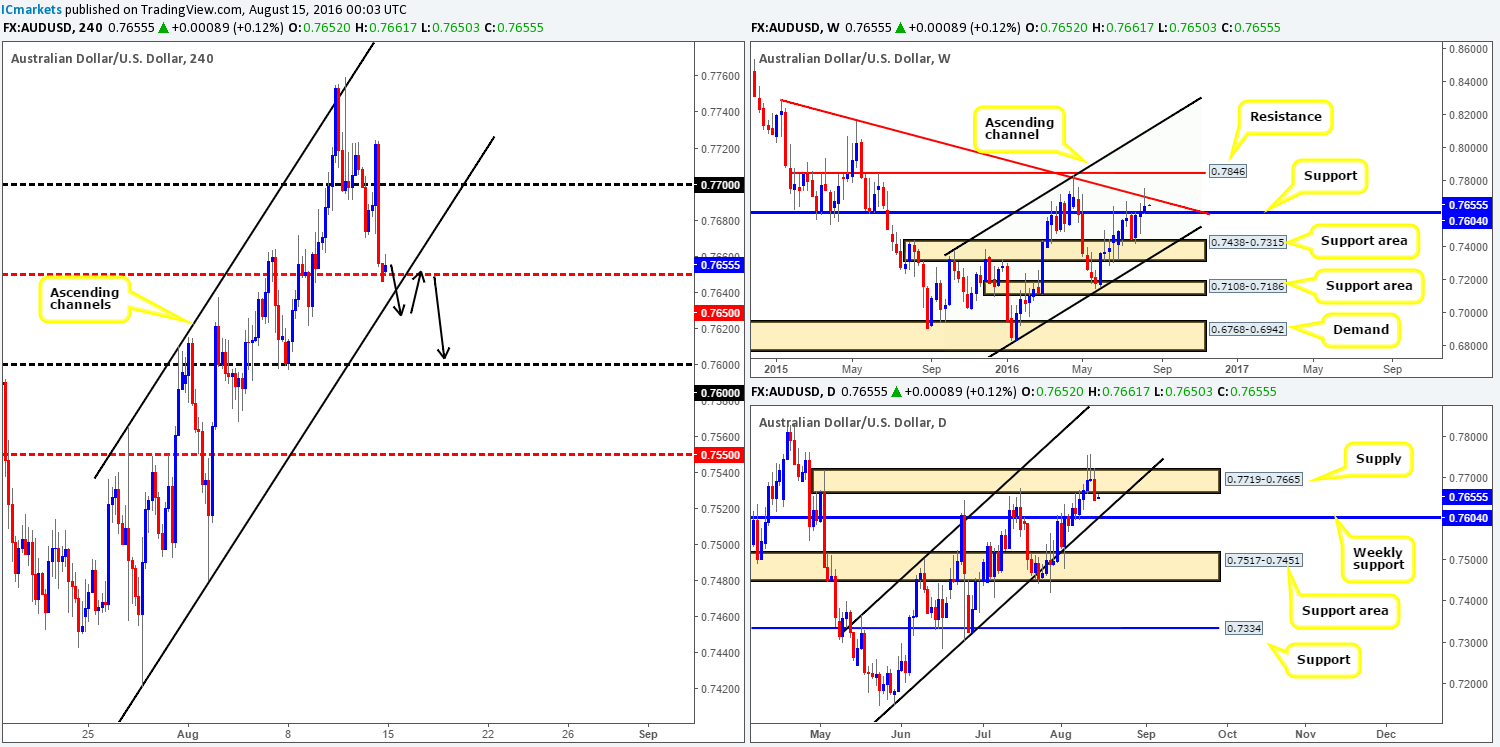
Weekly view: The past week saw the Aussie rotate to the downside from a weekly trendline resistance extended from the high 0.8895. Providing that offers hold ground here, a push back down to test the weekly support boundary at 0.7604 is likely on the cards this week
Daily view: From this angle, last week’s back-to-back daily selling wicks sent the pair lower on Friday, suggesting that price will likely connect with the daily channel support line taken from the low 0.7148 sometime this week (merges with the above said weekly support level).
H4 view: A quick look at recent dealings on the H4 chart shows that price sold off going into the week’s close, following an aggressive whipsaw through the 0.77 handle. The initial push higher was supported by unfavorable US retail sales data.
Direction for the week: Going by what we’ve noted on the higher-timeframe picture, lower prices are initially likely to be seen. Once/if price touches base with the above noted weekly support level a bounce higher would then be expected. Assuming that this is correct, we may see price simply compress between the weekly trendline resistance and the weekly support level!
Direction for today: Well, according to the H4 chart, the commodity currency is in somewhat of a buy zone right now: the H4 mid-way support 0.7650 coupled with a H4 ascending channel support line from the low 0.7420. While a bounce from here is possible, one must take into account that both the weekly and daily charts indicate lower prices could be seen (see above).
Our suggestions: In light of the above points, our team has humbly decided to pass on buying from the 0.7650 region. With that being the case, we’re now watching for a break below both 0.7650/H4 channel support today. A decisive push below here would likely open the doors for price to challenge the 0.76 handle – essentially the weekly support we discussed above.
To trade this possible intraday move, look for price to retest the 0.7650 area following a close lower (see black arrows). Despite this trade being supported by higher-timeframe flows, we’d still recommend waiting for lower timeframe confirmation before pulling the trigger (see the top of this report), since fakeouts around psychological boundaries are common view.
Levels to watch/live orders:
- Buys: Flat (Stop loss: N/A).
- Sells: Watch for price to close below the H4 mid-way support 0.7650/H4 channel support (0.7420) and look to trade any retest seen thereafter (lower timeframe confirmation required).
USD/JPY:
Weekly gain/loss: – 53 pips
Weekly closing price: 101.26
Weekly opening price: 101.11
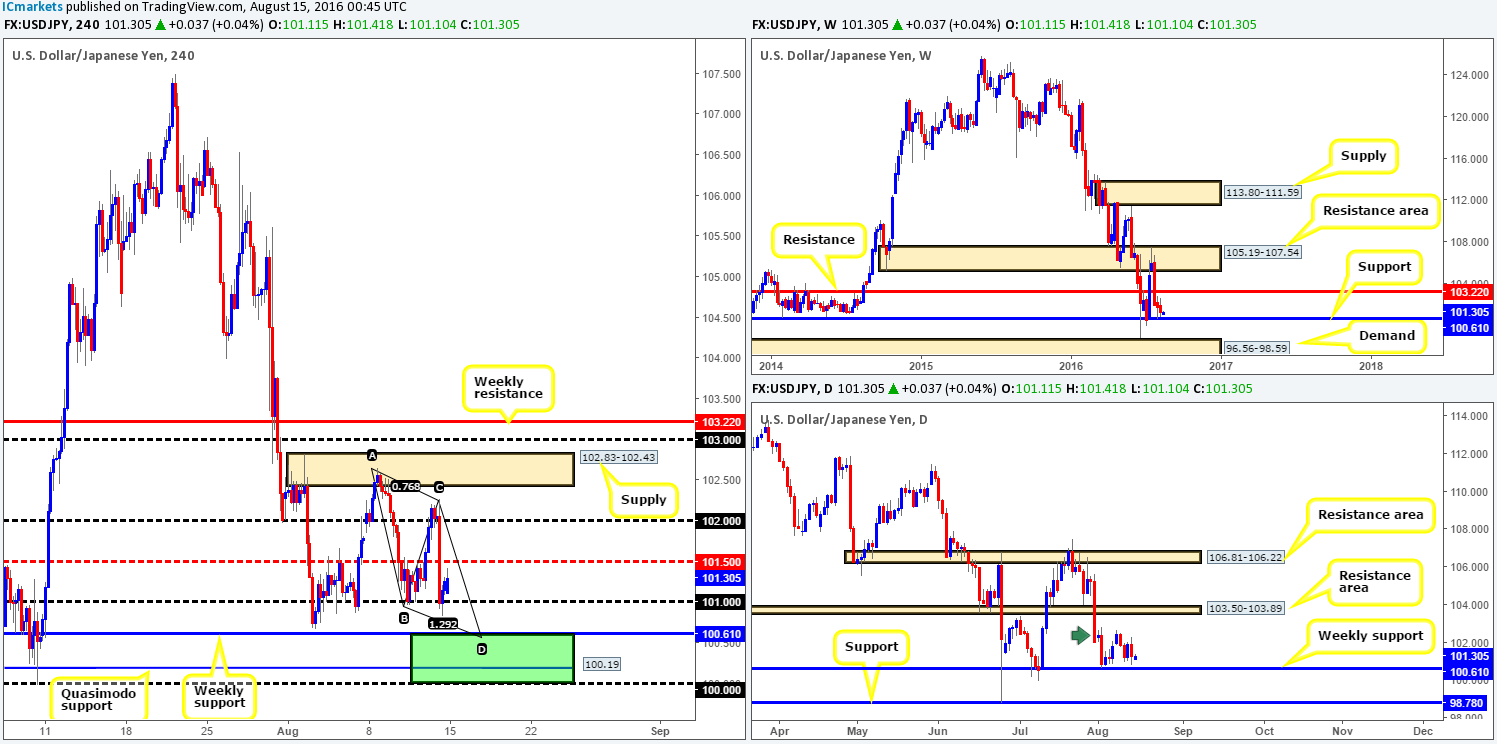
Weekly view: From this viewpoint, we can see that weekly action remains hovering just ahead of a weekly support level at 100.61. There is clearly some buying interest seen around this area, how much though is difficult to judge at this point. On the assumption that the buyers do turn things around here, the next upside target to have an eyeball on can be seen at 103.22: a weekly resistance level. A break below the current weekly level would, however, likely place the candles within striking distance of a weekly demand area at 96.56-98.59.
Daily view: Down here on the daily chart, nevertheless, price is seen ranging between the above said weekly support level and a minor daily supply area 102.83-101.97 (green arrow). A break above this area will likely force price to collide with a daily resistance zone drawn from 103.50-103.89, while a push below the weekly support could place the daily support level at 98.78 in the limelight.
H4 view: Friday’s US session saw the USD/JPY aggressively sell off following a less-than-impressive US retail sales report. It was only once price shook hands with the 101 handle did we see things begin to stabilize going into the week’s close.
Direction for the week: Seeing as how price is lurking nearby a weekly support level (see above) at the moment, direction for the week will likely be north.
Direction for today: In view of the direction for the week, there’s a very interesting buy zone being seen on the H4 chart right now: the 100.00/100.61 region (green box). Building a case for entry here we have the following:
- The weekly support at 100.61.
- A H4 Quasimodo support at 100.19.
- Key figure 100.00.
- A H4 AB=CD approach taken from the high 102.65.
Our suggestions: A long trade from the above said H4 green zone is a high-probability reversal area in our book. Therefore, our team has set an alert at the 100.60 mark. Once/if this triggers, our team will begin hunting for lower timeframe buy entries into the market from here (see the top of this report for lower timeframe entry techniques), targeting the 101 handle as a first take-profit target. Why we still require lower timeframe confirmation here is simply due to the overall trend this pair is in right now.
Levels to watch/live orders:
- Buys: 100.00/100.61 region [Tentative – confirmation required] (Stop loss: dependent on where one confirms this area).
- Sells: Flat (Stop loss: N/A).
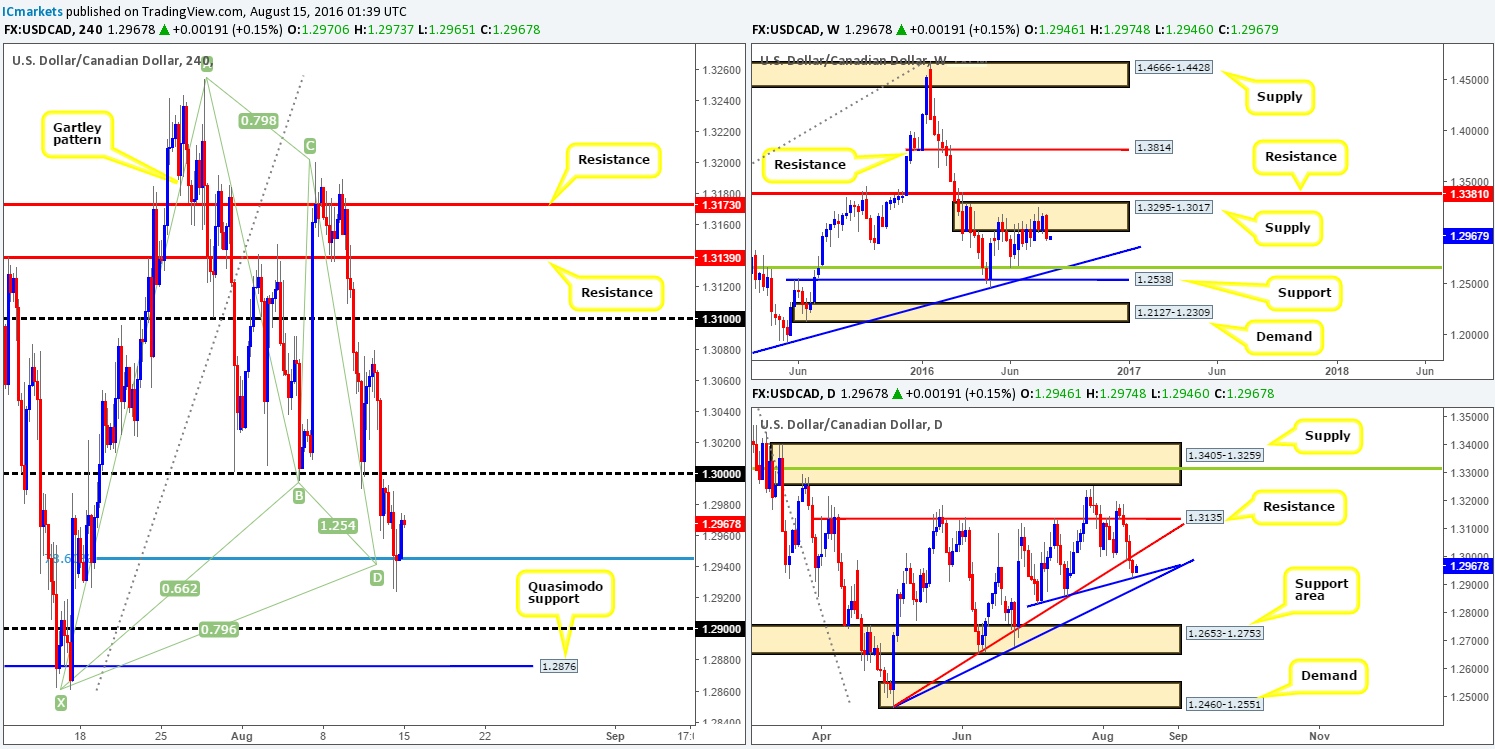
USD/CAD:
Weekly gain/loss: – 216 pips
Weekly closing price: 1.2948
Weekly opening price: 1.2946
Weekly view: The past week saw the USD/CAD sell off from within the weekly supply area at 1.3295-1.3017, engulfing two prior weekly candle bodies. A move like this could encourage further selling in this market this week and possibly bring the pair down to a weekly trendline support extended from the high 1.1278 (intersects beautifully with a weekly Fib support line at 1.2649).
Daily view: Despite the offered tone seen across the market last week, we can also see that by the week’s end price did in fact test a daily trendline support taken from the low 1.2831, and has so far held firm. A bullish run from here would likely bring the pair up to a recently broken daily trendline support-turned resistance (1.2460).
H4 view: Friday’s lower than expected US retail sales data brought the unit down to lows of 1.2924, with price eventually establishing support around a H4 harmonic Gartley reversal point at 1.2945, namely the 78.6% Fib support. It is a shame but it looks like we may have missed the boat here! Longs from this line, coupled with the recent touch of the daily trendline support makes for a beautiful area to look for a bounce from. We say bounce here simply because of the position price is in on the weekly chart (see above).
Direction for the week: Until both the nearby daily trendline supports (1.2460/1.2831) are taken out, direction for this week is challenging, despite weekly action trading from a weekly supply zone right now.
Direction for today: Today’s direction is also difficult to pin down. Therefore, what we’ll do is list the levels we currently have noted down for this pair:
- The key figure 1.30 is interesting since not only is it a number watched by many, but it fuses with the daily trendline resistance extended from the low 1.2460. Furthermore, let’s not forget that by shorting 1.30 we’re trading in-line with weekly flow.
- The H4 Quasimodo support at 1.2876. Not only does this provide a beautiful line for price to whipsaw through the 1.29 handle to, but the Quasimodo barrier intersects nicely with the lowest daily trendline support taken from the low 1.2460. By entering long from this line, however, you’d effectively be buying into weekly flow, so caution is advised here!
Levels to watch/live orders
- Buys: 1.2876 region [Tentative – confirmation required] (Stop loss: dependent on where one confirms this area).
- Sells: 1.30 region [Tentative – confirmation required] (Stop loss: dependent on where one confirms this area).
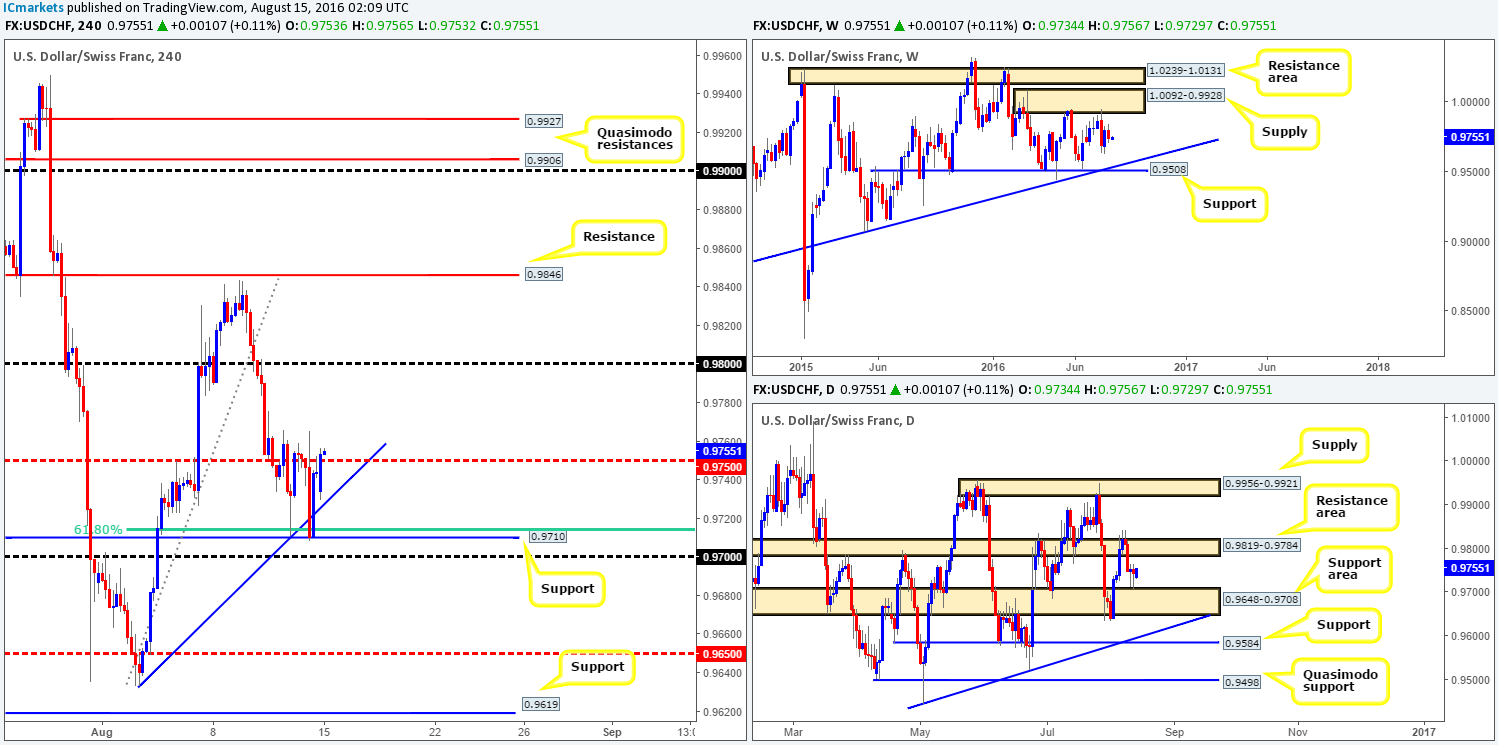
USD/CHF:
Weekly gain/loss: – 55 pips
Weekly closing price: 0.9744
Weekly opening price: 0.9734
Weekly view: The buyers and sellers remain battling for position between weekly supply coming in at 1.0092-0.9928 and a weekly support level drawn from 0.9508 (merges with a weekly trendline support extended from the low 0.8703).
Daily view: Down here on the daily chart, both Thursday and Friday’s sessions chalked up relatively nice-looking buying tails around the top of edge of a daily support area at 0.9648-0.9708. Yet, even if this is enough to encourage buyers into the market this week, the next upside target does not leave much wiggle room: the daily resistance area seen at 0.9819-0.9784.
H4 view: Reviewing Friday’s movement on the H4 chart reveals that price was aggressively offered going into US trading on the back of poor US retail sales data. This, as you can see, forced price to momentarily surpass the H4 trendline support extended from the low 0.9633 and tag in bids from H4 support (bolstered by a H4 61.8% Fib support at 0.9714) before bouncing back to highs of 0.9752 into the close.
Direction for the week: It’s likely that prices will pop north to greet the aforementioned daily resistance area. A break above here could set the stage for further continuation up to daily supply at 0.9956-0.9921 (sits within the lower edge of weekly supply mentioned above).
Direction for today: With this morning’s opening H4 candle closing above the H4 mid-way resistance 0.9750, there’s a good chance that the Swissy will continue to be pulled up to the 0.98 region today (located within the aforementioned daily resistance area).
Our suggestions: Watch for price to retest the 0.9750 level as support. If prices hold firm here, we’ll begin hunting for lower timeframe entries into the market (see the top of this report for lower timeframe entry techniques), targeting the 0.98 area.
Levels to watch/live orders:
- Buys: 0.9750 region [Tentative – confirmation required] (Stop loss: dependent on where one confirms this area).
- Sells: Flat (Stop loss: N/A).
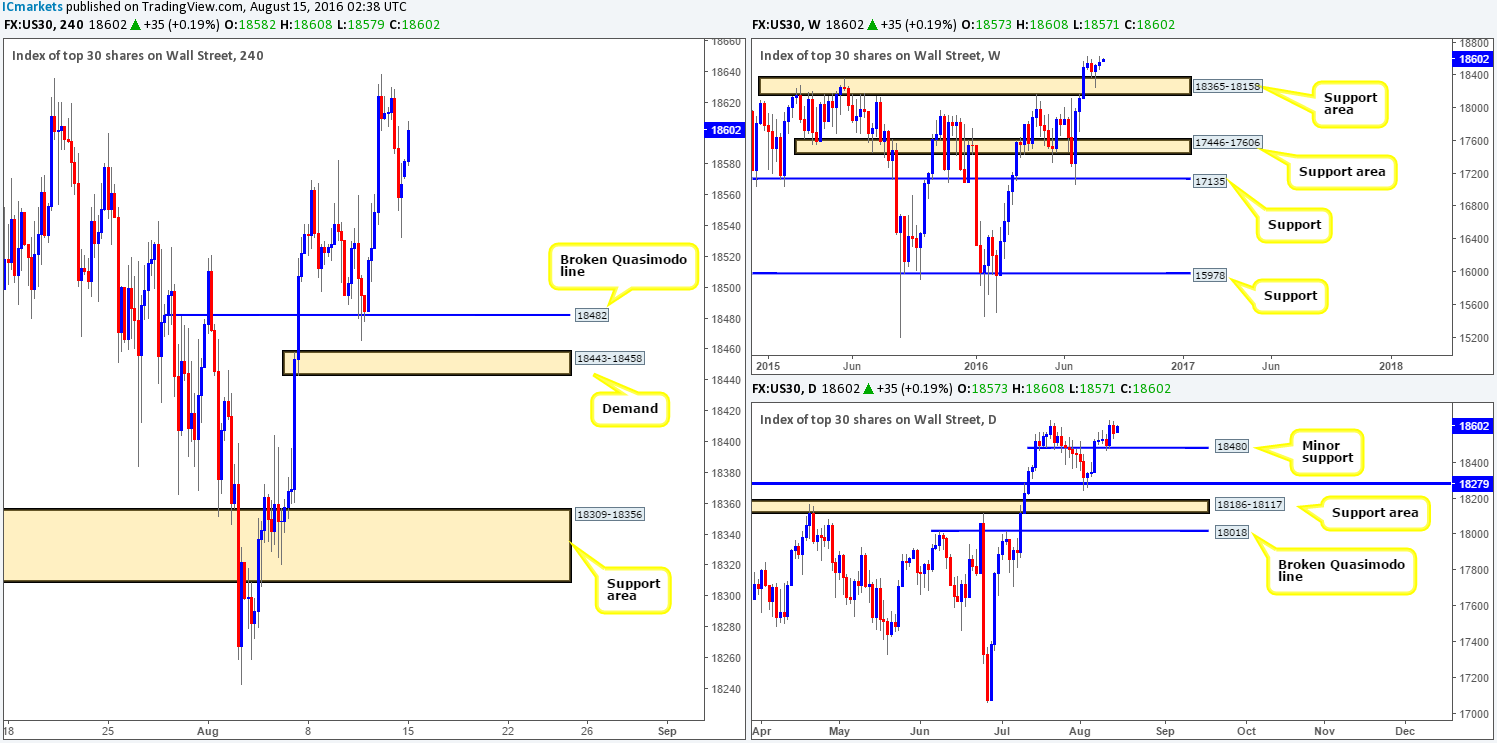
DOW 30:
Weekly gain/loss: + 44 points
Weekly closing price: 18567
Weekly opening price: 18573
Weekly view: The previous week’s action saw the equity market peek to all-time highs of 18639, but as you can see from the weekly chart, price failed to hold this momentum beyond this number. Nevertheless, given the circumstances, our team firmly believes that higher prices are likely on the horizon for the DOW in the near future.
Daily view: Should the index pullback this week, daily support at 18480 will likely cap this move as it did last week. Therefore, do keep a close eye on this level as it could provide a nice base in which to buy from!
H4 view: Friday’s US sessions saw the stock market tumble lower on the back of poor US retail sales data. Poor sales is never a good sign for US companies, as less sales equals less profits. Price did, however, find a pocket of support around the 18532 region hours before the close, which has spurned further buying this morning.
Direction for the week: There’s only one direction we feel this market is likely headed this week and that is northbound!
Direction for today: While the direction for the week is north, there’s a chance that the unit may push lower to connect with the H4 broken Quasimodo line at 18482 (essentially the same price level as the minor daily support we discussed above), before fresh highs are recorded.
Our suggestions: Watch for price to test the H4 broken Quasimodo line at 18482 today. Should this come into view and the index holds firm, wait for price to chalk up lower timeframe confirmation to enter long (see the top of this report). The reason we recommend this is simply because fixed levels such as this one here, has ‘fake me out’ written all over it! In the event that the above scenario plays out, we’d look to hold the position with the expectation of price clocking a new all-time high.
Levels to watch/live orders:
- Buys: 18482 region [Tentative – confirmation required] (Stop loss: dependent on where one confirms this area).
- Sells: Flat (Stop loss: N/A)
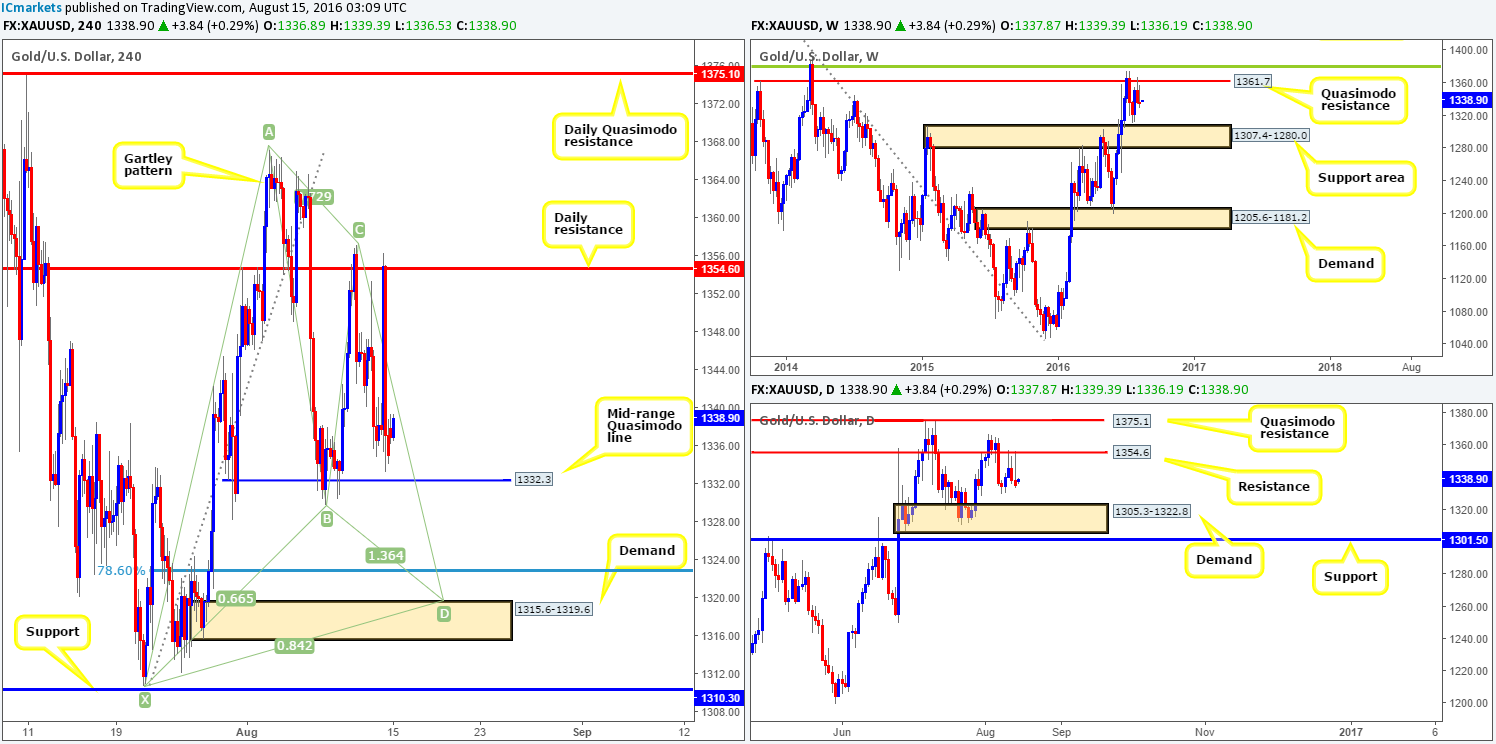
GOLD:
Weekly gain/loss: – $1.6
Weekly closing price: 1335.0
Weekly opening price: 1337.8
Weekly view: Despite last week’s bout of selling the yellow metal still remains trading mid-range in our opinion, between a weekly Quasimodo resistance level at 1361.7 and a weekly support area at 1307.4-1280.0. Both zones carry equal weight.
Daily view: From the other side of the field, daily price established itself around a daily resistance level penciled in at 1354.6 last week. Structurally, this is likely to send the gold market lower this week down to daily demand drawn from 1305.3-1322.8 (sits within the above said weekly support area).
H4 view: As already mentioned above, daily resistance played a vital role in holding prices lower last week. This was especially true on Friday when US retail sales data came in lower than expected, eventually pushing the market to lows of 1333.2 by the close.
Direction for the week: Higher-timeframe structure suggests a push lower will likely be seen going into the week. Should this come to fruition though, expect some opposition around the daily demand area at 1305.3-1322.8, which as we already know sits within the above said weekly support zone.
Direction for today: is likely to be southbound.
Our suggestions: Given the above notes, entering long from the H4 mid-range Quasimodo line at 1332.3 is not something our team would stamp as high probability. Therefore, we’re going to be watching for a close below the above said H4 broken Quasimodo line, for a retest trade, targeting H4 demand at 1315.6-1319.6. We would recommend waiting for lower timeframe confirmation to form (see the top of this report) prior to pulling the trigger simply to avoid any fakeout seen on the retest.
And finally, should price reach this H4 demand base, all of our short positions are to be liquidated and we’ll then go about looking to possibly enter long at market (dependent on the approach and time of day) from this area. However, do be prepared for price to drive below this zone before buyers step in! The reason as to why is because along with the H4 demand and it’s supporting higher-timeframe demands (see above), we also have a merging H4 harmonic Gartley reversal zone between the H4 Fib 78.6% support at 1322.7 and the X point of the harmonic pattern at 1310.7.
Levels to watch/live orders:
- Buys: 1315.6-1319.6 [Dependent on the approach and time of day a market long is possible] (Stop loss: below the X point of the H4 harmonic formation: 1309.1, which is, as you can see, set just beyond the H4 support at 1310.3).
- Sells: Watch for price to close below the H4 mid-range Quasimodo support at 1332.3 and look to trade any retest seen thereafter (lower timeframe confirmation required).
