A note on lower timeframe confirming price action…
Waiting for lower timeframe confirmation is our main tool to confirm strength within higher timeframe zones, and has really been the key to our trading success. It takes a little time to understand the subtle nuances, however, as each trade is never the same, but once you master the rhythm so to speak, you will be saved from countless unnecessary losing trades. The following is a list of what we look for:
- A break/retest of supply or demand dependent on which way you’re trading.
- A trendline break/retest.
- Buying/selling tails/wicks – essentially we look for a cluster of very obvious spikes off of lower timeframe support and resistance levels within the higher timeframe zone.
- Candlestick patterns. We tend to only stick with pin bars and engulfing bars as these have proven to be the most effective.
We search for lower timeframe confirmation between the M15 and H1 timeframes, since most of our higher-timeframe areas begin with the H4. Stops are usually placed 5-10 pips beyond confirming structures.
EUR/USD:
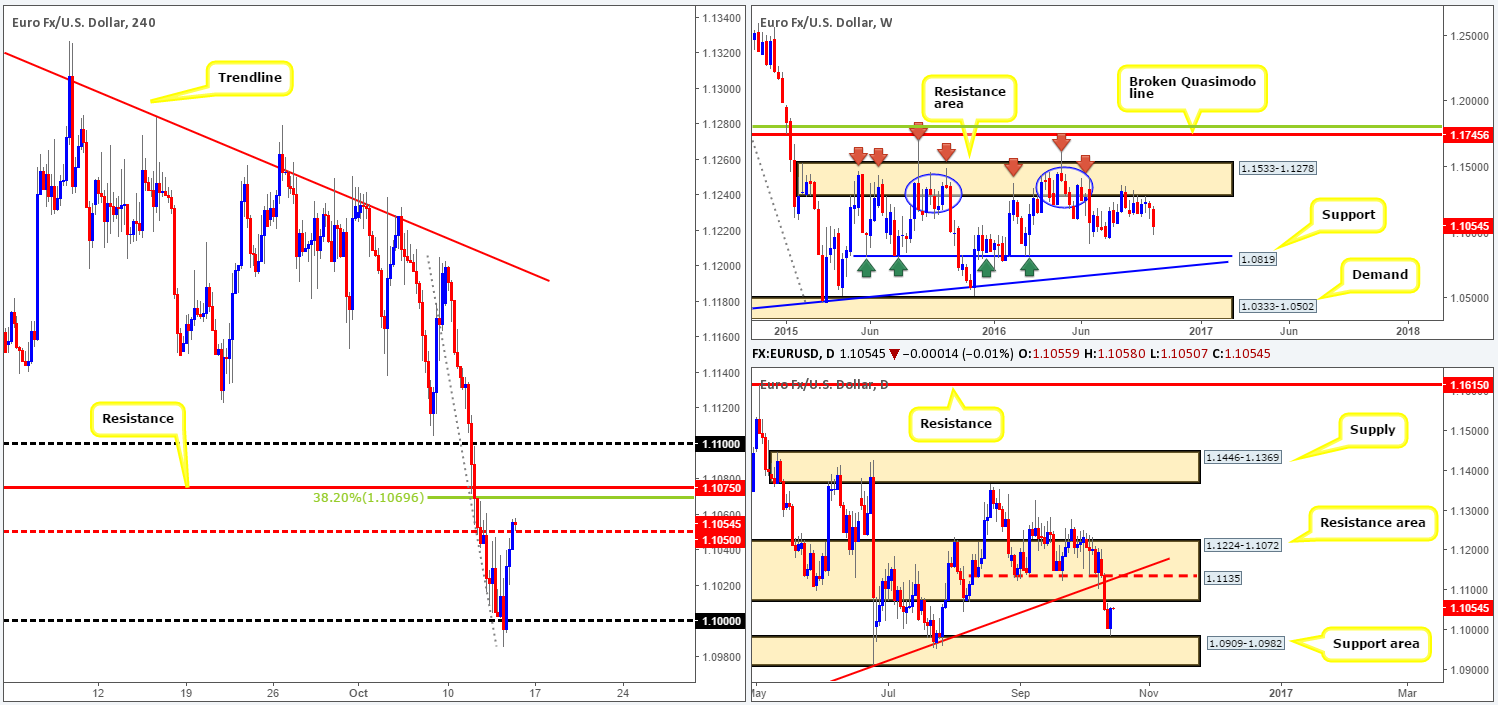
Following three days of consecutive losses, yesterday’s action saw the shared currency stage a reasonably strong recovery off the key figure 1.10. The move, as you can see, erased all of Wednesday’s losses and nudged price above the H4 mid-way resistance 1.1050 into the close, likely clearing the path north up to H4 resistance at 1.1075. Well done to any of our readers who managed to enter long from the 1.10 region as this was a noted move to keep an eye on in Thursday’s briefing.
Considering that price also bottomed out just ahead of a daily support area drawn from 1.0909-1.0982, should we be looking to buy the pair at this time? To our way of seeing things, entering long right now is a risky play. Not only is there the aforementioned H4 resistance level lurking just ahead of current price and a H4 38.2% Fib level at 1.1069, but there’s also the underside of a daily resistance area seen at 1.1072 to contend with.
Our suggestions: Personally, we do not imagine price will close above 1.1075 today. As a result, selling from this boundary may be something to consider. We would, nevertheless, need to see some form of lower timeframe confirmation before shorting (see the top of this report for ideas on how to enter on the lower timeframes), due to the possibility of a fakeout up to the 1.11 figure. On top of this, traders may also want to bear in mind that the US dollar is in the limelight today from midday onwards GMT, which includes a speech from Fed Chair Janet Yellen at 5.30pm.
Levels to watch/live orders:
- Buys: Flat (Stop loss: N/A).
- Sells: 1.1075 region ([lower timeframe confirmation required prior to pulling the trigger] Stop loss: dependent on where one confirms this area).
GBP/USD:
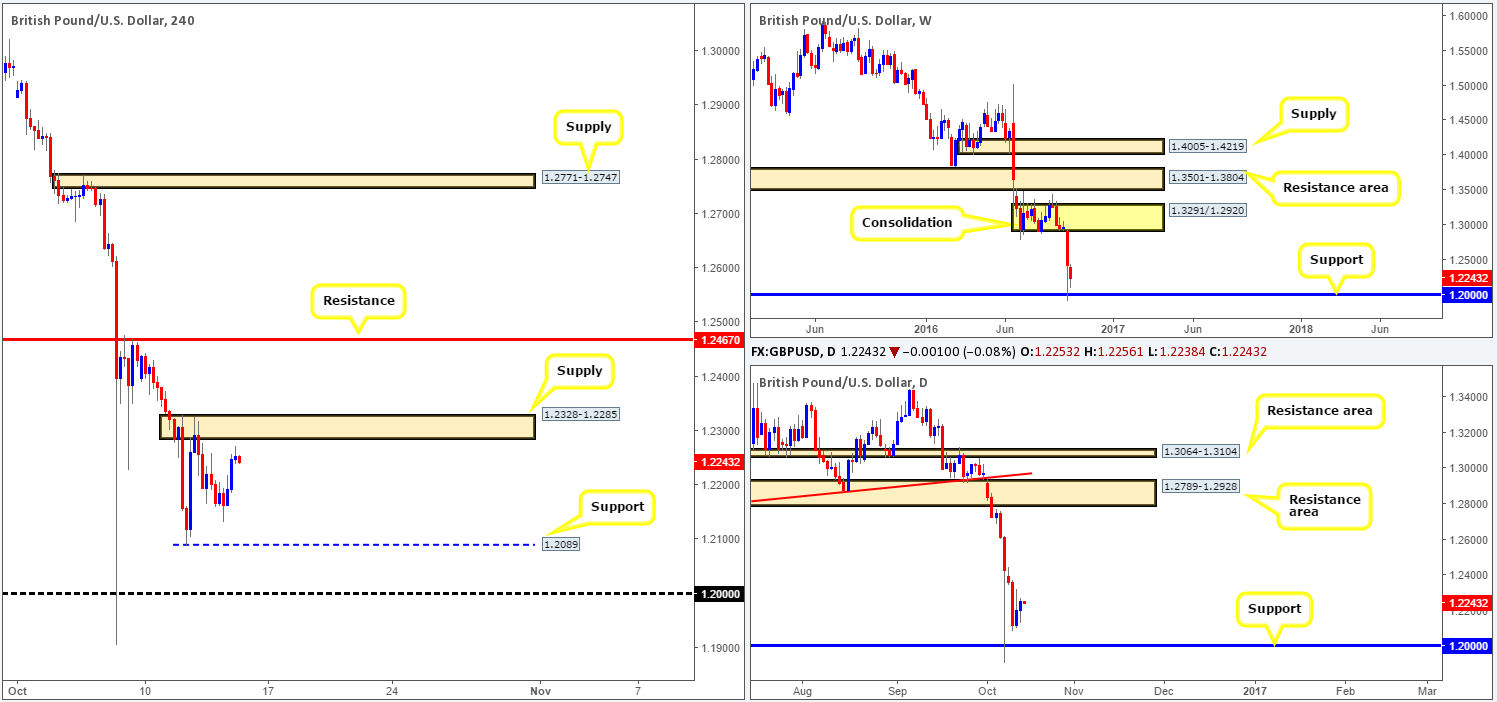
During the course of yesterday’s sessions, dollar losses nudged the pound higher, consequently clocking highs of 1.2272 by the day’s end. By and large, the H4 candles are seen capped by a support (Tuesday’s low) at 1.2089 and a supply penciled in at 1.2328-1.2285. Though, given that the bigger picture shows very little support until 1.20, our team feels that, at least from a technical standpoint, the pair will likely selloff in the not so distant future.
With that in mind, there’s two ways our team feels one could consider approaching this market:
- Wait for a second retest of the above mentioned H4 supply. This – coupled with a reasonably sized H4 bear candle would, at least in our opinion, be sufficient enough to permit a short from here, targeting 1.2089, followed by the 1.20 neighborhood.
- Look for a close below and retest of 1.2089. However, we would require some form of lower timeframe confirmation following the retest (see the top of this report) prior to pulling the trigger here to avoid any whipsaws through the level.
On the data front, we have the BoE Gov. Mark Carney speaking today, as well as a heavy round of US dollar news set to hit the wire from midday onwards GMT. Therefore, traders will want to tread carefully during this time.
Levels to watch/live orders:
- Buys: Flat (Stop loss: N/A).
- Sells: 1.2328-1.2285 ([H4 bearish candle required prior to pulling the trigger] Stop loss: beyond the trigger candle, however, the safest location would be beyond the supply itself around the 1.2330ish area). Watch for a close below 1.2089 and look to trade any retest seen thereafter ([lower timeframe confirmation required] Stop loss: dependent on where one confirms this level).
AUD/USD:
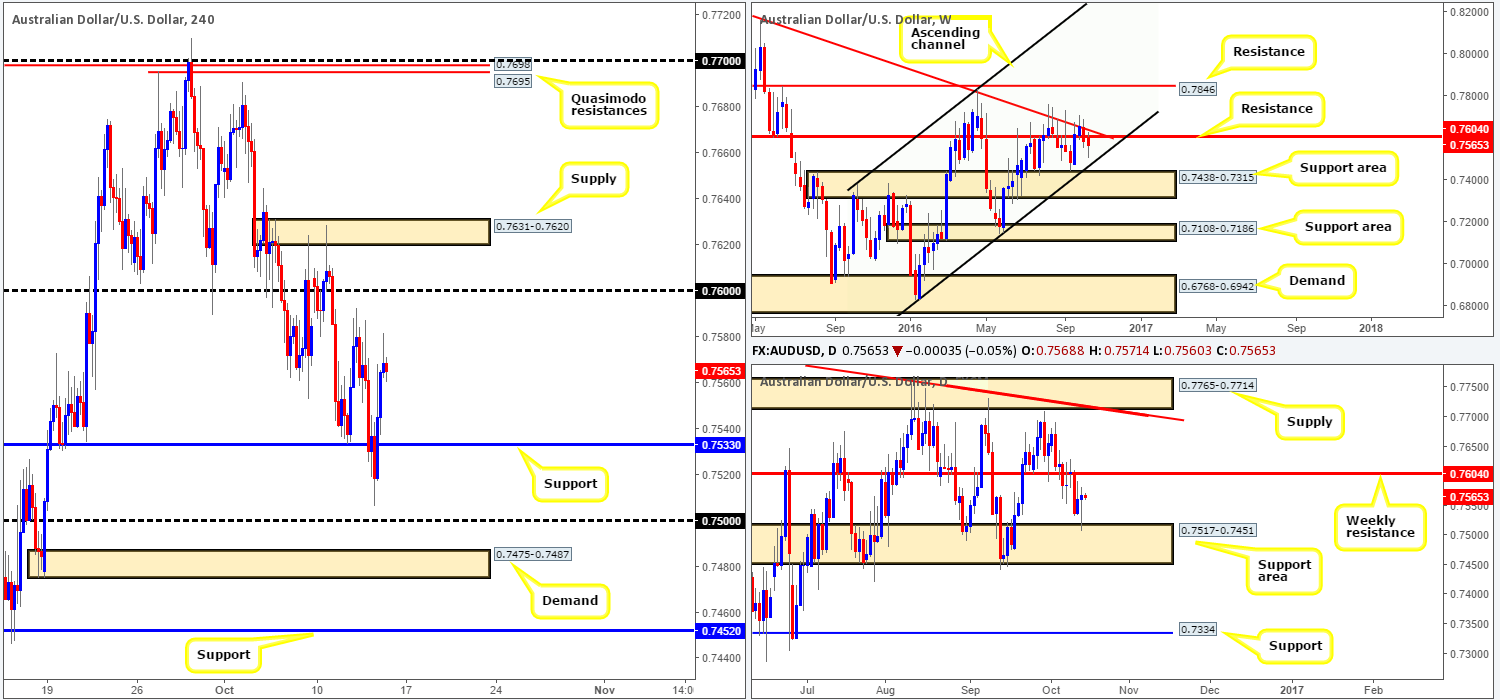
In recent sessions, we saw the commodity-linked currency catch a relatively healthy bid just ahead of the 0.75 handle. Technically speaking, the reason for price rallying ahead of this key figure can likely be seen on the daily chart: a support zone coming in at 0.7517-0.7451. Assuming that the bulls remain in good form today, this rebound could force the unit back up to the weekly resistance level drawn from 0.7604.
While, there is scope for further buying today, we must take into account that the last week’s weekly candle closed below the weekly resistance at 0.7604, suggesting that the bears still have a hand in this fight, despite yesterday’s rebound off of the daily support zone.
Our suggestions: In our view, there’s not really much to hang our hat on at the moment. And, given the heavy round of US news set to take the spotlight later on today, we feel the best course of action may be to remain on the sidelines and reassess on Monday.
Levels to watch/live orders:
- Buys: Flat (Stop loss: N/A).
- Sells: Flat (Stop loss: N/A).
USD/JPY:
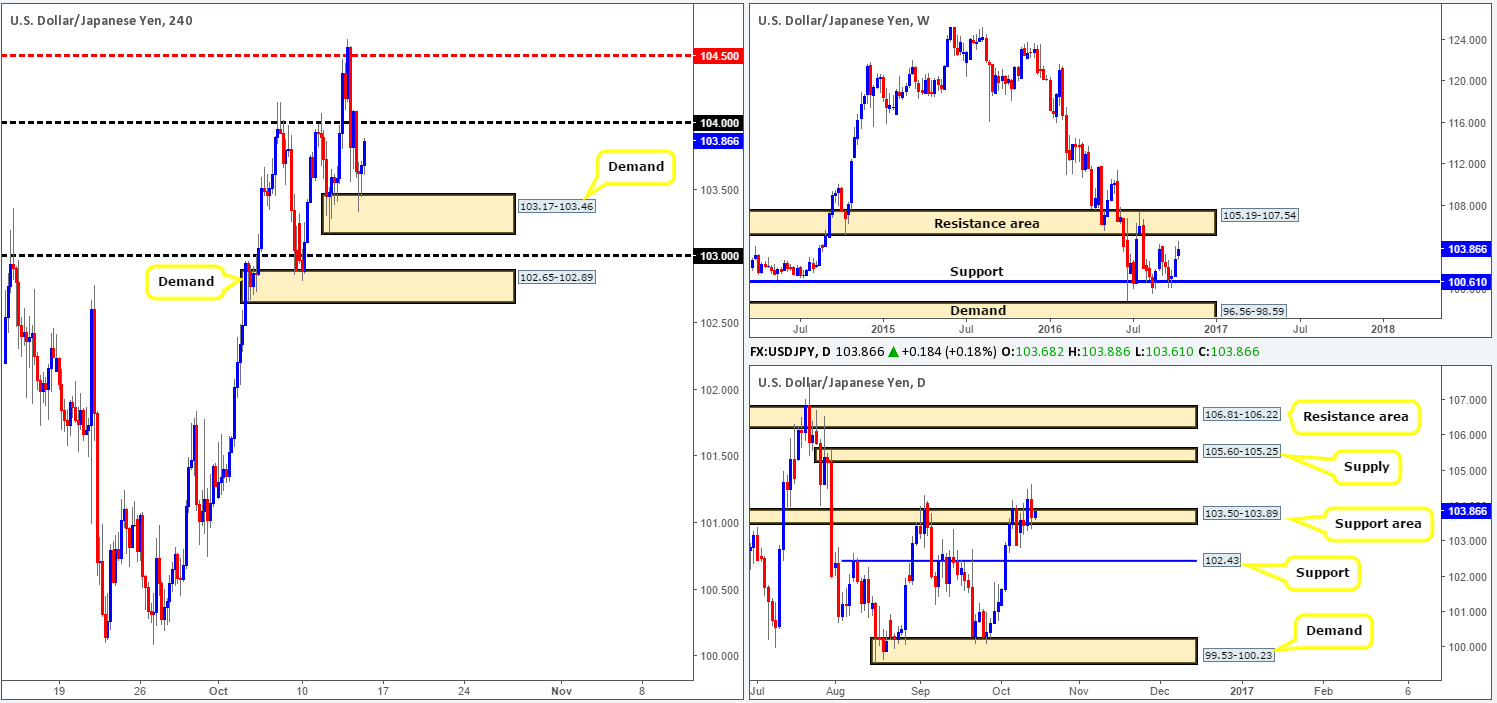
As can be seen from the H4 chart this morning, demand at 103.17-103.46 provided support to the USD/JPY going into yesterday’s US session. Buying from this zone, nonetheless, is tricky given that the 104 handle is lurking just above current price. On the assumption that price remains bid from the H4 demand base today and closes above 104, would we be willing to consider longs? Yes. Not only is a close above 104 considered a bullish cue, but this move would also help confirm bullish strength from the daily support area seen at 103.50-103.89, which shows room to advance north up to daily supply at 105.60-105.25. Adding to that, we recently saw the weekly candles breach highs chalked up on the 29/08 around the 104.32ish range, which could set the stage for further upside towards a resistance area seen at 105.19-107.54.
Our suggestions: On account of the above points, waiting for a close above the 104 boundary seems to be the safer route to take today. Should this come to fruition and price retests this barrier as support, followed by lower timeframe confirmation (see the top of this report), we’d look to buy, targeting 104.50 and then 105 (sits just ahead of the aforementioned weekly resistance area and daily supply).
Levels to watch/live orders:
- Buys: Watch for a close above 104.00 and look to trade any retest seen thereafter ([lower timeframe confirmation required] Stop loss: dependent on where one confirms this level).
- Sells: Flat (Stop loss: N/A).
USD/CAD:
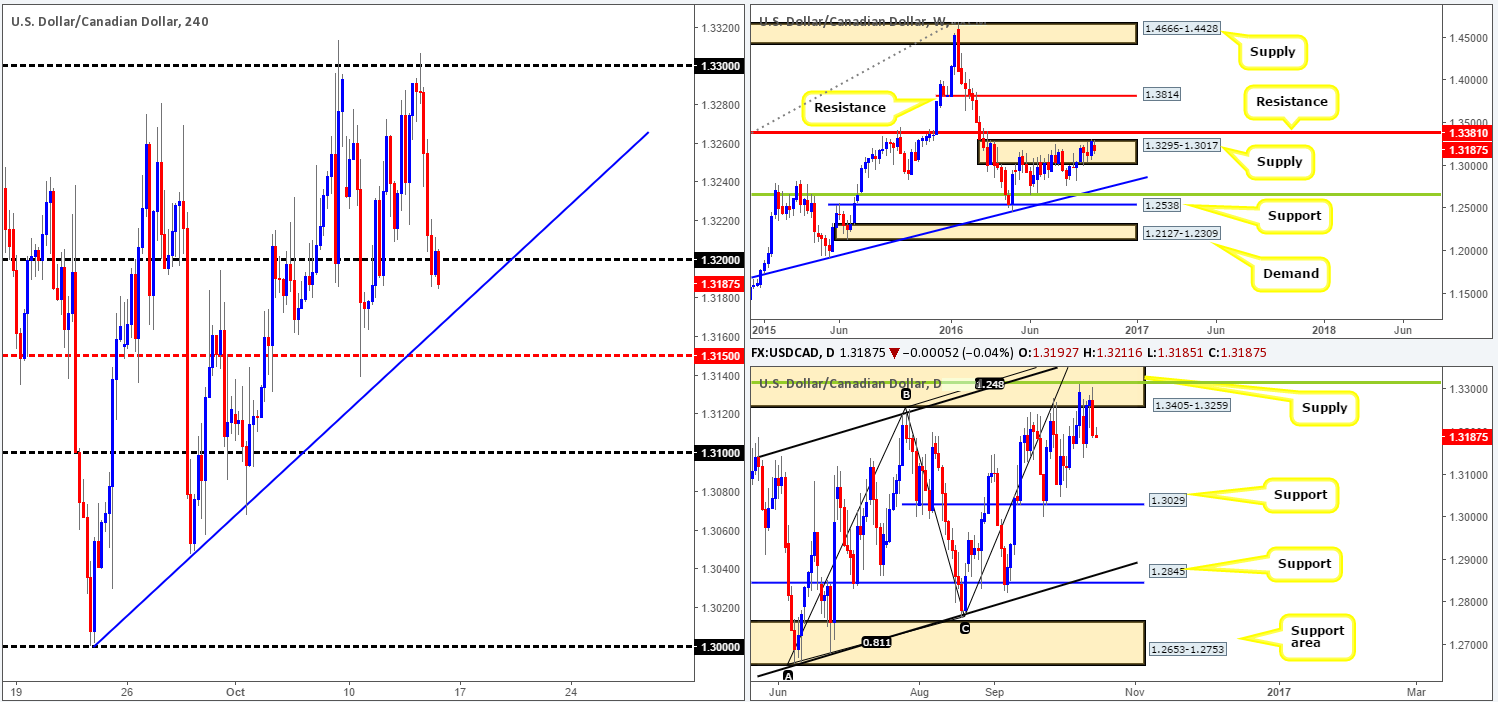
On the back of a weaker dollar, the loonie took a dive yesterday from the 1.33 region, consequently forcing prices to touch gloves with the 1.32 handle by the day’s end. The next downside target beyond 1.32 is a H4 trendline support extended from the low 1.3000, followed closely by the H4 mid-way support 1.3150.
While there’s a chance that the H4 candles may rebound from either of the above said areas, higher-timeframe action suggests we may be in for further downside, as both the daily and weekly candles are trading from supply (1.3405-1.3259/1.3295-1.3017).
Our suggestions: In light of the above picture, we would be interested in shorting this market should a close beyond the current H4 trendline take place. A retest to the underside of this line, followed by a H4 bearish close is a high-probability setup in our book. From here, our immediate target would be the 1.31 handle, then the daily support seen at 1.3029 (next downside target on the daily timeframe), followed by the key figure 1.30.
Levels to watch/live orders:
- Buys: Flat (Stop loss: N/A).
- Sells: Watch for a close beyond the H4 trendline support taken from the low 1.30 and look to trade any retest seen to the underside of this boundary ([H4 bearish close required following the retest] Stop loss: ideally, beyond the trigger candle).
USD/CHF:
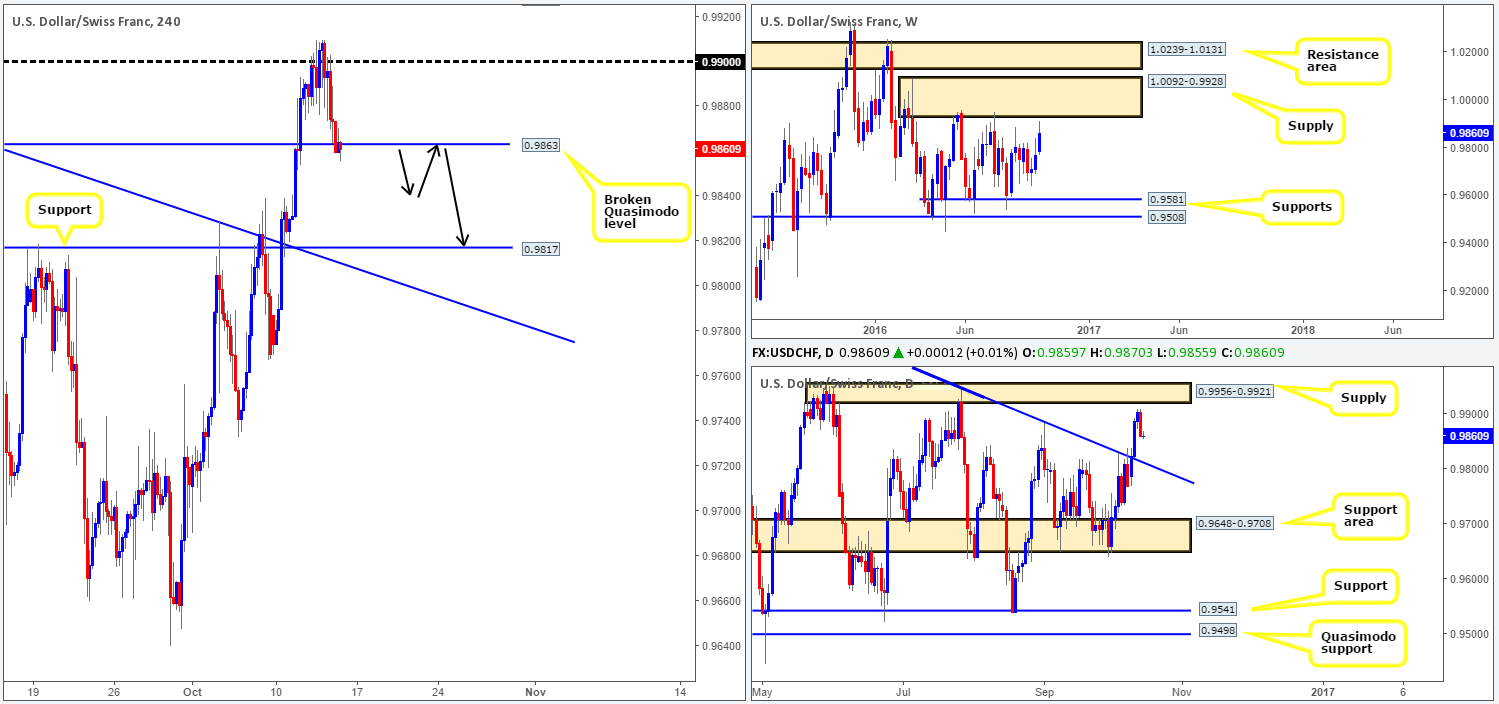
Since the week’s open, we’ve seen the US dollar rally against the Swiss Franc. However, the upward momentum appears to be crumbling as the buyers failed to sustain gains beyond the 0.99 handle yesterday, and went on to clock fresh lows of 0.9859 by the close. Looking at the H4 chart, this recent downside move saw the Swissy close below a broken Quasimodo line at 0.9863, which could set the stage for a continuation move towards 0.9817: a support level.
Over on the bigger picture, nevertheless, price surprisingly topped out just ahead of major structure. The daily chart shows that the buyers hit the brakes and reversed 12 pips ahead of a daily supply unit at 0.9956-0.9921, while the weekly candle appears to be finding resistance 19 pips ahead of a large supply zone coming in at 1.0092-0.9928.
Our suggestions: In light of the recent bout of selling, our team has noted that they’d be interested in shorting from the underside of the H4 broken Quasimodo line at 0.9863 today, targeting 0.9817, followed by the H4 trendline support extended from the high 0.9884.
Be that as it may, we’d like to see some sort of supply formed around 0.9863 before we look to short. In other words, a downside move has to be seen, as depicted by the black arrows. Should this come to fruition, this is a high-probability setup here guys, so we’ll likely go in with a full position and place stops above the newly-formed supply area.
Levels to watch/live orders:
- Buys: Flat (Stop loss: N/A).
- Sells: 0.9863 ([possible area to short from at market] Stop loss: above the newly-formed supply).
DOW 30:
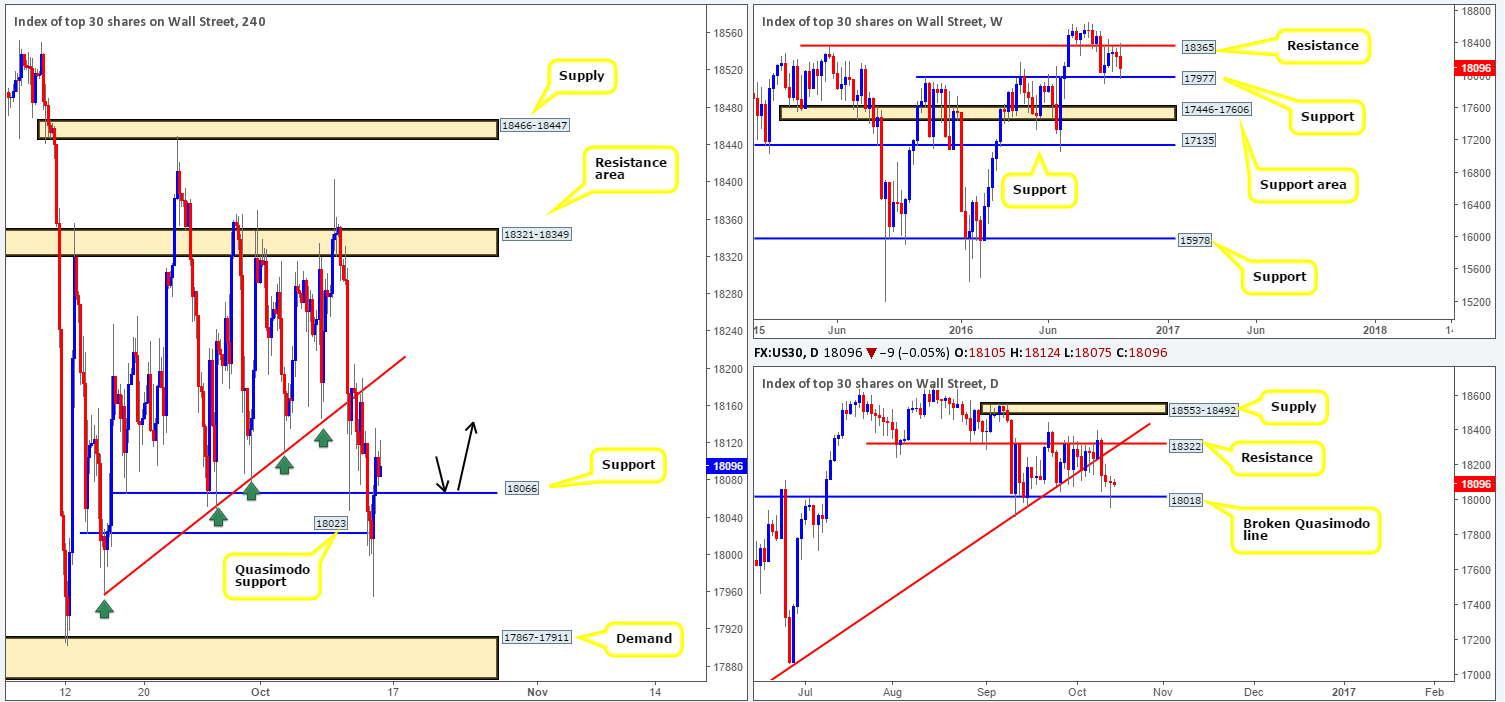
For those who have been following our reports for some time, you may recall us highlighting 18023 (a H4 Quasimodo support level) as a high-probability level to take a long from. Well, in the early hours of yesterday morning, the unit finally struck this line and we entered at market with stops placed below the apex of this formation at 17953. As you can see, price did trade in our favor for a few hours but then dove lower to stop us out TO-THE-PIP, before reversing tracks and rallying north! What a shame. Well done to any of our readers who survived this move!
Moving forward, the bulls look to have a slight edge this morning. Not only is the weekly support at 17977 now in play, but we also saw a daily buying tail print off the top edge of a broken Quasimodo line at 18018 during yesterday’s session. As far as higher-timeframe structure goes, the next upside target to have an eyeball on can be seen at 18322: a daily resistance level.
Our suggestions: Taking into account the above points, our attention will mostly be driven toward longs today off of the H4 support level coming in at 18066. To avoid any whipsaws through this hurdle, we would advise waiting for a H4 bull candle to take shape prior to pulling the trigger here. Our ultimate take-profit target from this angle would be the H4 resistance area at 18321-18349, since this zone encapsulates the above said daily resistance level.
Levels to watch/live orders:
- Buys: 18066 ([H4 bullish candle required prior to pulling the trigger] Stop loss: beyond the trigger candle).
- Sells: Flat (Stop loss: N/A).
GOLD:
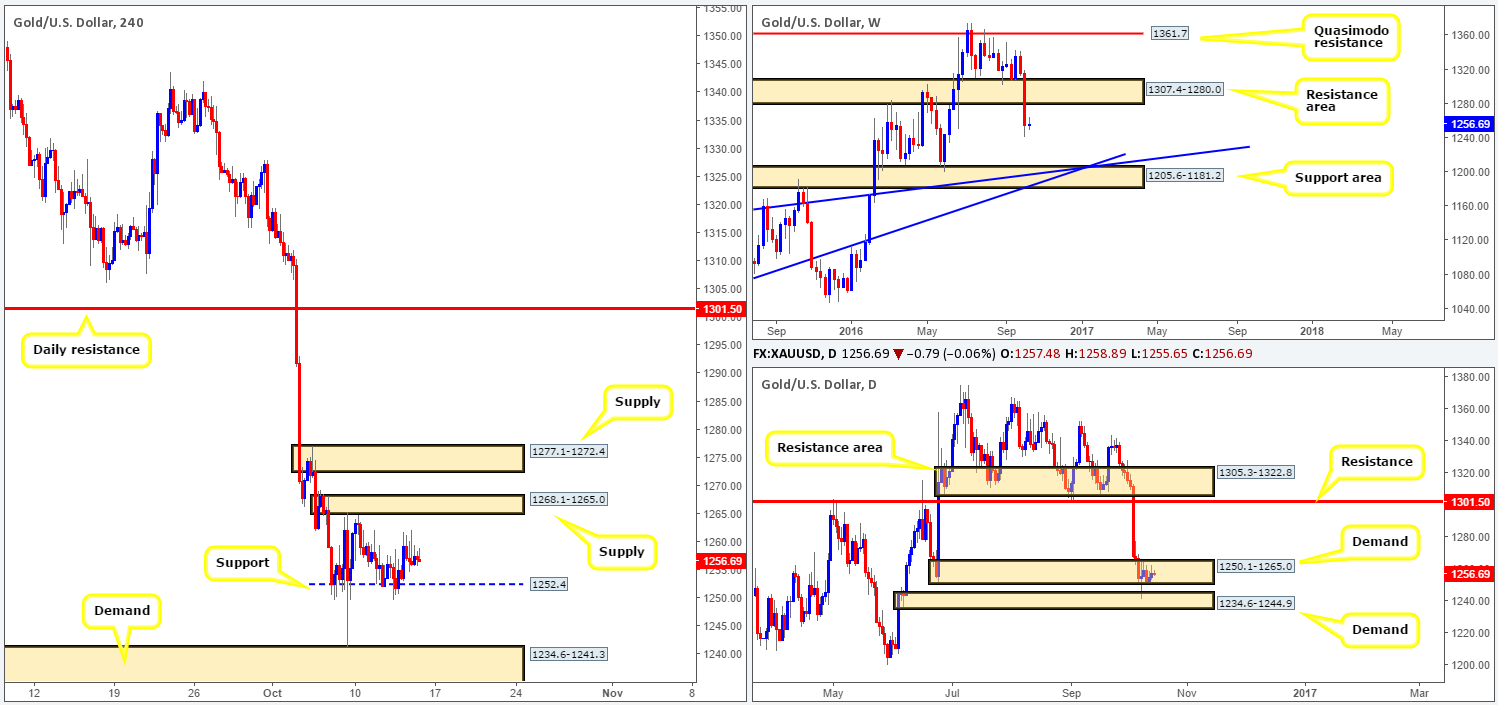
As far as we can see, the gold market recently entered into a phase of consolidation fixed between H4 supply at 1268.1-1265.0, and a minor H4 support coming in at 1252.4. Usually, our team would look to trade in the direction of strength. That is, where the weekly and daily candles are trading from. However, in this market we can see that weekly action recently took out a support area at 1307.4-1280.0 (now acting resistance), possibly setting the stage for a continuation move south down to the support area logged in at 1205.6-1181.2 (converges with two trendline supports [1130.1/1071.2]). Meanwhile, daily price on the other hand, remains trading around demand (1234.6-1244.9/ 1250.1-1265.0).
Therefore, while some traders may deem the current H4 range a viable trading zone, we do not really have much in the way of bigger-picture direction as far as structure is concerned. This, in our opinion, places one at risk trading this market. For example, a buy from the above said H4 support, of course, would have the backing of the aforementioned daily demands, but it also means trading against potential weekly flow. On the other side of the coin, a short from the current H4 supply would place one in line with weekly flow, but also position you against daily buyers from demand!
Our suggestions: In view of the higher-timeframe structures, our team will remain flat for the time being.
Levels to watch/live orders:
- Buys: Flat (Stop loss: N/A).
- Sells: Flat (Stop loss: N/A).
