
EUR/USD:
The single currency was uninspired Monday, with action likely restricted throughout the markets ahead of the Fed’s decision later this week.
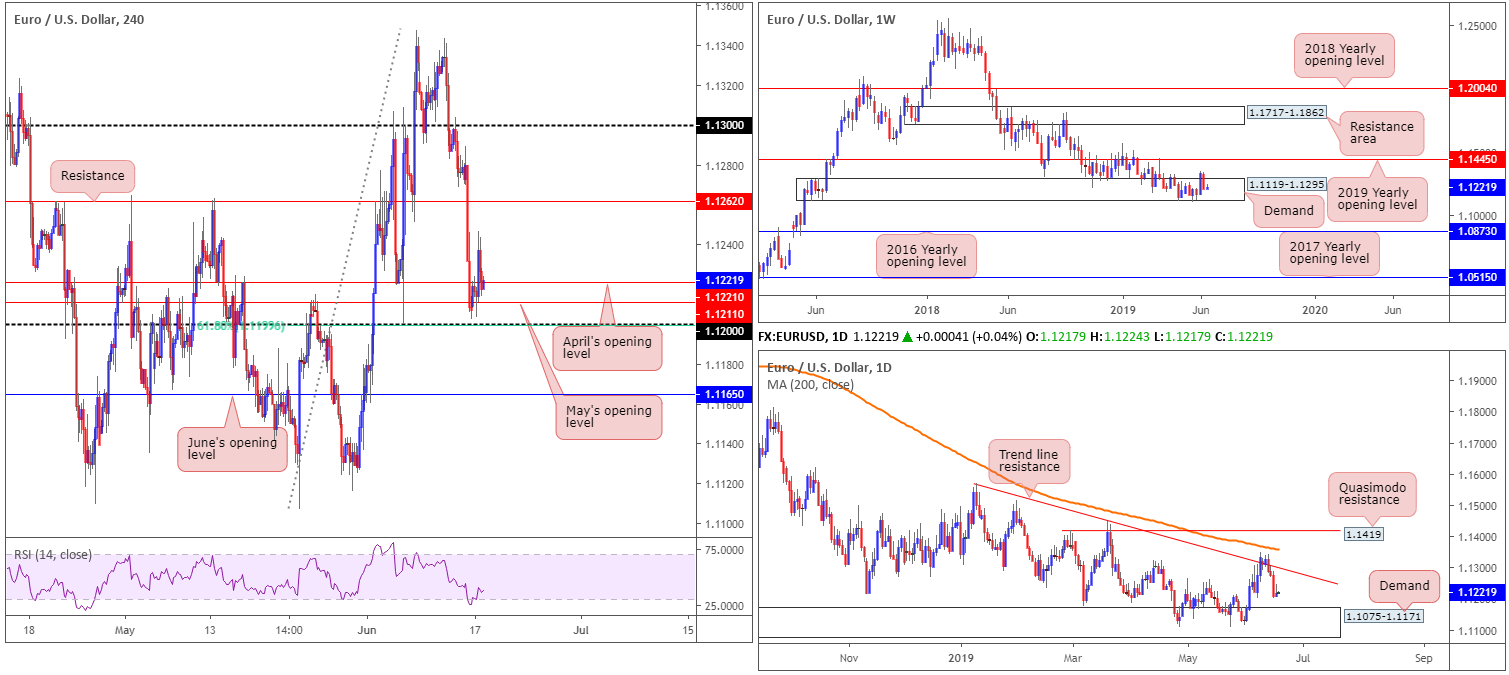
As is evident from the H4 setting this morning, the candles remain engaged with the 1.12/1.1221 neighbourhood (comprised of April and May’s opening levels at 1.1221 and 1.1211, the round number 1.12 and a matching 61.8% Fibonacci support value). Beyond 1.12, June’s opening level is present at 1.1165, positioned within the upper boundary of a daily demand at 1.1075-1.1171.
The story on the weekly timeframe remains unchanged from Monday’s report:
In spite of a notable offensive phase out of a long-standing demand area at 1.1119-1.1295 two weeks back, the euro declined more than 120 points against the buck last week. This – coupled with the overall trend still facing a southerly bearing since topping in early 2018 – places a bold question mark on the demand’s life expectancy.
Targets to be aware of this week on the longer-term chart can be seen at the 2019 yearly opening level at 1.1445 and the 2016 yearly opening level coming in at 1.0873.
Areas of consideration:
In light of Monday’s lacklustre performance, the research team’s outlook remains as follows:
The 1.12 handle, and its closely associated monthly opening levels at 1.1221 and 1.1211 on the H4 timeframe, emphasises a fragile tone, according to the overall technical picture, and therefore is unlikely to produce much more upside this week. The rationale behind this notion simply falls on the higher-timeframe structure: weekly demand failing to excite buyers and daily price exhibiting scope to approach 1.1171 (the top edge of demand), which, as we already know, aligns closely with June’s opening level at 1.1165.
On account of the above, the research team are watching for the following scenarios:
- A H4 close beneath 1.12, targeting 1.1165 as the initial point of concern. Short-term traders have the option of either selling the breakout candle and positioning stop-loss orders above the upper shadow, or waiting and seeing if a retest at 1.12 as resistance develops and entering on the back of the rejection candle’s structure. The latter is considered the more conservative route.
- Long opportunity from 1.1165, considering its connection with daily demand. Bear in mind, however, this entails buying into the overall trend, so trade cautiously here.
Today’s data points: ECB President Draghi Speaks; German ZEW Economic Sentiment; US Building Permits; US Housing Starts.
GBP/USD:
The British pound kicked off the week in negative territory vs. the dollar, adding to its recent string of losses. Although a lack of fundamental drivers, one poll of conservative voters did show Conservative leadership candidate Boris Johnson with support in excess of 77%. In addition, the British Chambers of Commerce reported UK companies look set to reduce 2019 investment by the most in a decade as Brexit drags on.
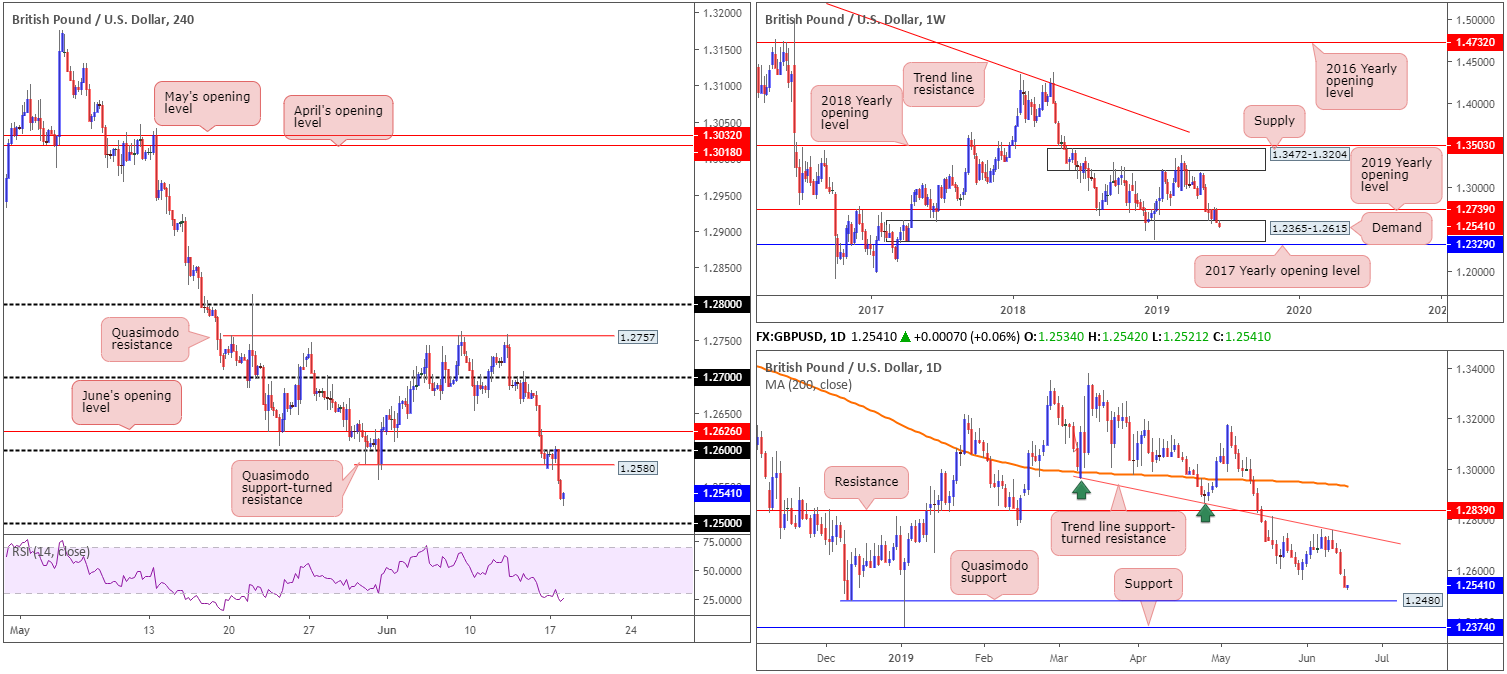
Down 0.44% on the day, Monday observed the GBP/USD’s H4 candles retest the underside of 1.27 and nearby Quasimodo support at 1.2580. The day finished a little more than 30 points north of the 1.25 handle, a fresh five-month low.
On a wider perspective, here’s what Monday’s report had to write in regards to the weekly timeframe:
Shedding more than 140 points on the week by way of a near-full-bodied bearish candle, price action reconnected with long-standing demand at 1.2365-1.2615 after failing to sustain gains above the 2019 yearly opening level at 1.2739.
Failure to overthrow 1.2739 brings into question the validity of the current demand. For that reason, it may be an idea to pencil in the 2017 yearly opening level at 1.2329, in the event we press for lower ground this week.
And from the daily timeframe:
In conjunction with the 2019 yearly opening level on the weekly timeframe, additional resistance entered the fold last week in the shape of a daily trend line support-turned resistance extended from the low 1.2960.
The next point of calling, as we’re now beyond the 1.2558 May 31 low, in terms of support, can be found at a Quasimodo formation drawn from 1.2480, closely shadowed by support at 1.2374.
Areas of consideration:
For folks who read Monday’s briefing you may recall the piece highlighted the following:
Should the market punch beneath 1.2580 on a H4 closing basis, best if we also take out the low at 1.2558 as well, selling this market is certainly something worth considering, either on the breakout candle or shorting any retest motion.
Those who sold the breakout candle, great work. At this point risk can be reduced to breakeven, with the expectation of further profits emerging towards the 1.25 handle, followed by the daily Quasimodo support mentioned above at 1.2480.
Today’s data points: BoE Gov. Carney Speaks; US Building Permits; US Housing Starts.
AUD/USD:
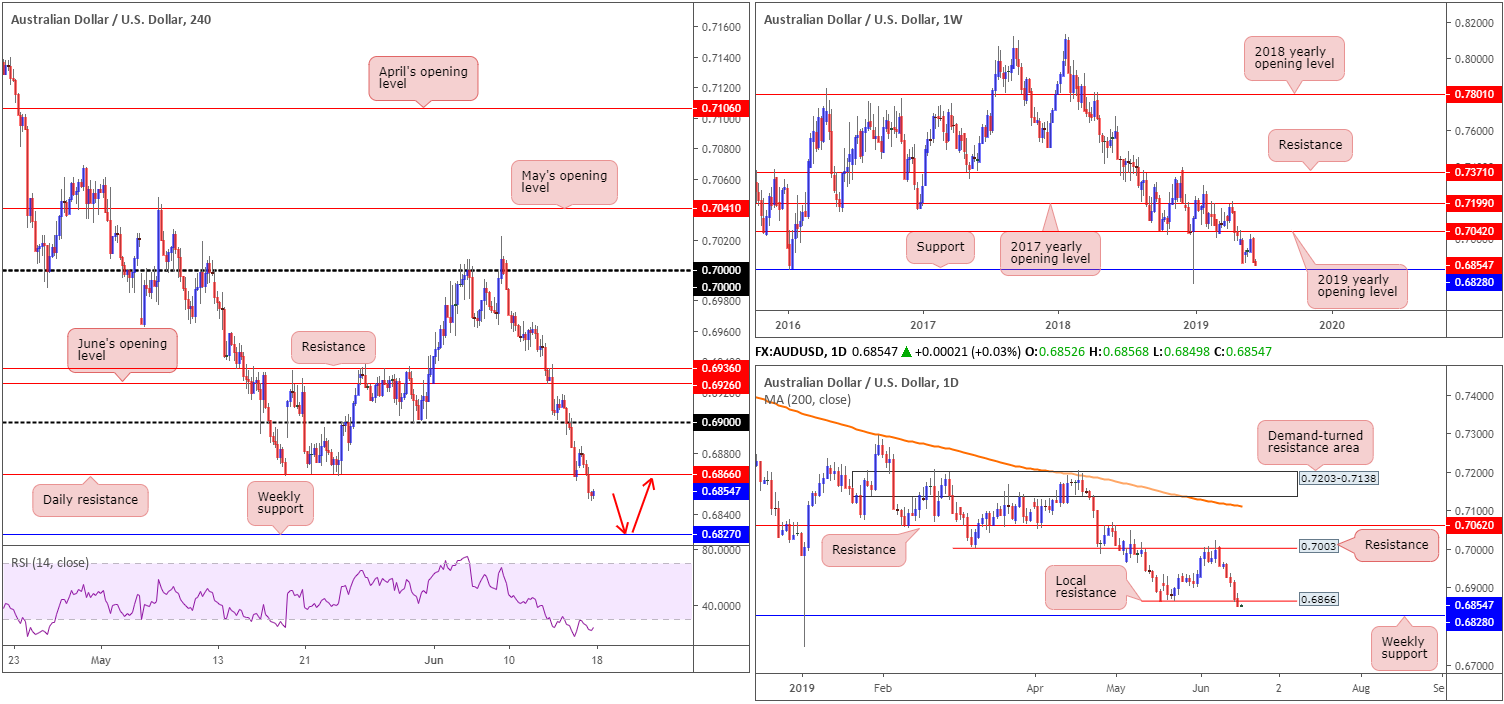
Despite a promising upward gap at the open off daily support at 0.6866, the Australian dollar concluded Monday weaker against its US counterpart, falling to a multi-month low of 0.6848. Amid fresh headlines suggesting India is to impose tariffs on US goods, alongside fears trade tension will continue to hurt the Chinese economy, the AUD/USD registered its fourth consecutive daily loss.
From the weekly timeframe, we can see the unit trading within striking distance of notable support pencilled in at 0.6828, a level offering history as far back as mid-2003. The setting on the daily timeframe saw price action dethrone local support at 0.6866 yesterday (now acting resistance), consequently exposing the aforementioned weekly support.
With daily support now likely to serve as resistance at 0.6866, the H4 candles, according to our technical reading, see limited support until crossing paths with the 0.68 handle.
Areas of consideration:
Focus remains on the weekly support level at 0.6828 for a possible countertrend trade.
Should 0.6828 enter the fight, as highlighted in Monday’s report, and produce a notable H4 bullish candlestick configuration – think hammer formation of bullish engulfing pattern – the odds of price developing at least a healthy bounce is high, targeting the underside of 0.6866 as the initial upside objective (entry and risk elements can be determined according to the bullish candlestick’s structure).
However, do be aware that in less than an hour we have potentially hard-hitting news out of Australia in the form of the Reserve Bank of Australia (RBA) minutes of its latest policy meeting.
Today’s data points: Australia Monetary Policy Meeting Minutes and HPI q/q; US Building Permits; US Housing Starts.
USD/JPY:
In conjunction with US equity indexes, the USD/JPY struggled to form decisive direction Monday, concluding the session marginally in the green by 0.04%.
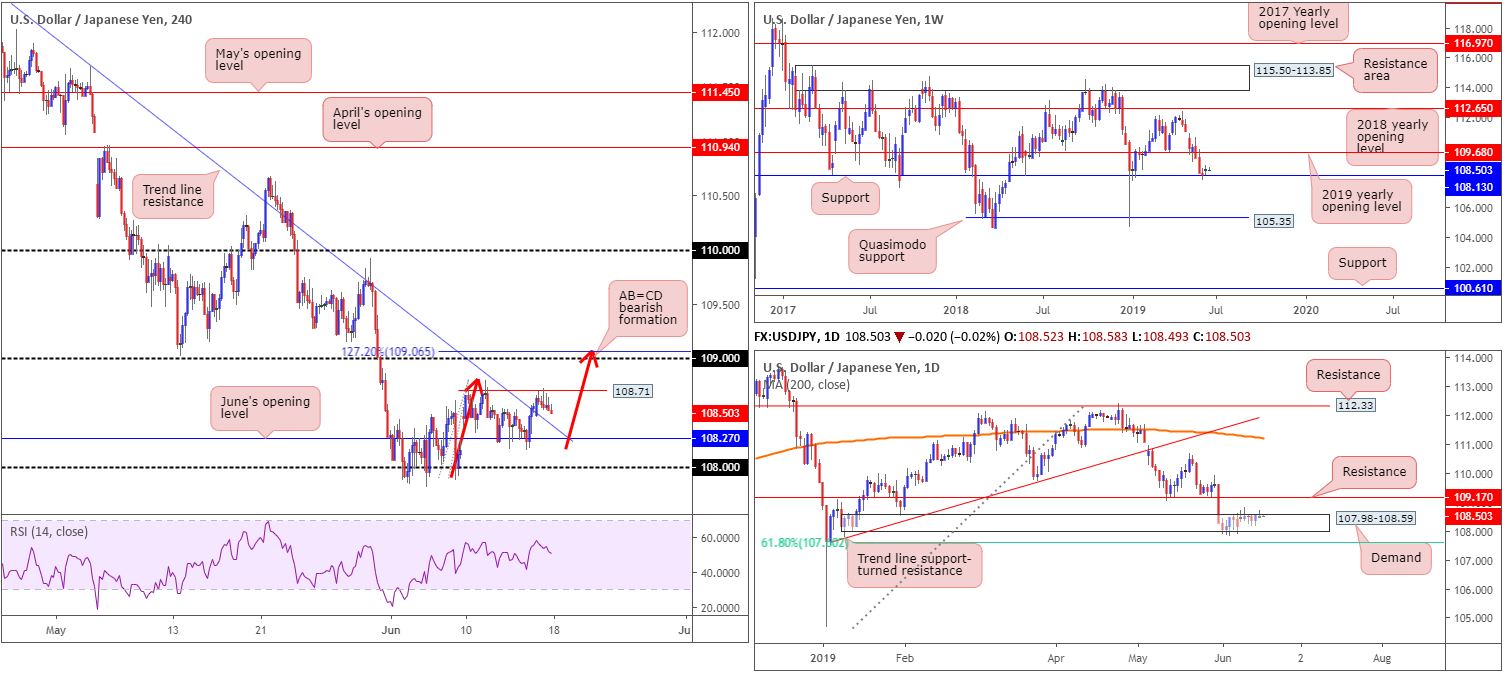
The technical structure on the H4 scale has the candles defending the underside of Quasimodo resistance at 108.71, which may eventually lead to a retest of a recently broken trend line resistance-turned support (extended from the high 112.40) and June’s opening level converging at 108.27. As highlighted in Monday’s briefing, the next upside hurdle beyond 108.71 can be seen at the 109 handle as it meets with a 127.2% AB=CD (red arrows) bearish formation at 109.06.
Longer-term flows remain unchanged from Monday’s report:
Over the course of the past two weeks, weekly action has been engaging with support at 108.13. Although the level remains unbroken and could eventually encourage a run towards the 2019 yearly opening level at 109.68, the lack of enthusiasm off this barrier casts uncertainty. With that in mind, traders may want to acknowledge Quasimodo support at 105.35 in the event price action explores lower ground in the weeks to come.
Daily demand at 107.98-108.59, despite price action clipping the lower edge of the base the week prior, remains intact. Interestingly, Friday’s upside movement produced a reasonably nice-looking bullish engulfing formation, which if acted upon, may call for a run towards resistance at 109.17.
Failure to advance from current price, nonetheless, opens up the possibility of a move materialising towards a 61.8% Fibonacci support value at 107.60.
Areas of consideration:
In light of price action recently respecting H4 Quasimodo resistance at 108.71, short-term buying opportunities may develop around June’s opening level at 108.27, which, as we already know, converges with H4 trend line resistance-turned support. Conservative stop-loss placement may be set beyond the round number 108, or even beyond the 107.81 June 5 low.
In addition to 108.27, traders may also recall this week’s attention is focused on the 109 handle for shorting opportunities. The research team favours this zone due to the H4 AB=CD connection and daily price establishing resistance overhead at 109.17. Therefore, conservative stop-loss placement is best above this daily barrier. The first downside target will likely be around 108.71, followed by June’s opening level at 108.27 (though do remember daily support could potentially enter the mix around 108.59 [the top edge of daily demand]). Timed right, this trade could produce favourable risk/reward.
Today’s data points: US Building Permits; US Housing Starts.
USD/CAD:
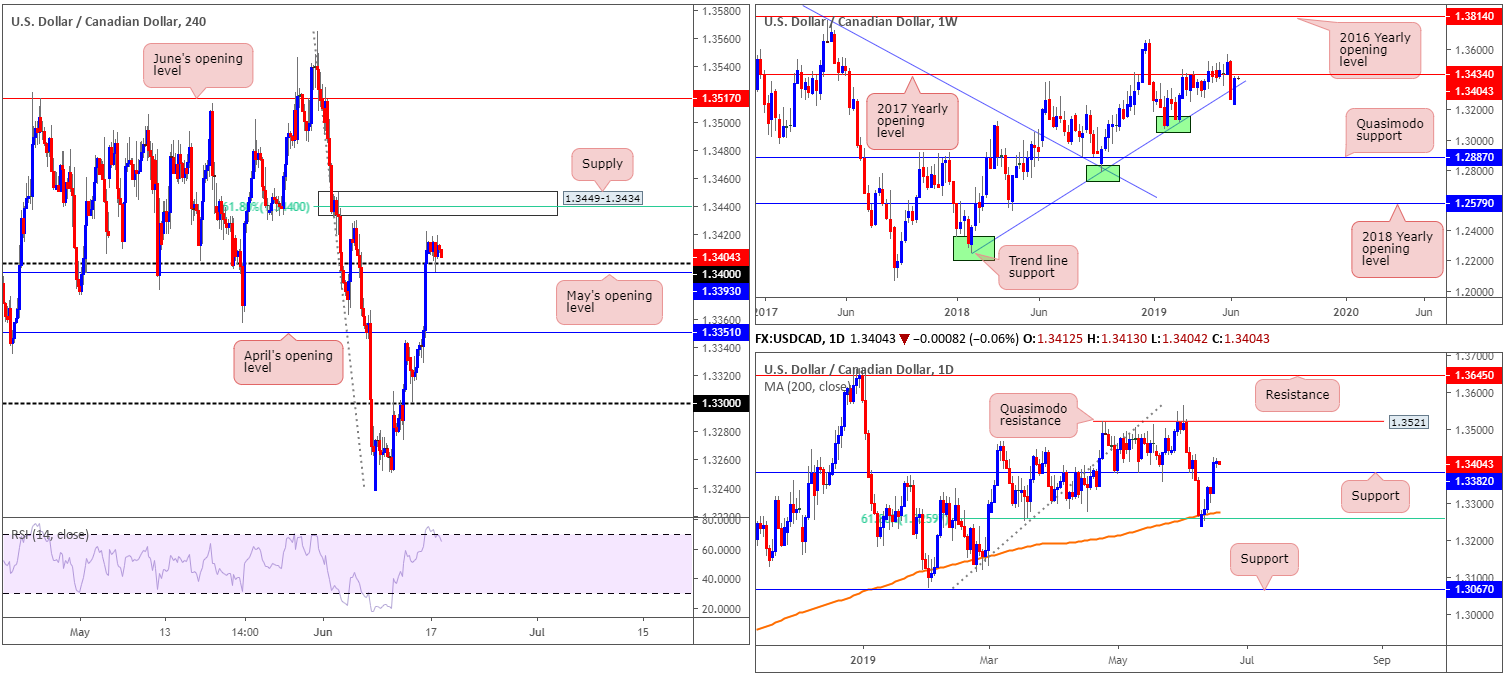
Although sat contentedly north of the 1.34 handle/May’s opening level at 1.3393 on the H4 timeframe, Monday’s action found it challenging to set its next short-term direction. With the 1.34 region tested as support, the next upside target is in view at supply drawn from 1.3449-1.3434 (merges with a 61.8% Fibonacci resistance value at 1.3440).
On more of a broader perspective, a stronger-than-expected rebound from 1.3238 emerged last week, reclaiming trend line support extended from the low 1.2247 and closing within close proximity to the underside of the 2017 yearly opening level at 1.3434, as reported in Monday’s weekly report. Given yearly opening levels often hold price there’s a strong chance a selloff may develop should the level enter the fight this week.
Taken from Monday’s report on the daily timeframe:
A closer reading of price action on the daily timeframe shows the pair remains on a northerly trajectory following the rebound from the 200-day SMA and merging 61.8% Fibonacci support value at 1.3260 at the beginning of last week. Friday witnessed a strong break above resistance at 1.3382 (now acting support), potentially setting the stage for a move towards Quasimodo resistance at 1.3521.
Areas of consideration:
As per Monday’s report:
The H4 supply mentioned above at 1.3449-1.3434 is of interest for possible shorting opportunities this week, having seen the base merge with a 61.8% Fibonacci resistance at 1.3440 and the 2019 yearly opening level on the weekly timeframe at 1.3434 (represents the lower edge of the H4 supply). The only drawback to this is daily flow suggesting a move to Quasimodo resistance at 1.3521.
Conservative traders may wish to wait and see how H4 action behaves before pulling the trigger (preferably wait for a H4 bearish candlestick signal to form and enter based on its structure), as this will help avoid being whipsawed out of a position. Another alternative is to simply position stop-loss orders above the upper edge of the supply (1.3449) and enter at 1.3434, with the first downside target set at 1.34.
Today’s data points: US Building Permits; US Housing Starts; Canadian Manufacturing Sales m/m.
USD/CHF:
For traders who read Monday’s report you may recall the following:
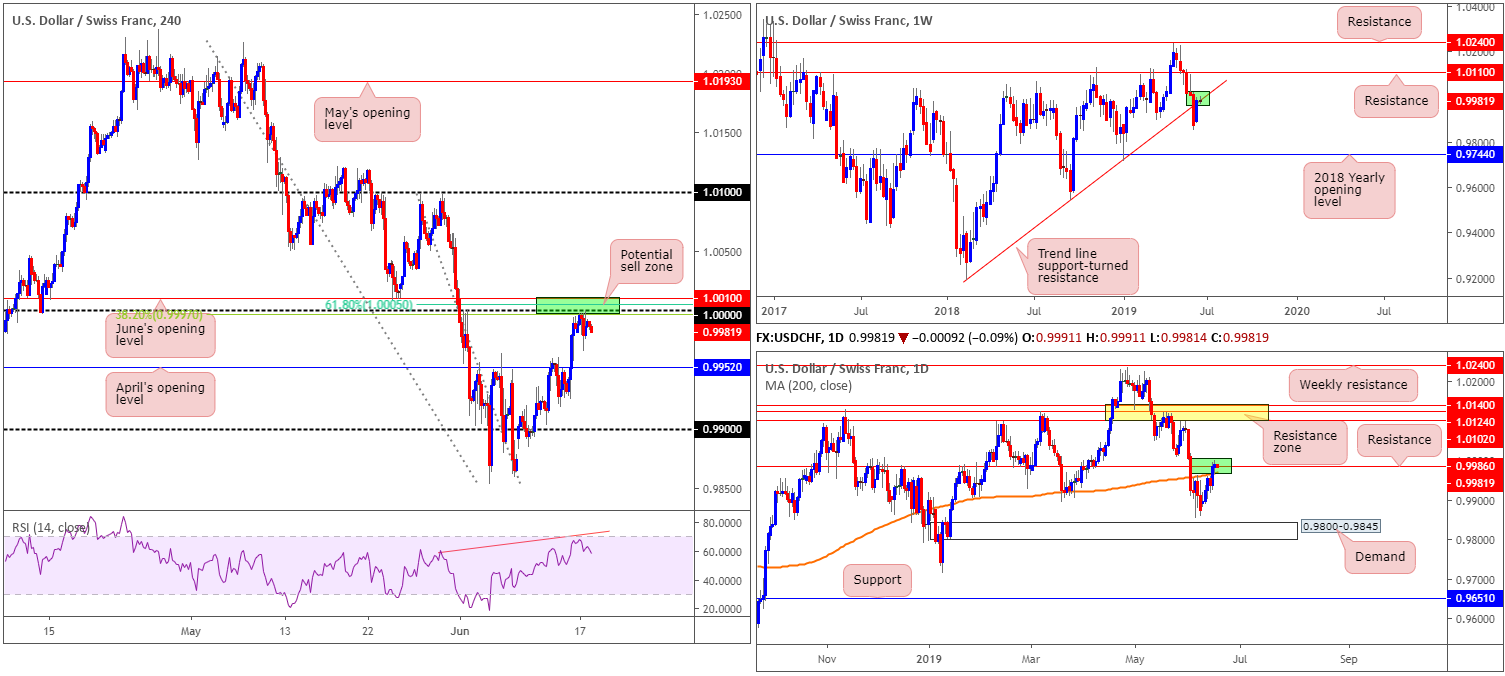
As a result of current structure, the research team has labelled 1.0000 as a prime location to consider shorts from today/early week.
Closely merging with June’s opening level at 1.0010 on the H4 timeframe and a 61.8% Fibonacci resistance value at 1.0005, as well as a 38.2% Fibonacci resistance at 0.9997 and RSI negative divergence (red line), this area held price action lower Monday. What’s also notable from 1.0000 is daily resistance at 0.9986 and a weekly trend line support-turned resistance extended from the low 0.9187.
Areas of consideration:
Well done to any of our readers currently short 1.0000. The next downside target, according to the H4 scale, is April’s opening level at 0.9952. Beyond here, we have the round number 0.99 in sight.
Today’s data points: US Building Permits; US Housing Starts.
Dow Jones Industrial Average:
US equities struggled to pin down direction Monday as investors hope to glean clues from the Federal Reserve later this week on the likelihood of rate cuts this year. The Dow Jones Industrial Average closed marginally higher by 0.09%; the S&P 500 also added 0.09%, along with the tech-heavy Nasdaq 100 advancing a cool 0.63%.
In light of the DJIA’s lacklustre performance, much of the following report will echo thoughts put forward in Monday’s briefing.
From the weekly timeframe:
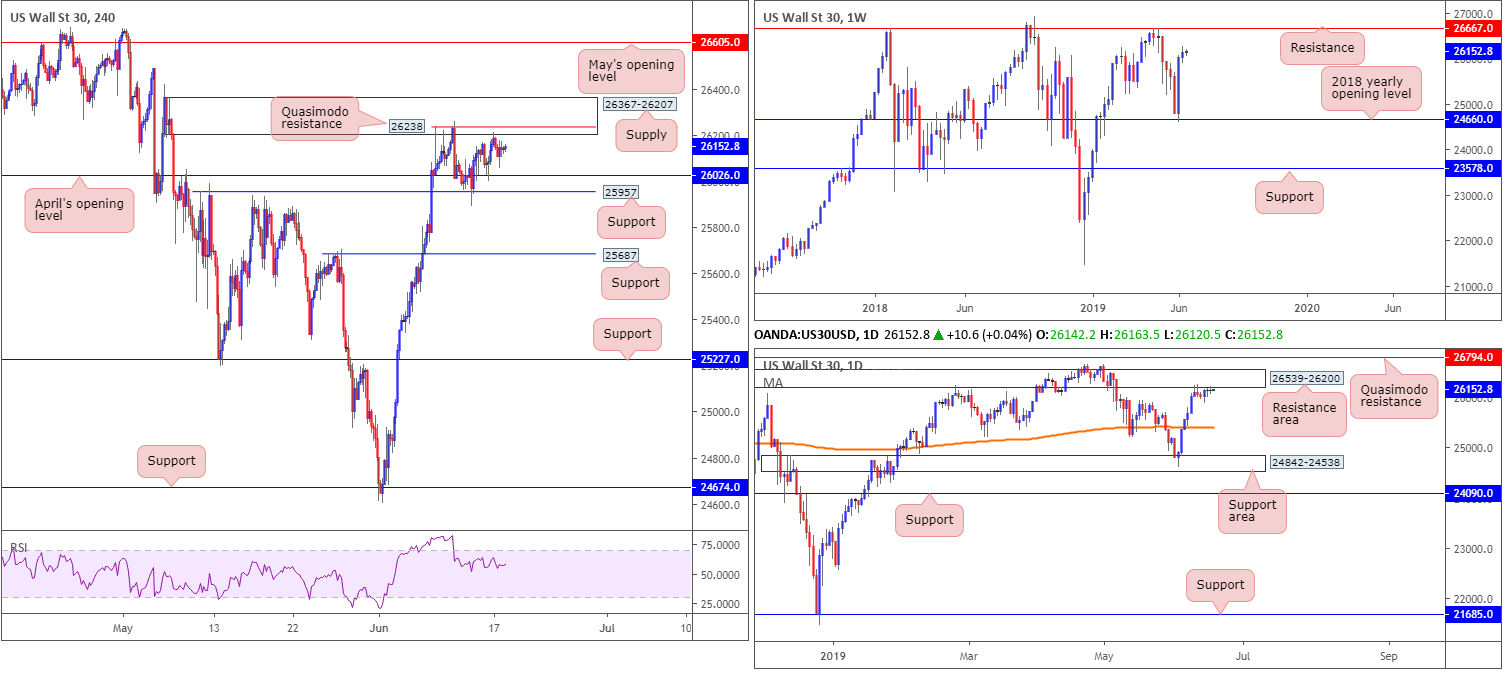
In robust fashion, US equities snapped back more than three weeks’ worth of losses the week prior off its 2018 yearly opening level at 24660, consequently producing a bullish engulfing pattern. Additional upside formed last week, though was narrow in comparison. Further buying this week has resistance in view at 26667.
And the daily timeframe:
The run higher last week failed to do much damage to a resistance area coming in at 26539-26200, unable to penetrate the inside range. Although weekly structure suggests price action may be headed for resistance at 26667, the odds of additional selling evolving from 26539-26200 beforehand is extremely high, targeting a run towards the 200-day SMA around 25411.
And finally, the H4 timeframe:
The supply at 26367-26207, which converges with the lower edge of the daily resistance area mentioned above at 26539-26200, remains of interest this week for possible shorting opportunities. Note this are was tested yesterday, though struggled to print much follow-through action. Given the zone has already welcomed a test last week and on Monday, traders may witness a move higher into the area before turning lower.
Areas of consideration:
With sell orders likely consumed around the lower edge of the current H4 supply, the Quasimodo resistance at 26238 is a possible sell zone. Waiting for notable bearish confirmation is also worth considering before taking the plunge. This could be anything from a H4 or H1 bearish candlestick configuration, a lower-timeframe MA crossover or even drilling down to the lower timeframes and attempting to trade local (price action) structure within the zone.
Today’s data points: US Building Permits; US Housing Starts.
XAU/USD (GOLD):
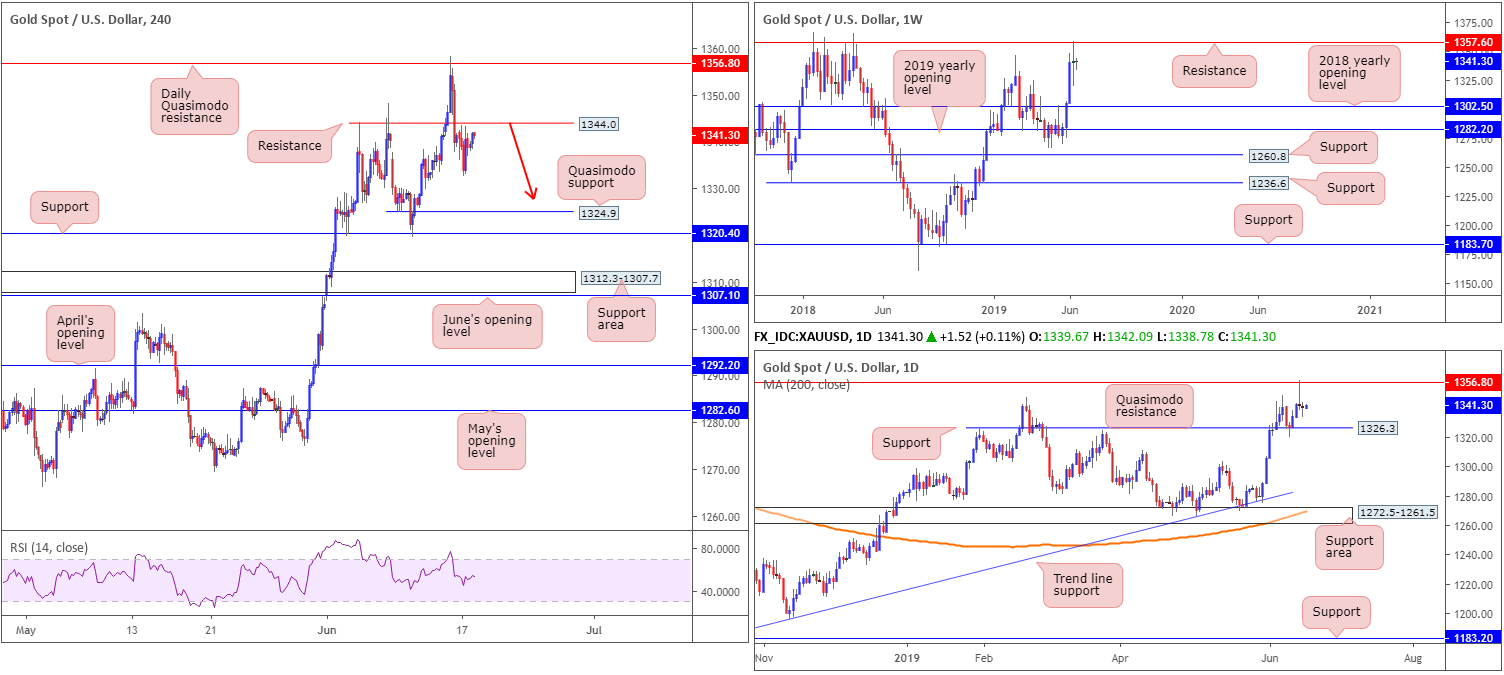
Gold prices remain unchanged over the course of Monday’s sessions, with the H4 candles continuing to languish just south of a H4 resistance at 1344.0. Having seen limited movement Monday, a large portion of the weekly outlook will be emphasised today.
The weekly picture finished by way of a clear-cut indecision candle last week. What is interesting from a technical perspective, though, is resistance at 1357.6 entered the mix, which happens to boast strong historical significance. This, technically speaking, may entice sellers into the market this week, with an eventual test possibly seen at support drawn from the 2018 yearly opening level at 1302.5.
Daily structure:
Together with weekly resistance mentioned above at 1357.6, daily activity engaged with Quasimodo resistance at 1356.8 Friday and chalked up a shooting star formation: a typical bearish signal for a candlestick trader.
Downside from current price, however, is somewhat limited with nearby support seen at 1326.3.
H4 structure:
The research team sees limited support on the H4 scale until reaching a Quasimodo formation at 1324.9 (positioned just south of the daily support mentioned above at 1326.3), closely followed by key support at 1320.4. Therefore, according to the H4 timeframe, there is room for the daily shooting star formation to generate some downside.
Areas of consideration:
In the same fashion as Monday’s outlook:
As of current price, the only area of resistance available on the H4 timeframe at the moment is 1344.0, an old Quasimodo left shoulder formation. A retest of this beauty in the shape of either a H1 or H4 bearish candlestick pattern (entry and risk can be calculated according to the pattern’s structure) would, in light of the overall technical picture, likely be sufficient enough to draw in selling, targeting daily support at 1326.3 as the initial downside objective, followed by Quasimodo support on the H4 timeframe at 1324.9 and H4 support at 1320.4.
The accuracy, completeness and timeliness of the information contained on this site cannot be guaranteed. IC Markets does not warranty, guarantee or make any representations, or assume any liability with regard to financial results based on the use of the information in the site.
News, views, opinions, recommendations and other information obtained from sources outside of www.icmarkets.com.au, used in this site are believed to be reliable, but we cannot guarantee their accuracy or completeness. All such information is subject to change at any time without notice. IC Markets assumes no responsibility for the content of any linked site. The fact that such links may exist does not indicate approval or endorsement of any material contained on any linked site.
IC Markets is not liable for any harm caused by the transmission, through accessing the services or information on this site, of a computer virus, or other computer code or programming device that might be used to access, delete, damage, disable, disrupt or otherwise impede in any manner, the operation of the site or of any user’s software, hardware, data or property.