Key risk events today:
Canadian Core Retail Sales m/m; Canadian Retail Sales m/m; Fed Chair Powell Speaks; Jackson Hole Symposium.
EUR/USD:
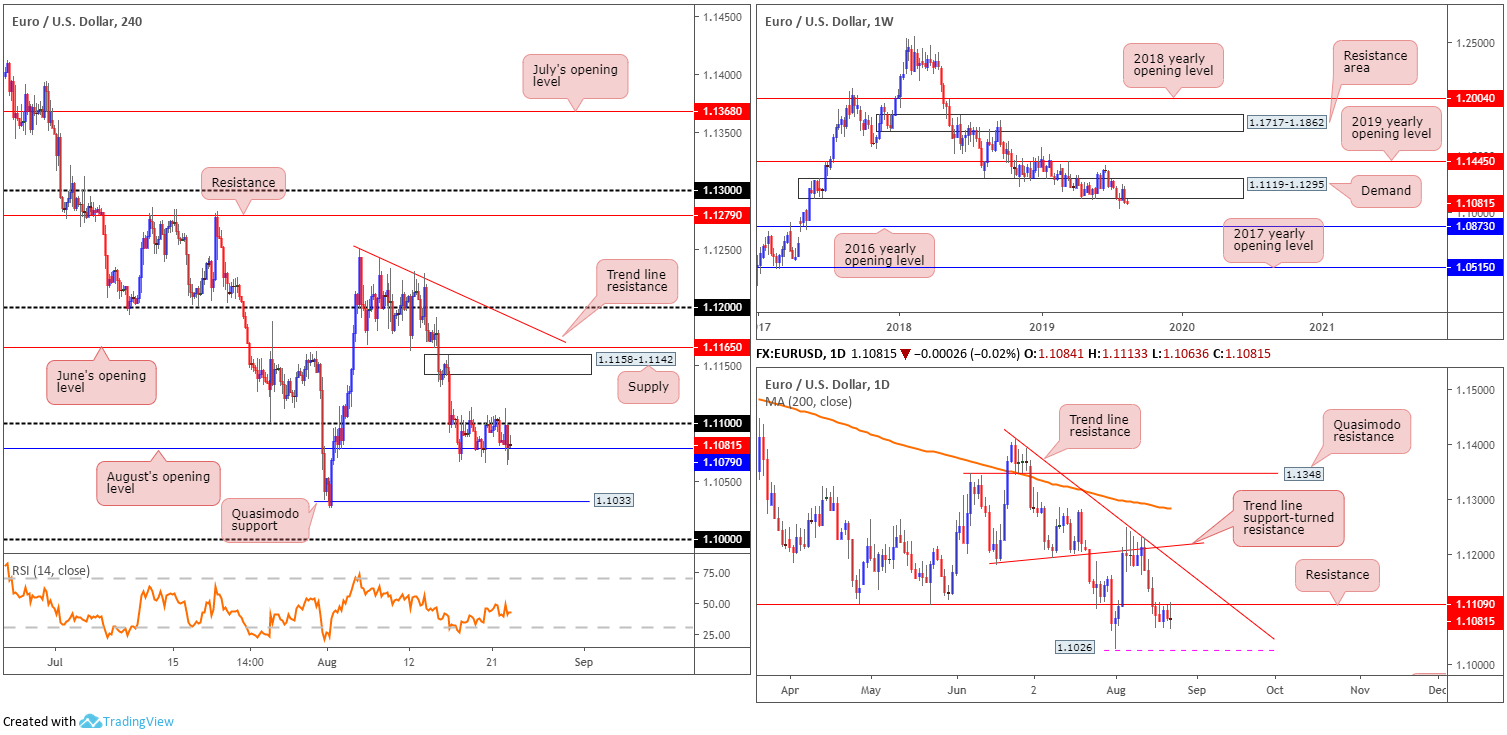
Europe’s single currency remained within a familiar range Thursday, constrained by August’s opening level at 1.1079 and the 1.11 border on the H4 timeframe. Although Eurozone PMIs firmed, the euro’s dial failed to turn. Soft US PMI data raised concerns about the health of US manufacturing, briefly sending the buck lower. Again, though, price action largely ignored the release.
As attention turns to Fed’s Powel speech today, areas outside of the current H4 range fall in at a fresh supply drawn from 1.1158-1.1142, closely trailed by June’s opening level at 1.1165. To the downside, nonetheless, traders’ crosshairs are likely fixed on Quasimodo support coming in at 1.1033, closely followed by the key figure 1.10.
Owing to the week’s lacklustre performance, higher-timeframe structure also remains unchanged:
Longer term, daily flow continues to languish south of 1.1109, a support-turned resistance level. A notable rejection formed from this neighbourhood may govern enough attention to draw in 1.1026 (the 2019 low), followed by demand (not visible on the screen) at 1.0851-1.0950.
Long-standing weekly demand at 1.1119-1.1295 had the lower edge of its base engulfed last week. Continued selling may witness the unit knock on the 2016 yearly opening level’s door at 1.0873, which houses strong historical significance. In addition to this, traders may want to acknowledge the long-term trend remains facing a southerly bearing since topping in early 2018.
Areas of consideration:
Outlook also remains unchanged.
If daily resistance at 1.1109 remains in the fold and weekly flow continues to tread water beneath its demand at 1.1119-1.1295, sellers have the upper hand as far as technical structure is concerned and could prompt an extended selloff from 1.11 on the H4 timeframe.
On account of the above notes, conservative sellers likely have eyes on a H4 close sub August’s opening level at 1.1079. A decisive H4 close below here that’s followed up with a retest is likely sufficient to encourage further selling (entry and risk can be calculated based on the rejection candle’s structure). Downside targets can be seen at the H4 Quasimodo support at 1.1033, the 2019 low at 1.1026 and then the key figure 1.10.
GBP/USD:
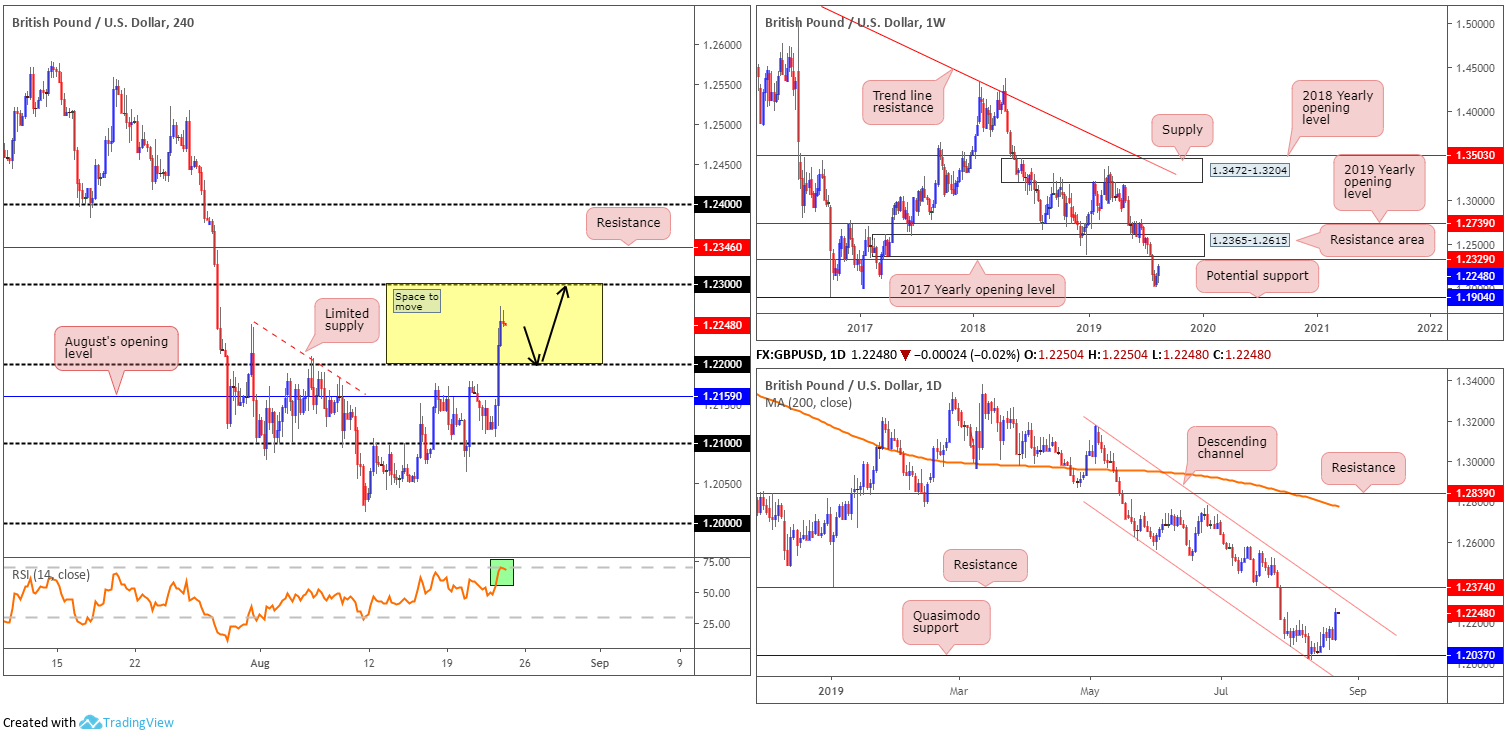
GBP/USD bulls entered an offensive phase Thursday amid prospects of a Brexit-deal breakthrough. French President Emmanuel Macron stated the Withdrawal Agreement can be amended, as well as German Chancellor Angela Merkel suggesting a solution to the Irish border issue could be found before the October 31 Brexit deadline.
Recent bidding found the H4 candles sniffing out fresh monthly highs at 1.2272 after unseating August’s opening level at 1.2159 and the 1.22 handle. While indicator-based traders will note the RSI entering overbought territory (green), price action exhibits scope to press to 1.23 and then resistance at 1.2346.
Against the backdrop of medium-term flow, weekly price appears poised to continue northbound, targeting the 2017 yearly opening level at 1.2329, closely shadowed by a resistance area at 1.2365-1.2615. By the same token, daily structure displays room to push higher, at least until shaking hands with channel resistance extended from the high 1.3176, followed closely by resistance at 1.2374.
Areas of consideration:
Having seen all three timeframes sport potential to gravitate higher, the backbone of today’s focus is on longs, preferably on a retest motion at 1.22 (black arrows) shaped by way of a H4 bullish candlestick signal (entry and risk can then be set according to this structure). The primary take-profit target is found at 1.23, followed by the daily channel resistance and the 2017 yearly opening level mentioned above at 1.2329 on the weekly scale and then H4 resistance at 1.2346.
AUD/USD:
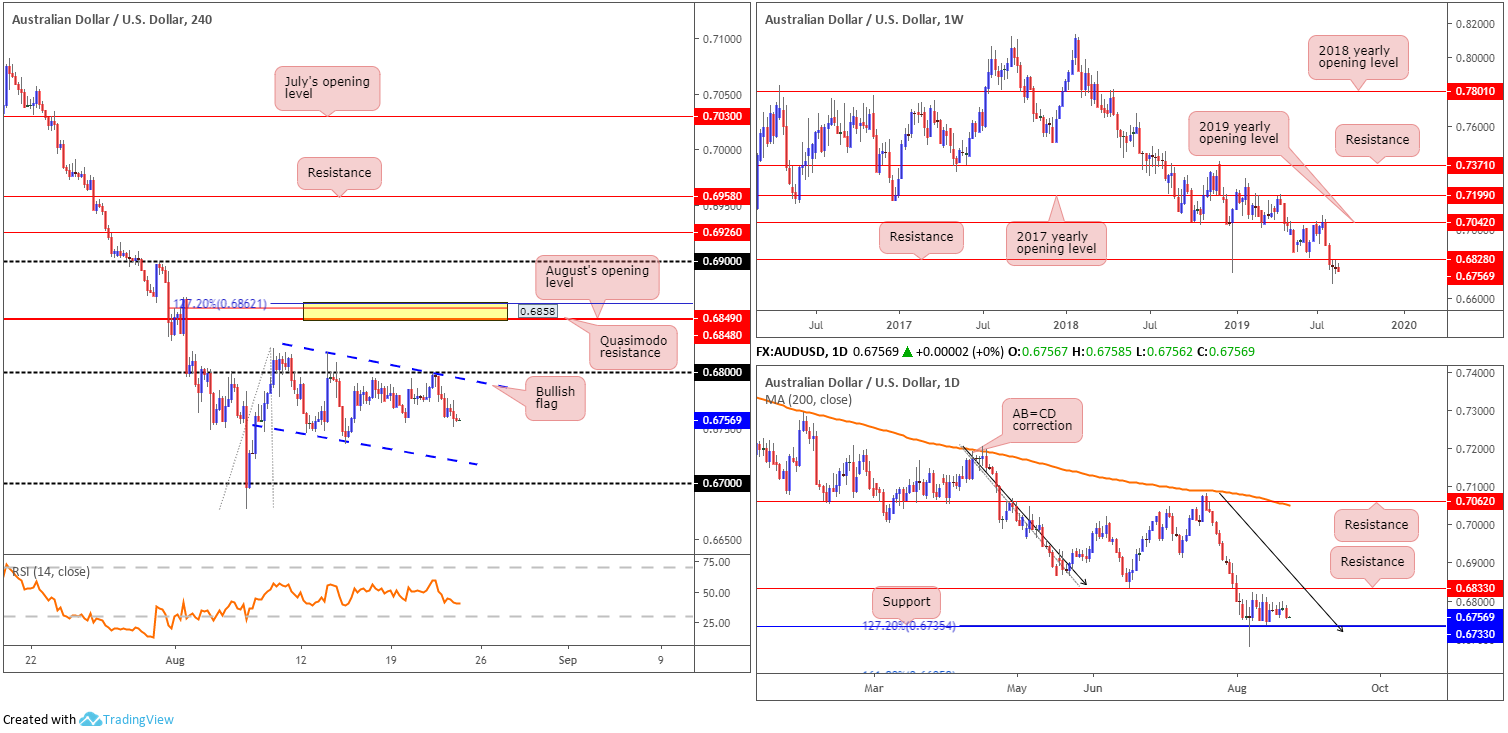
The August flash PMITM data signalled a first reduction in output since March, with the decline centred on the service sector which fell sub-50, as well as the implied probability of an RBA October rate cut rising to 52%, kept the Australian dollar on the defensive Thursday versus the buck, down 0.35%.
Gains remain contained beneath 0.68 on the H4 scale, and compressing within a bullish flag formation (0.6817/0.6745). Flags typically slope in the opposite direction from the trend, which is clearly not the case here but may still form part of a correction move if we break higher, or even signify early signs of a longer-term breakout higher. Beyond 0.68, a close-fitting area of resistance (yellow) resides between a 127.2% Fibonacci ext. point at 0.6862, a Quasimodo resistance at 0.6858 and August’s opening level at 0.6848.
Higher-timeframe flow trades unchanged in terms of its technical presentation:
The weekly timeframe has its candles languishing beneath resistance at 0.6828, organised as two back-to-back indecision candles. The long-term downtrend, intact since the beginning of 2018, is unbroken, with further selling towards support at 0.6395 being a real possibility (not seen on the screen).
Meanwhile, on the daily timeframe, since elbowing beneath weekly support mentioned above at 0.6828, support at 0.6733, along with a 127.2% AB=CD (black arrows) formation at 0.6735, entered the fray and held things higher. Despite this, the pair remains deeply in bearish territory and may not have the firepower to cross swords with resistance at 0.6833 (June 18 low)
Areas of consideration:
Although the target for the H4 bullish flag configuration will come in higher, overlooking H4 resistance at 0.6862/0.6848 is chancy. Further to this, though, between 0.68 and the aforesaid H4 resistance zone, traders must contend with not only daily resistance at 0.6833, but also weekly resistance at 0.6828.
On account of the above, the research team feel longs above the current H4 flag formation/0.68 are challenging. Excessive resistance from all three timeframes analysed will likely hamper any upside attempt.
The H4 channel support extended from the low 0.6745 is a possible platform for longs today, owing to it converging closely with daily support at 0.6733. Waiting for a H4 bullish candlestick signal to form before pulling the trigger is highly recommended, however, since weekly direction faces a southerly bearing, both structurally and in terms of trend.
The yellow H4 area of resistance between 0.6862/0.6848 is also an area still worthy of consideration. Granted, while this zone is a touch above higher timeframe-resistance, a fakeout above these levels (likely flushing out greedy buy stops) to the said H4 zone is a strong possibility. Entry at 0.6848 is, therefore, valid, with a tight protective stop-loss order plotted above 0.6862, but if you prefer waiting for additional confirmation, a bearish candlestick pattern would suffice.
USD/JPY:
Kerbed within familiar levels, the USD/JPY remained lethargic Thursday, down 0.17%. Data out of Japan disappointed in early hours as August’s preliminary Nikkei manufacturing PMI came in at 49.5, below market consensus, though ticked higher than the previous 49.4.
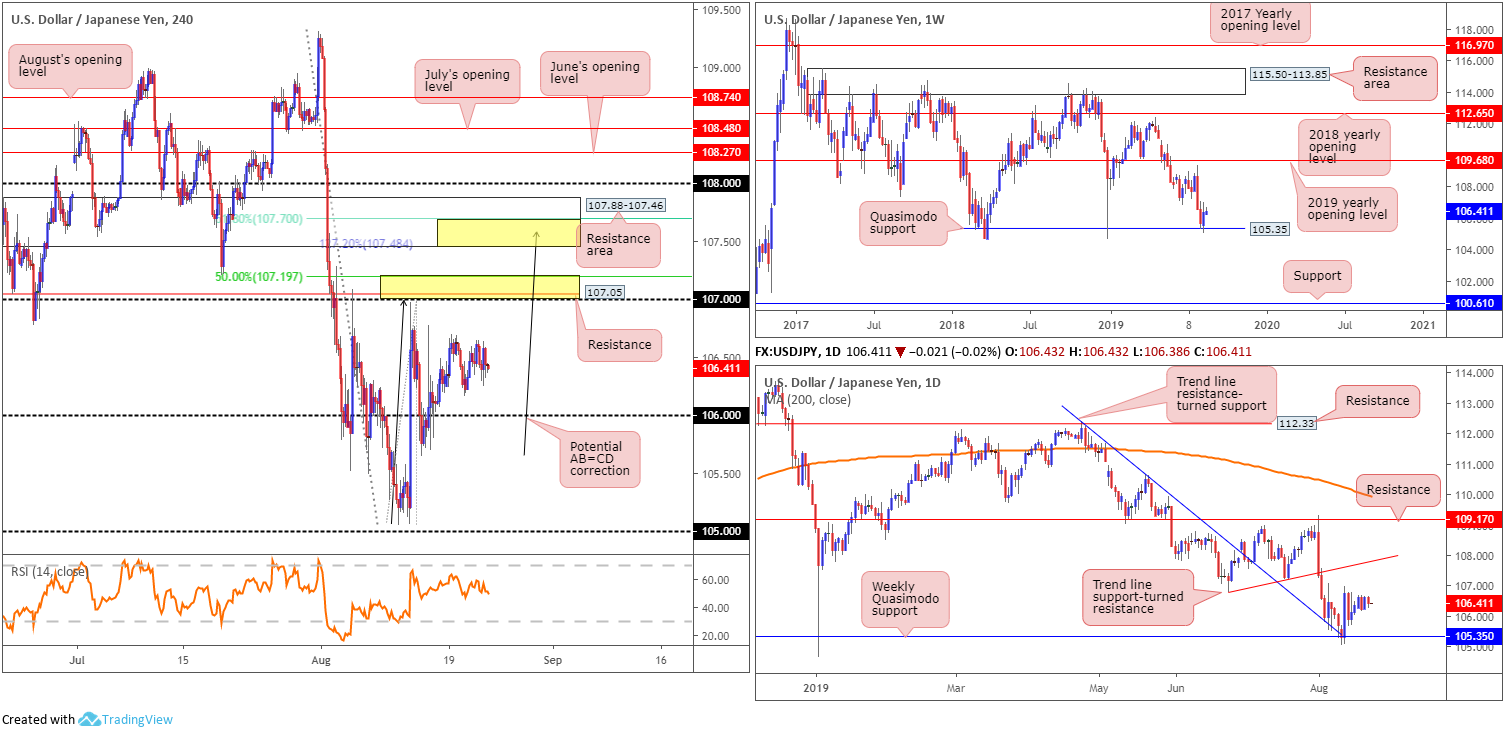
From a technical perspective, H4 action, as highlighted in previous reports, has the 106 handle in view as its next support, whereas to the upside resistance resides at 107.19/107, comprised of a 50.0% retracement value at 107.19, a resistance level at 107.05 and the round number 107 (lower yellow zone). Above here, we also have another area of resistance formed at 107.88-107.46, with specific emphasis on the 107.70/107.48 region (upper yellow zone), comprised of a 61.8% Fibonacci retracement value at 107.70 and an AB=CD (black arrows) 127.2% Fibonacci extension at 107.48.
Weekly Quasimodo support at 105.35 – a level that already proved its worth by holding the unit higher at the beginning of the year – contained losses last week, encouraging a run higher that snapped a two-week losing streak. Outside of this base, limited support is evident until 100.61, whereas a push north has the 2019 yearly opening level at 109.68 to target.
In tandem with the weekly Quasimodo support, daily trend line resistance-turned support (extended from the high 112.40) also entered the mix last week. The convergence of these two higher-timeframe levels witnessed a strong recovery take shape on August 13. This foundation supports further buying on this scale, at least until we reach trend line support-turned resistance (etched from the low 106.78).
Areas of consideration:
Outlook unchanged.
A reaction from 106 is a possibility today, along with a run towards 107.19/107. Psychological levels are prone to whipsaws, or more commonly referred to as ‘stop runs’, therefore waiting for additional H4 bullish candlestick confirmation prior to committing funds is worth considering (entry/risk set according to candlestick range).
While the lower yellow H4 zone at 107.19/107 could contain price action, the research team still feels the area holding the ‘juice’ in this market is 107.88-107.46, though even here, a fakeout to 108 is a possibility given it merges closely with the daily trend line support-turned resistance.
USD/CAD:
Thursday had Statistics Canada report wholesale sales climbed 0.6% to $64.1 billion in June following a drop of 1.9% in May. WTI prices eked out marginal losses, further cementing a position sub $56.00, and the US dollar index also chalked up minor losses, though remained above 98.00.
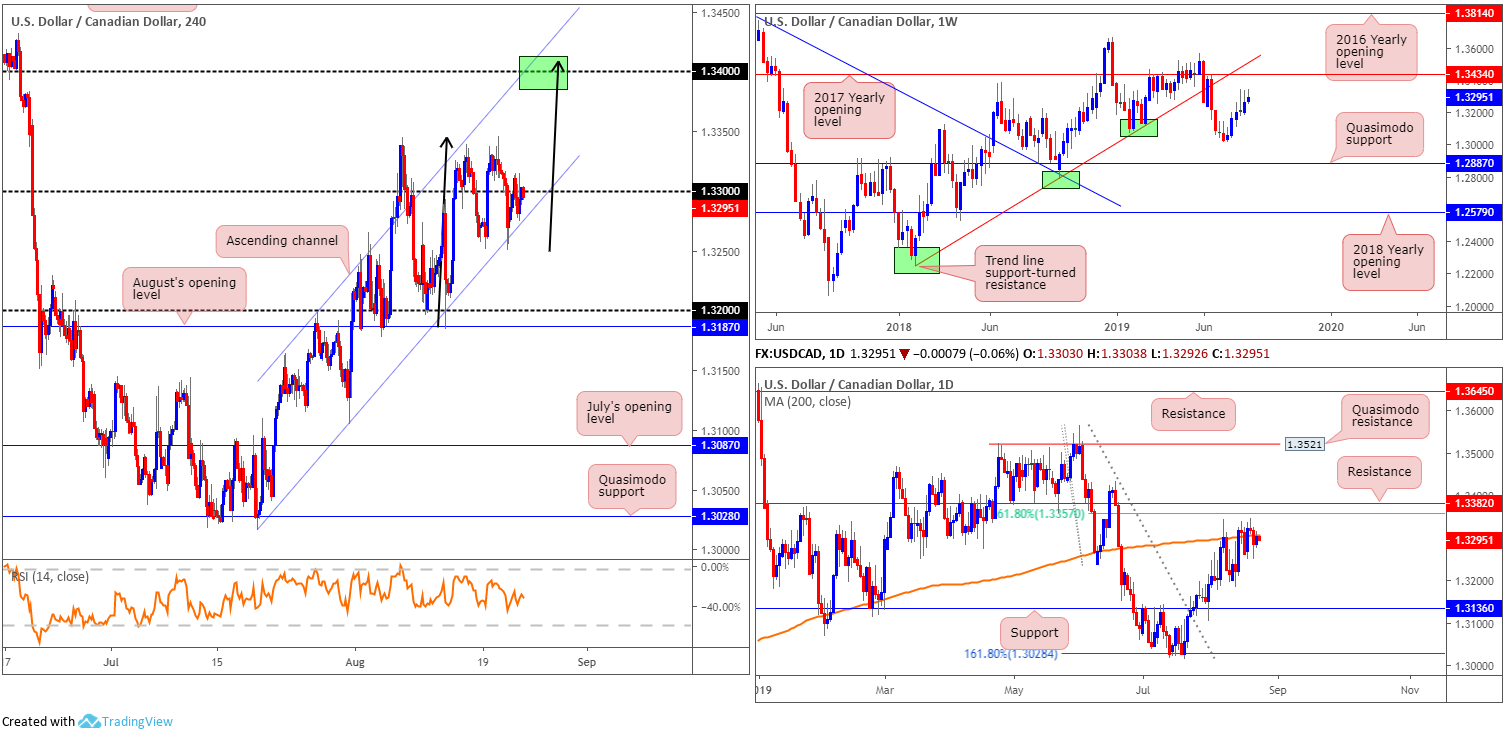
As evident from the H4 timeframe this morning, price action is attempting to brush aside 1.33 after defending channel support extended from the low 1.3025. A decisive move above 1.33, as aired in recent analysis, exhibits scope to approach channel resistance fixed from the high 1.3186 and 1.34. What’s also notable from a technical perspective is a possible ABCD correction (black arrows) forming that terminates a shade above 1.34.
The longer-term weekly technical picture continues to top just south of the 2017 yearly opening level at 1.3434, closely shadowed by trend line support-turned resistance. Focus on the daily timeframe remains centred around the 200-day SMA (orange at 1.3307), traced close by resistance drawn from 1.3382 and a closely converging 61.8% resistance at 1.3357.
Areas of consideration:
Outlook unchanged.
Additional buying, according to the weekly timeframe, is a possibility until we reach 1.3434. Therefore, daily resistances mentioned above at 1.3307, 1.3357 and 1.3382 may give way. A way of verifying buyer intent is on the back of a H4 close above 1.33, perhaps unbolting the door towards channel resistance/1.34. In the event this comes to fruition, a long above 1.33 is an option, either on the breakout candle, or on a possible retest motion. In any case, using the candlestick structure to base entry and risk levels from is likely the method of choice for many traders.
USD/CHF:
Despite the US dollar index wrapping up Thursday marginally on the back foot, the USD/CHF eked out mild gains, adding 0.12%. Focus now shifts to Powell’s scheduled speech at Jackson Hole.
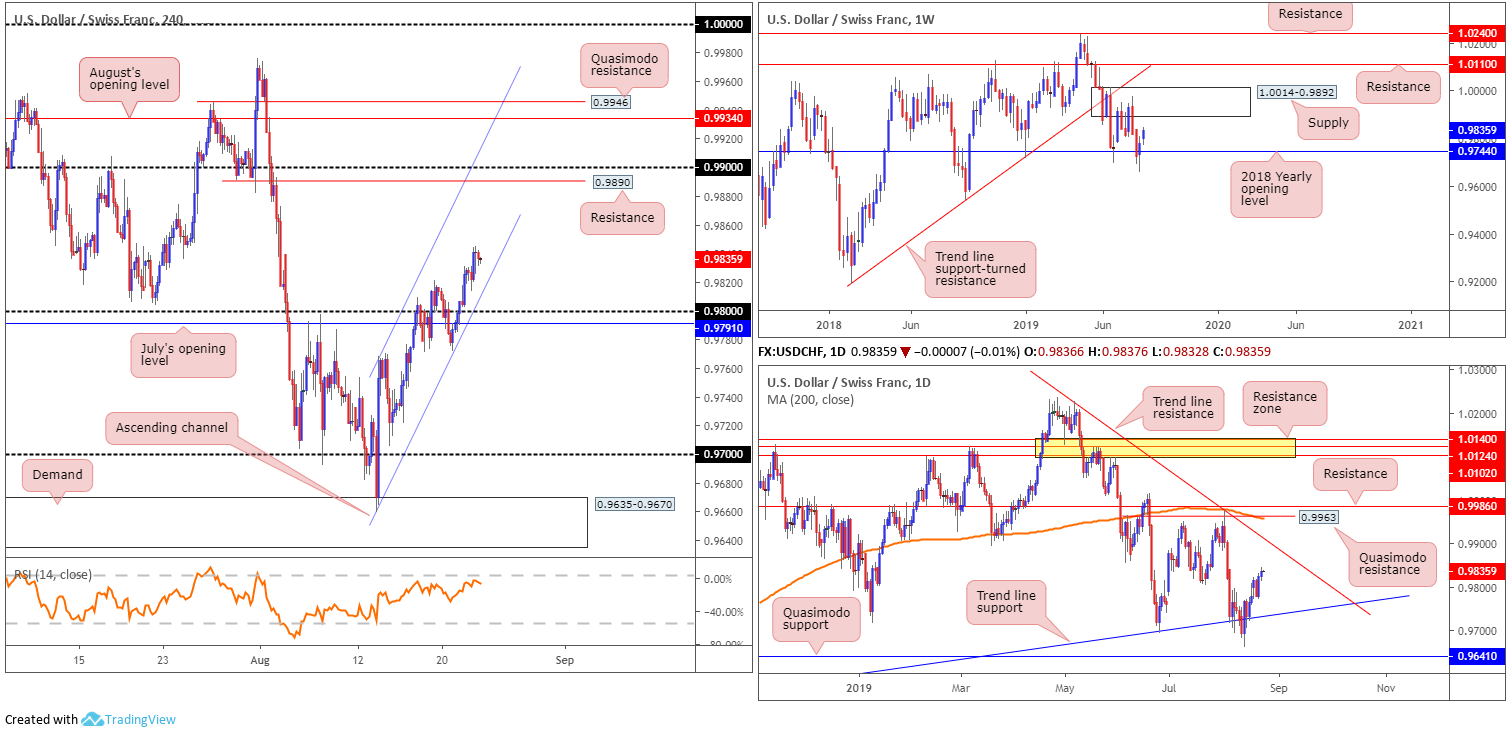
With the 0.98 handle now a distant memory on the H4 scale, resistance at 0.9890 is in the firing range as the next upside target, closely trailed by the 0.99 handle. Traders may also want to acknowledge the H4 candles are compressing within an ascending channel formation (0.9659/0.9768), and the RSI indicator is seen hovering just south of overbought territory.
In terms of higher-timeframe technical structure, limited change has been observed since yesterday’s report.
Weekly price found stable ground at the 2018 yearly opening level drawn from 0.9744, tilting towards supply coming in at 1.0014-0.9892. Another factor bolstering the buyers is daily structure recently finding a floor off trend line support extended from the low 0.9542. Note also Wednesday’s daily candle produced a bullish engulfing pattern, which generated follow-through buying yesterday. The next upside target can be seen at trend line resistance pencilled in from the high 1.0226.
Areas of consideration:
For those who read Thursday’s technical briefing you may recall the following:
Chart studies on all three timeframes analysed reveal an upside bias, with generous upside to be had it seems. The H4 displays a clear runway to 0.9890, the daily timeframe to also around 0.99 in the form of a trend line resistance and weekly price eyeing the lower boundary of supply at 0.9892.
Entering at current price is an option, with protective stop loss orders sited beyond July’s opening level at 0.9791. The risk equates to a little more than 30 points, though upside offers in excess of at least 70 points to the first upside objective.
Conservative traders, on the other hand, may opt to wait and see if another retest of H4 channel support occurs, preferably in the shape of a bullish candlestick signal, before initiating a trade. Not only will this provide additional support, the candlestick formation will likely offer traders a path to healthier risk/reward, assuming entry/risk levels are based on the back of its structure.
Traders who entered long sit with minor gains, at the time of writing.
Dow Jones Industrial Average:
US equities concluded mixed Thursday as Federal Reserve officials casted doubts on further rate cuts and a reading on domestic manufacturing stoked concerns over the health of the economy. The Dow Jones Industrial Average added 49.51 points, or 0.19%; the S&P 500 declined 1.48 points, or 0.05% and the tech-heavy Nasdaq 100 erased 25.79 points, or 0.33%. Focus shifts to Fed Chairman Jerome Powell today, set to deliver a speech at a yearly central banking symposium in Jackson Hole, Wyoming.
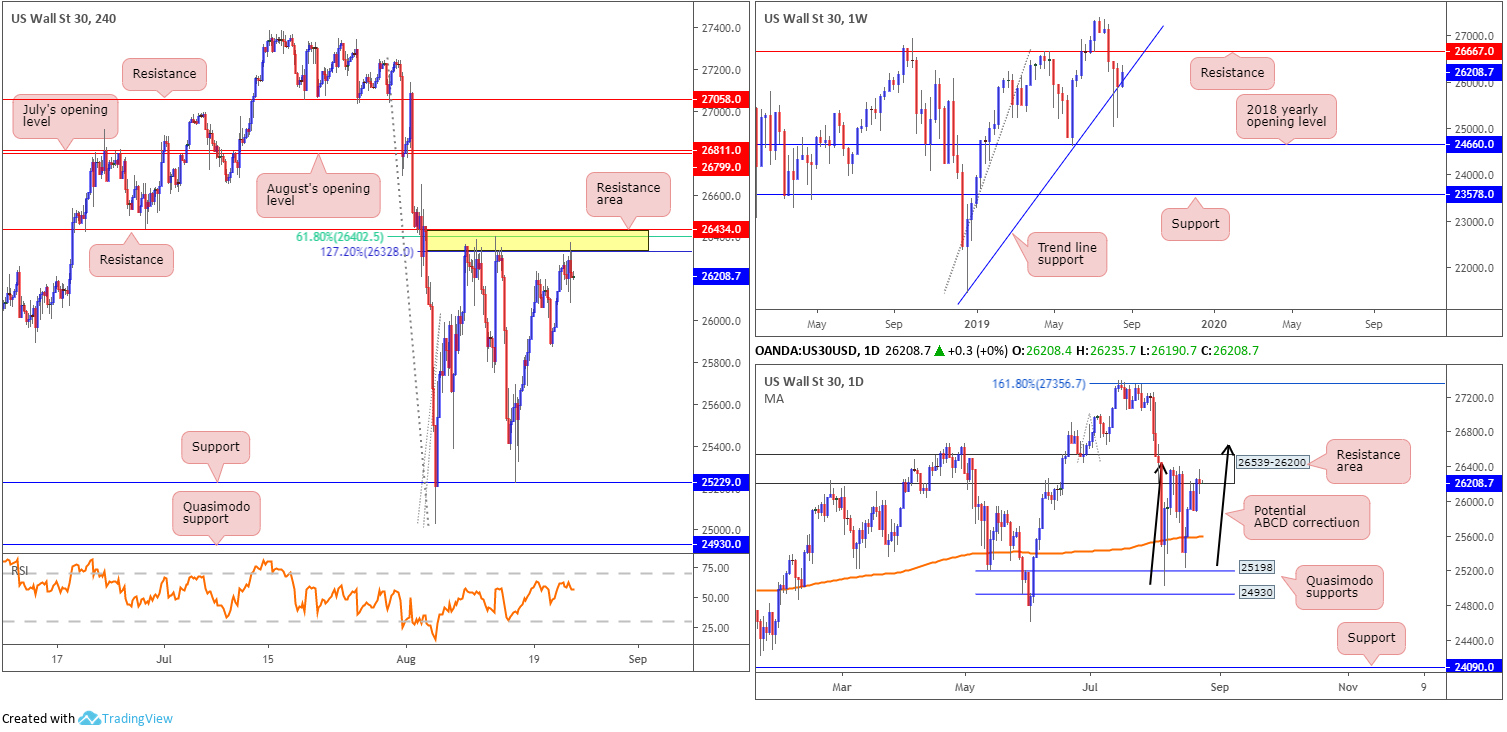
Technical chart studies reveal H4 action crossed swords with a familiar resistance zone at 26434/26328 (comprised of resistance at 26434, a 127.2% Fibonacci ext. point at 26328 and a 61.8% Fibonacci retracement value at 26402) Thursday and held price action lower. This is the third time this month the index has responded from here. Beyond this base, traders must contend with July and August’s opening levels at 26811 and 26799, respectively, whereas a rejection from 26434/26328 may steer the index to Wednesday’s low at 25871, followed by support seen at 25229.
Price action on the daily timeframe remains unchanged in terms of technical structure, bounded by a Quasimodo support coming in at 25198 and a resistance area forged at 26539-26200, which, as you can see, entered the mix recently. What’s notable is the said resistance zone is sited just south of weekly resistance at 26667, which happens to fuse closely with a daily ABCD correction (black arrows). It is also worth noting the current daily resistance area merges with the said H4 zone.
Areas of consideration:
For traders who read Thursday’s brief you may recall the following piece:
While there’s a chance weekly price may make a play for resistance at 26667 from the current trend line support (extended from the low 21452), the odds of a reaction being seen from the H4 resistance area at 26434/26328 is strong, though positioning protective stop-loss orders beyond the daily resistance zone at 26539-26200 is recommended. This simply adds another layer of protection from a whipsaw through the narrow H4 resistance area.
Well done to any of our readers who managed to sell the aforesaid H4 resistance zone.
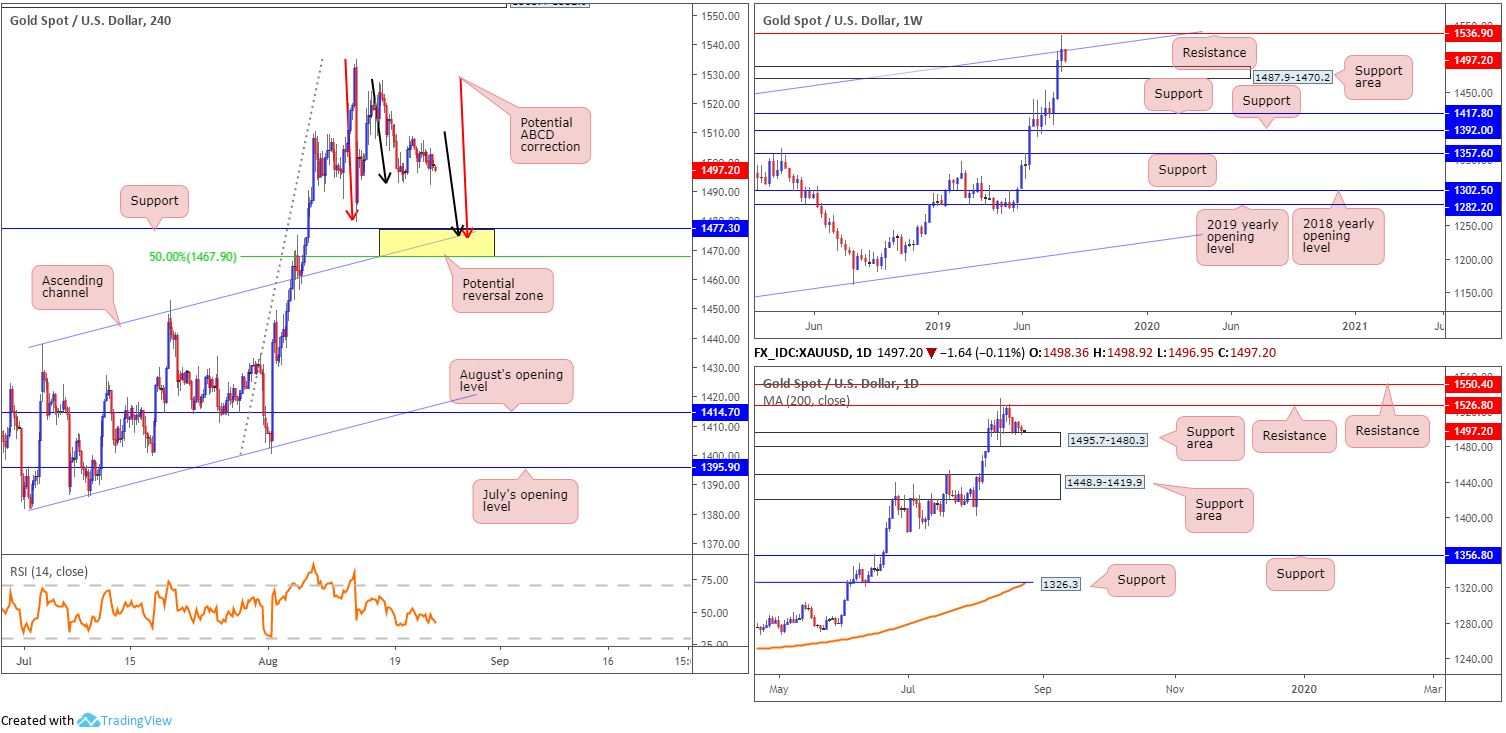
XAU/USD (GOLD):
Since the beginning of the week, bullion’s technical landscape has been limited in terms of structural change and trading opportunity. Therefore, much of the following will echo thoughts expressed in recent reports.
Kicking things off with a look at the weekly timeframe, the yellow metal trades marginally beneath channel resistance (etched from the high 1375.1), targeting a support area at 1487.9-1470.2. Overhead, it is also worth keeping a tab on resistance at 1536.9.
The daily timeframe has price action rebounding from a support area coming in at 1495.7-1480.3 (glued to the top edge of the weekly support area), with the possibility of a run materialising towards resistance at 1526.8.
Across the page on the H4 timeframe, eyes likely remain on the 1467.9/1477.3 area for potential longs. Comprised (yellow) of a potential ABCD correction at 1473.8 (red arrows), another potential ABCD correction (black arrows) at the same level, a channel resistance-turned support extended from the high 1437.7 and a 50.0% retracement ratio at 1467.9, 1467.9/1477.3 stands a good chance of holding price action higher if tested. In addition, it might also be worth noting the H4 support area is sited around the lower edge of the weekly support area mentioned above at 1487.9-1470.2, though is positioned outside of the borders of the daily support area at 1495.7-1480.3.
Areas of consideration:
Outlook also remains unchanged here.
Entry at 1477.3 is an option at the H4 support area, with a protective stop-loss order placed at 1465.2. Traders wanting to add a little more confirmation may opt to wait and see if H4 price chalks up a candlestick signal before committing funds to the market. That way, buyer intent is visible, as well as having another base (the candlestick structure) to set entry and risk levels.
In terms of initial upside targets, the research team suggests considering the 38.2%/61.8% Fibonacci retracements of the A-D legs, once the ABCD formation completes.
The accuracy, completeness and timeliness of the information contained on this site cannot be guaranteed. IC Markets does not warranty, guarantee or make any representations, or assume any liability regarding financial results based on the use of the information in the site.
News, views, opinions, recommendations and other information obtained from sources outside of www.icmarkets.com.au, used in this site are believed to be reliable, but we cannot guarantee their accuracy or completeness. All such information is subject to change at any time without notice. IC Markets assumes no responsibility for the content of any linked site.
The fact that such links may exist does not indicate approval or endorsement of any material contained on any linked site. IC Markets is not liable for any harm caused by the transmission, through accessing the services or information on this site, of a computer virus, or other computer code or programming device that might be used to access, delete, damage, disable, disrupt or otherwise impede in any manner, the operation of the site or of any user’s software, hardware, data or property.