Key risk events today:
UK Final Services PMI
(Previous analysis as well as outside sources – italics).
EUR/USD:
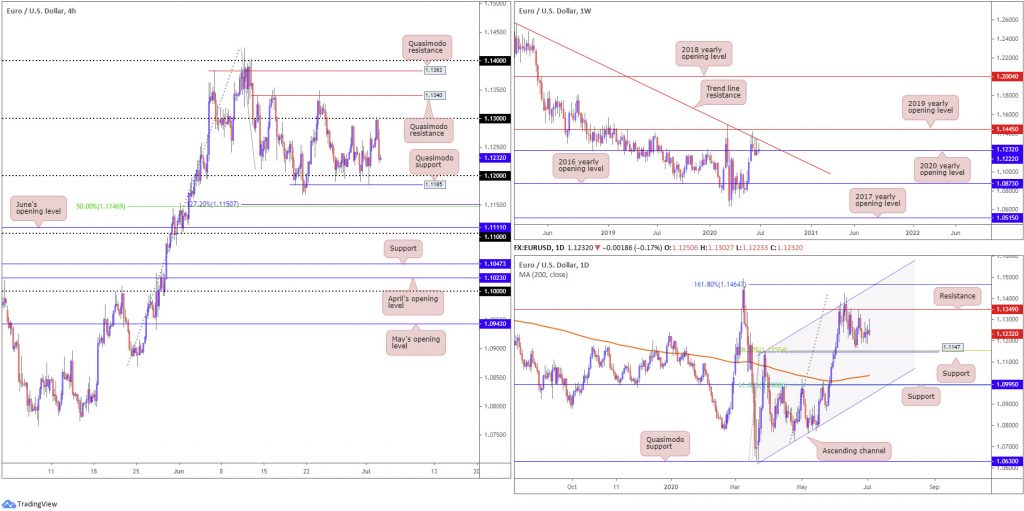
The aftermath of yesterday’s upbeat US employment data and declining unemployment rate witnessed the DXY hook a firm bid. This, following a retest at the underside of 1.13 on the H4, directed EUR/USD lower, settling 30 pips shy of 1.12 heading into the European close.
Continued selling on the H4 today may eventually surpass 1.12 and Quasimodo support close by at 1.1185 to approach a 127.2% Fibonacci extension point at 1.1150 and 50.00% retracement ratio at 1.1146.
Further afield, trade remains fading long-standing trend line resistance, taken from the high 1.2555, on the weekly timeframe. Consequently, the 2020 yearly opening level at 1.1222 is under fire. Any sustained move below the aforementioned barrier seats the 2016 yearly opening level at 1.0873 on the hit list, while a EUR/USD bid shifts focus on the possibility of reaching the 2019 yearly opening level at 1.1445.
The story on the daily timeframe, since the beginning of June, has price languishing south of resistance at 1.1349. Support derived from the 1.1147 27 March high, therefore, could soon become a reality, a level that merges closely with a 38.2% Fibonacci retracement ratio at 1.1155. Interestingly, breaching 1.1147 reveals the 200-day SMA (orange – 1.1036), closely followed by support at 1.0995 and a 61.8% Fibonacci retracement ratio at 1.0988.
Areas of consideration:
Traders long the 1.12 fakeout, a noted setup in previous writing, hit take-profit at 1.13 yesterday. Well done to any traders who managed to hold overnight.
A break of 1.12/1.1185 would be interesting on the H4, as the 127.2% Fibonacci extension point at 1.1150 and 50.00% retracement ratio at 1.1146 not only puts forward a potential support area to consider, this base also converges with daily support at 1.1147 and a 38.2% Fibonacci retracement ratio at 1.1155.
GBP/USD:
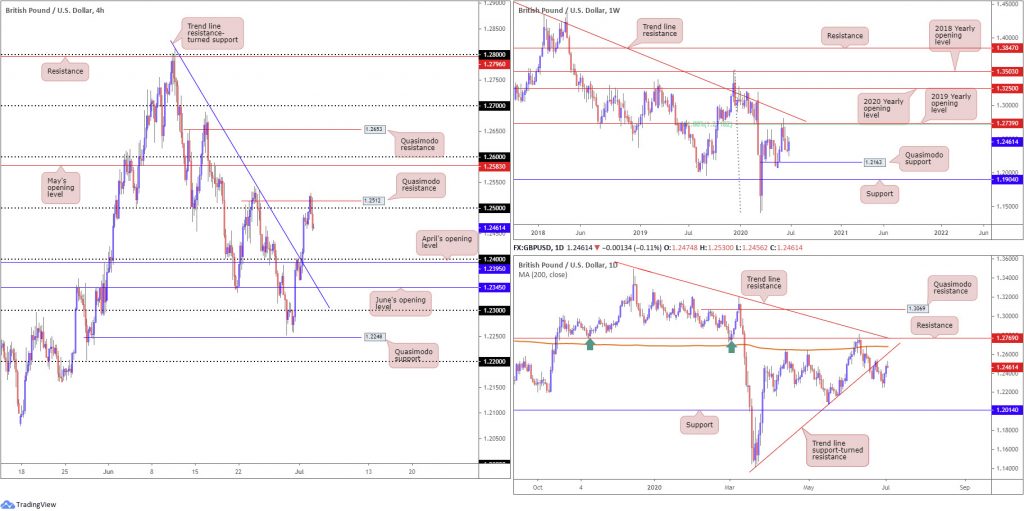
The British pound found thin air above 1.25 against the US dollar Thursday, fading H4 Quasimodo resistance at 1.2512 on the back of better-than-anticipated US jobs data. The combination of 1.25 psychological resistance and Quasimodo resistance was a noted port of resistance to watch in Thursday’s technical briefing – well done to any readers who managed to latch onto the move lower.
Technical studies on the higher timeframes shows the current weekly candle emphasising a bullish tone, despite room to move lower to 1.2163 (Quasimodo support). Follow-through buying is certainly a possibility from here until shaking hands with a 61.8% Fibonacci retracement ratio at 1.2718 and 2019 yearly opening level at 1.2739.
Price action on the daily timeframe, meanwhile, formed a shooting star candlestick pattern yesterday, snapping a two-day bullish phase. Resistance on this scale can be found at a trend line support-turned resistance, taken from the low 1.1409. In terms of downside support, aside from the 1.2251 June 29 low, there appears room for an approach to support coming in at 1.2014, sited just south of the 1.2075 May 18 low. Before reaching this far south, though, weekly Quasimodo support must be absorbed at 1.2163.
Areas of consideration:
Technically, on the H4, room to dip further is visible to as far south as the 1.24 vicinity, a welcomed sight for those short 1.25/1.2512. Therefore, lower-timeframe traders may seek bearish themes off local structure today, ultimately targeting 1.24.
AUD/USD:
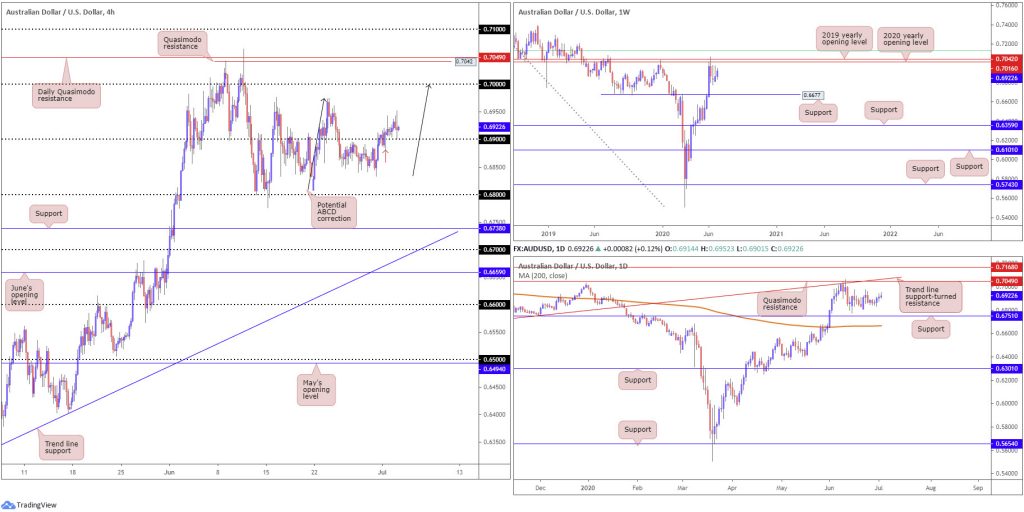
AUD/USD pencilled in another wave of modest buying Thursday, in attempt to establish ground north of 0.69 on the H4. This, as underlined in Thursday’s technical briefing, shines the spotlight on the 0.6976 peaks, as well as the key figure 0.70 and a converging ABCD pattern (black arrows).
Resistance, forged in the shape of a 2020 yearly opening level and a 2019 yearly opening level, at 0.7016 and 0.7042, respectively, continues to offer a dominant presence on the weekly timeframe. It might also interest traders to note that just above the said resistances we have a 61.8% Fibonacci retracement ratio at 0.7128 (green). In terms of support, crosshairs remain fixed on 0.6677.
From the daily timeframe, we remain wandering in no man’s land. Despite this, structure is still visible nearby. Quasimodo resistance at 0.7049 is in sight, merging closely with trend line support-turned resistance, taken from the low 0.6670. Attention on this timeframe also remains at support coming in from 0.6751. Interestingly, lurking beneath here we also have the 200-day SMA (orange – 0.6667), located close by weekly support mentioned above at 0.6677.
Areas of consideration:
With H4 candles establishing a position above 0.69, this will likely drive buyers into the market.
Breakout buyers may already be long, with protective stop-loss orders tucked under the 0.6877 low (red arrow). Conservative traders, on the other hand, may have entered on yesterday’s dip to 0.6901 (near-retest at 0.69).
Regardless of the entry technique, upside targets rest at 0.6976 and 0.70.
USD/JPY:
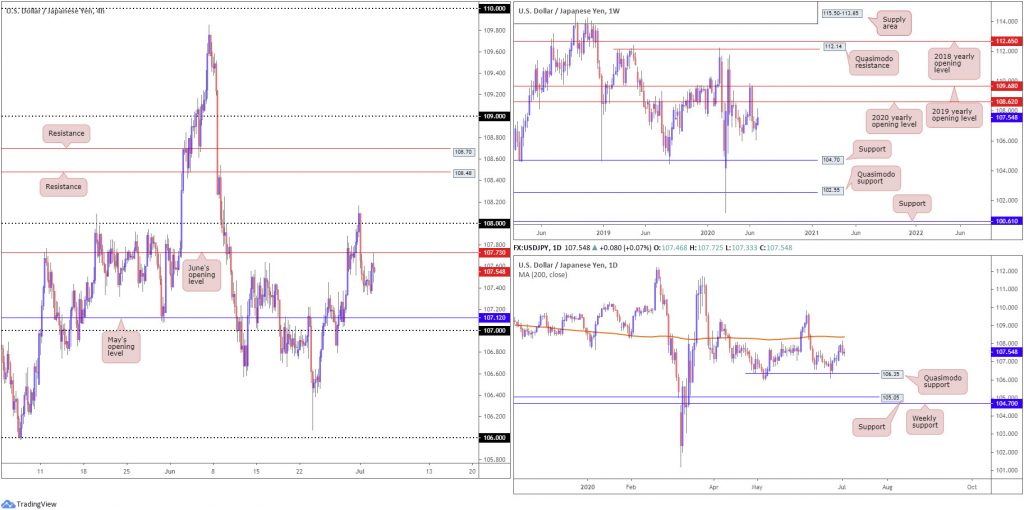
Stellar US jobs data lifted USD/JPY on Thursday, topping just south of June’s opening level at 107.73 on the H4 timeframe.
The latter was a watched resistance in Thursday’s technical briefing, with downside exhibiting scope to approach May’s opening level at 107.12 as well as the 107 handle.
Snapping a two-day bullish phase and shaping a bearish outside day on Wednesday, daily price, albeit leaving behind the 200-day SMA (orange – 108.37), brings attention back to Quasimodo support at 106.35. Meanwhile, on the weekly timeframe, with the recent push ahead of the 105.98 6th May low, price could still potentially advance to the 2020 yearly opening level at 108.62.
Areas of consideration:
Sellers south of 107.73, given the recent daily bearish outside day, are likely taking aim at 107.12/107 today, offering reasonable risk/reward.
USD/CAD:
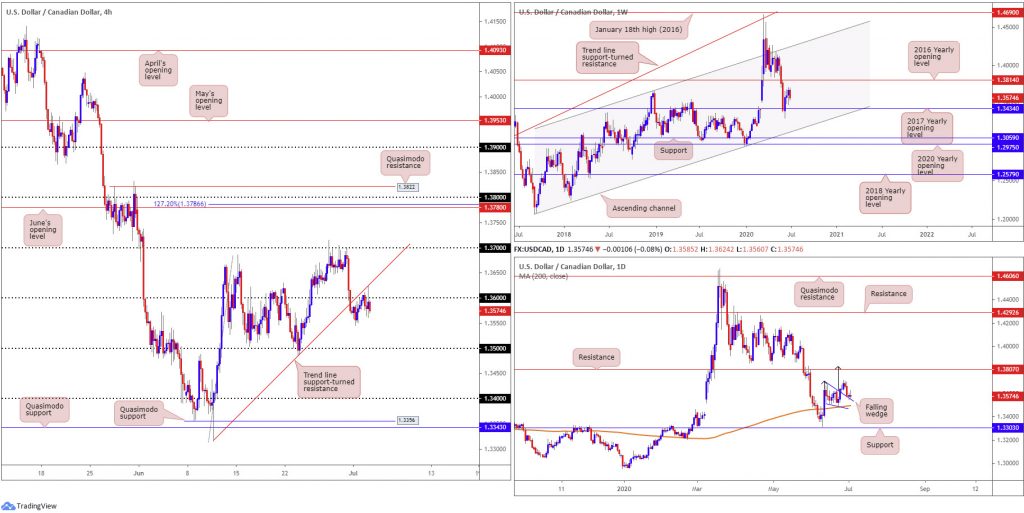
Price action, in similar fashion to Wednesday, offered a subdued tone Thursday. Of note, however, Thursday had price mildly surpass 1.36 to the upside and shake hands with trend line support-turned resistance, taken from the low 1.3315. As of writing, sellers are attempting to explore lower levels sub 1.36.
As highlighted in Thursday’s technical briefing, the retest at the 1.36/trend line resistance may be problematic for sellers as daily price is also retesting the top edge of the current falling wedge pattern as a support (1.3686/1.3504). Take-profit targets out of a falling wedge can be measured by taking the base value and adding this figure to the breakout point (black arrows), which as you can see in this case, converges closely with the next daily resistance at 1.3807.
From the weekly timeframe, room to advance ahead of the 2017 yearly opening level at 1.3434 remains a possibility. A potential hurdle to be aware of, though, falls in by way of the 2016 yearly opening level at 1.3814, with follow-through buying likely to try and tackle a dense block of supply between 1.4190/1.3912.
Areas of consideration:
Usually the higher timeframes take precedence over lower-timeframe levels. Therefore, the retest at 1.36, although appealing, may still fall flat. A H4 bearish candlestick signal materialising from this region, nonetheless, could still tempt selling.
A H4 close above 1.36, given the daily timeframe’s position, could stimulate a recovery beyond H4 trend line support-turned resistance, from 1.3315, towards at least 1.37, with an ultimate upside target at 1.38ish (higher-timeframe resistances).
USD/CHF:
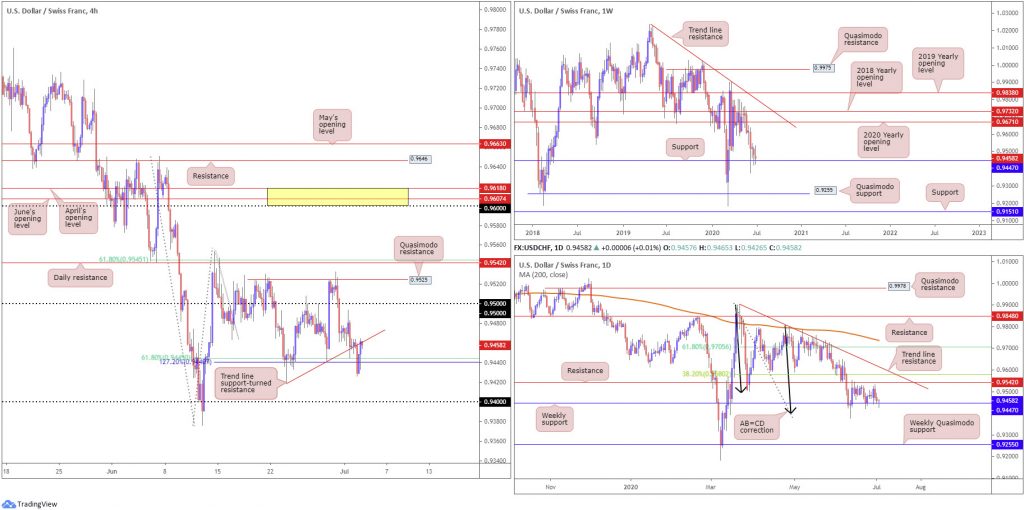
USD/CHF found itself by-passing Fibonacci support on the H4 timeframe Thursday: the 61.8% Fibonacci retracement ratio at 0.9445 and 127.2% Fibonacci extension point at 0.9440. The pair’s resilience to the downside was reconfirmed yesterday after swiftly reclaiming the aforementioned Fibonacci supports on better-than-anticipated US employment data. Trend line support-turned resistance, extended from the low 0.9420, consequently serves as a potential hurdle to the upside. Overcoming this base has the 0.9493 July 1st high to target, closely shadowed by 0.95.
Elsewhere, weekly support at 0.9447 remains in play. Despite the lack of enthusiasm off the latter so far, in the event we do see things turn here, the 2020 yearly opening level at 0.9671 is marked as the next resistance on the weekly timeframe, stationed close by the 2018 yearly opening level at 0.9732.
On the daily timeframe, our technical outlook remains unchanged. The initial break of weekly support at 0.9447 (11 June) threw breakout sellers into a bear trap as daily buyers vigorously defended AB=CD structure (black arrows) at 0.9395. The initial upside target out of the daily AB=CD pattern, traditionally speaking, can be found at the 38.2% Fibonacci retracement ratio at 0.9580 (derived from legs A-D), positioned above resistance at 0.9542, which, as you can see, has so far done a superb job in holding back buyers. In the event we overrun 0.9542 and also 0.9580 we could, according to traditional measures, cross swords with the next AB=CD target at 0.9705, the 61.8% Fibonacci retracement ratio, also taken from legs A-D. This implies a push above trend line resistance, taken from the high 0.9901.
Areas of consideration:
Thursday’s technical briefing emphasised the following (italics):
Weekly support at 0.9447 continues to remain a watched level in this market. Consequently, until this level surrenders, bullish strategies may be the way forward.
With H4 displaying bullish intent off the 61.8% Fibonacci retracement ratio at 0.9445/127.2% Fibonacci extension at 0.9440, these levels, coupled with weekly support at 0.9447, puts forward the possibility of a H4 trend line break. This may be enough to lure intraday buyers into the market, in favour of an approach to the 0.95ish base.
Dow Jones Industrial Average:
Major US equity benchmarks cheered a record surge in payrolls Thursday, as investors head into the three-day weekend. The Dow Jones Industrial Average rallied 92.39 points, or 0.36%; the S&P 500 advanced 14.15 points, or 0.45%, and the tech-heavy Nasdaq 100 concluded higher by 62.64 points, or 0.61%.
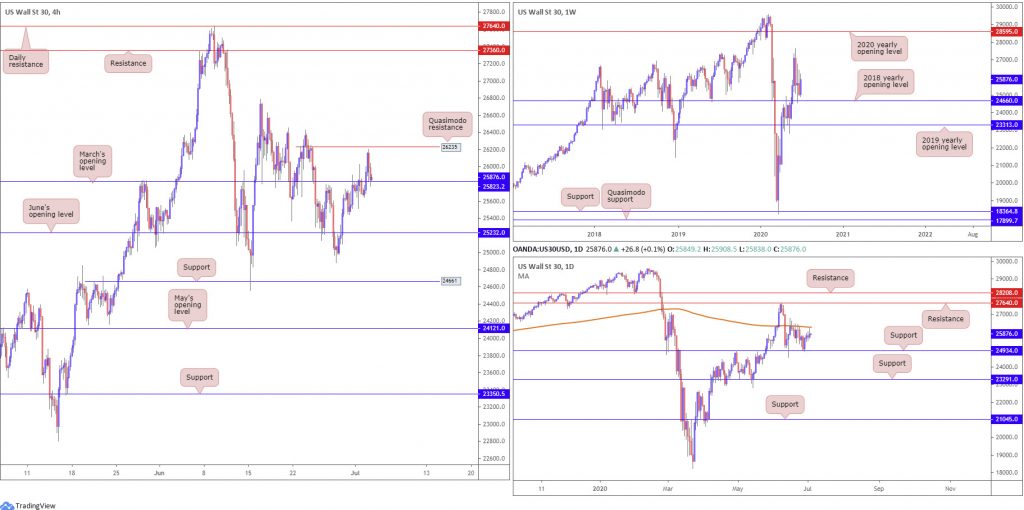
March’s opening level at 25823, based on the H4 timeframe, as expected, gave way Thursday and threw light on Quasimodo resistance at 26235. North of this base, aside from the 26787 June 16 high, limited resistance is visible, threatening the possibility of eventually reaching as far north as the resistance plotted at 27360.
Further out on the weekly timeframe, the 2018 yearly opening level at 24660 remains an important base of support. In the event buyers manage to keep their head above water here, we may eventually pull in the 27638 high, followed by the 2020 yearly opening level at 28595. Below 24660, however, traders’ crosshairs may be fixed on the 2019 yearly opening level at 23313.
Since June 15, price action has been ranging between the 200-day SMA (orange – 26263) and support from 24934 on the daily timeframe. Areas of note outside of this area fall in at resistance from 27640, with support plotted at 23291.
Areas of consideration:
In terms of the weekly timeframe, buyers appear poised to climb. However, buyers on the H4 and daily timeframes are unlikely to commit until H4 Quasimodo resistance at 26235 and 200-day SMA are overwhelmed.
As a result, a decisive H4 close above 26235 could be something to keep an eye on today/early next week. Alternatively, for traders confident the weekly timeframe’s position will eventually lift price, bullish scenarios off March’s opening level at 25823 could also be an option.
XAU/USD (GOLD):
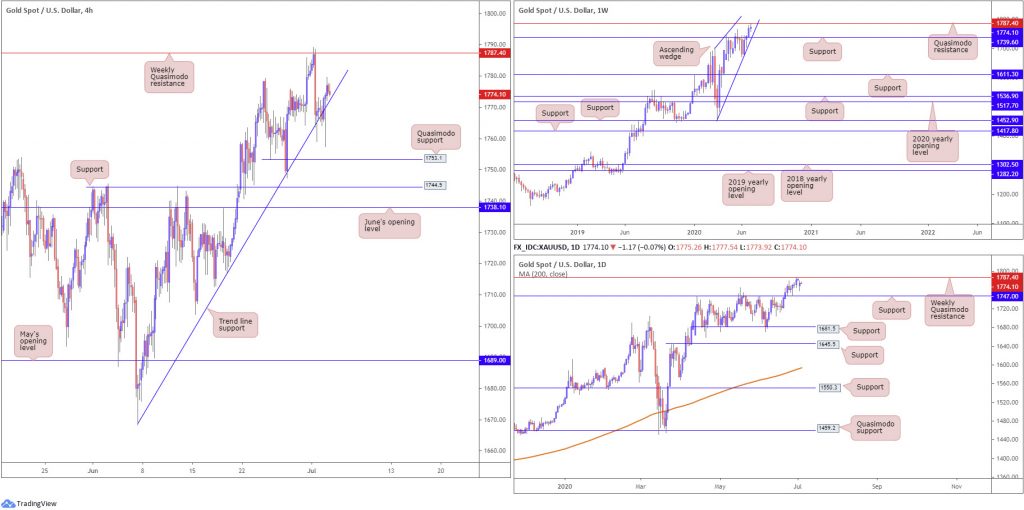
Despite a number of downside attempts, H4 trend line support, extended from the low 1668.3, survived Thursday.
In Wednesday’s technical briefing, the research team noted XAU/USD aggressively faded weekly Quasimodo resistance at 1787.4, a noted level to watch for in previous reports. Also interesting on the weekly timeframe is a potential ascending wedge pattern between 1451.4/1703.6, perhaps serving as a reversal pattern over the coming weeks.
Should sellers seize control today and conquer the aforementioned H4 trend line support, this serves as a sign we may be headed for H4 Quasimodo support at 1753.1, followed by daily support at 1747.0. Do bear in mind, however, the pair has been trading northbound since 2016, therefore shorts are effectively countertrend positions.
Areas of consideration:
Outlook remains unchanged.
Traders short the current weekly Quasimodo resistance level, as underlined in Thursday’s writing, have likely reduced risk to breakeven at H4 trend line support and maybe even banked a portion of profits.
A break of H4 trend line support not only clears the way for current sellers towards the aforementioned H4 supports underlined above, it also unlocks the possibility of fresh breakout setups.
The accuracy, completeness and timeliness of the information contained on this site cannot be guaranteed. IC Markets does not warranty, guarantee or make any representations, or assume any liability regarding financial results based on the use of the information in the site.
News, views, opinions, recommendations and other information obtained from sources outside of www.icmarkets.com.au, used in this site are believed to be reliable, but we cannot guarantee their accuracy or completeness. All such information is subject to change at any time without notice. IC Markets assumes no responsibility for the content of any linked site.
The fact that such links may exist does not indicate approval or endorsement of any material contained on any linked site. IC Markets is not liable for any harm caused by the transmission, through accessing the services or information on this site, of a computer virus, or other computer code or programming device that might be used to access, delete, damage, disable, disrupt or otherwise impede in any manner, the operation of the site or of any user’s software, hardware, data or property.

