
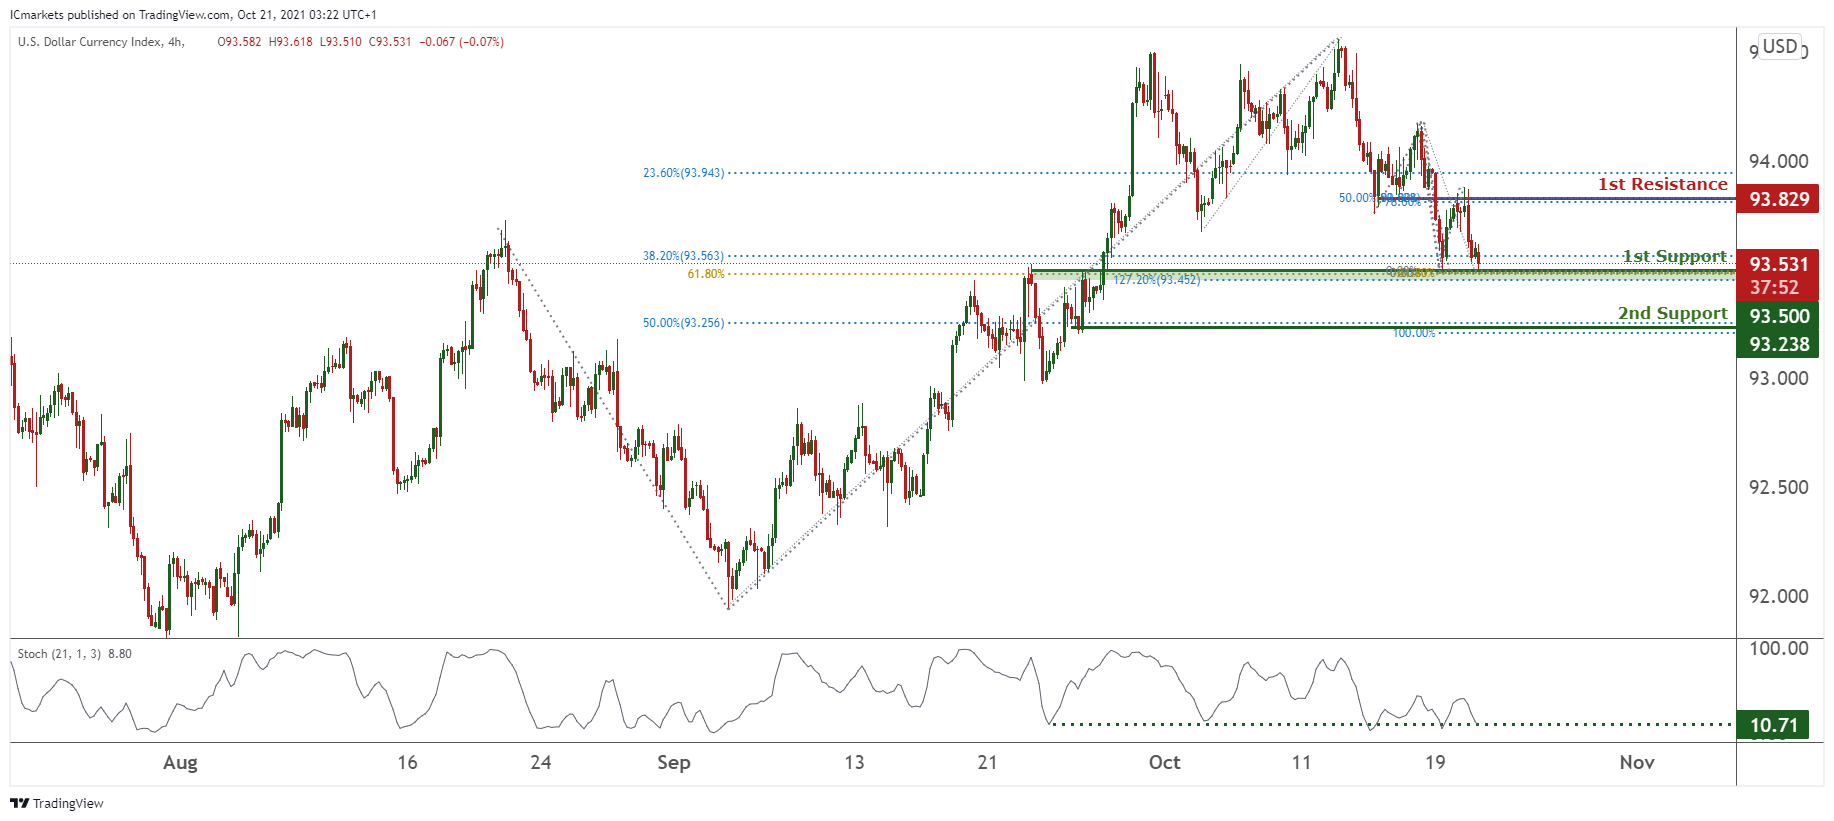
DXY:
On the H4 timeframe, prices are on a bearish momentum. As mentioned previously, prices have bounced off our 1st resistance at 93.829 which is a area of Fibonacci confluences and is currently going to test our 1st support at 93.531 in line with 38.2% Fibonacci retracement, 61.8% and 127.2% Fibonacci projection. Prices could potentially bounce back up towards our 1st resistance at 93.829. Stochastics are at a level where bounces took place previously. Alternatively, prices may dip towards our 2nd support at 93.238 in line with 50% and 100% Fibonacci extension.
Areas of consideration:
- H4 time frame,1st resistance at 93.829
- H4 time frame, 1st support at 93.531
- H4 time frame, 2nd support at 93.500
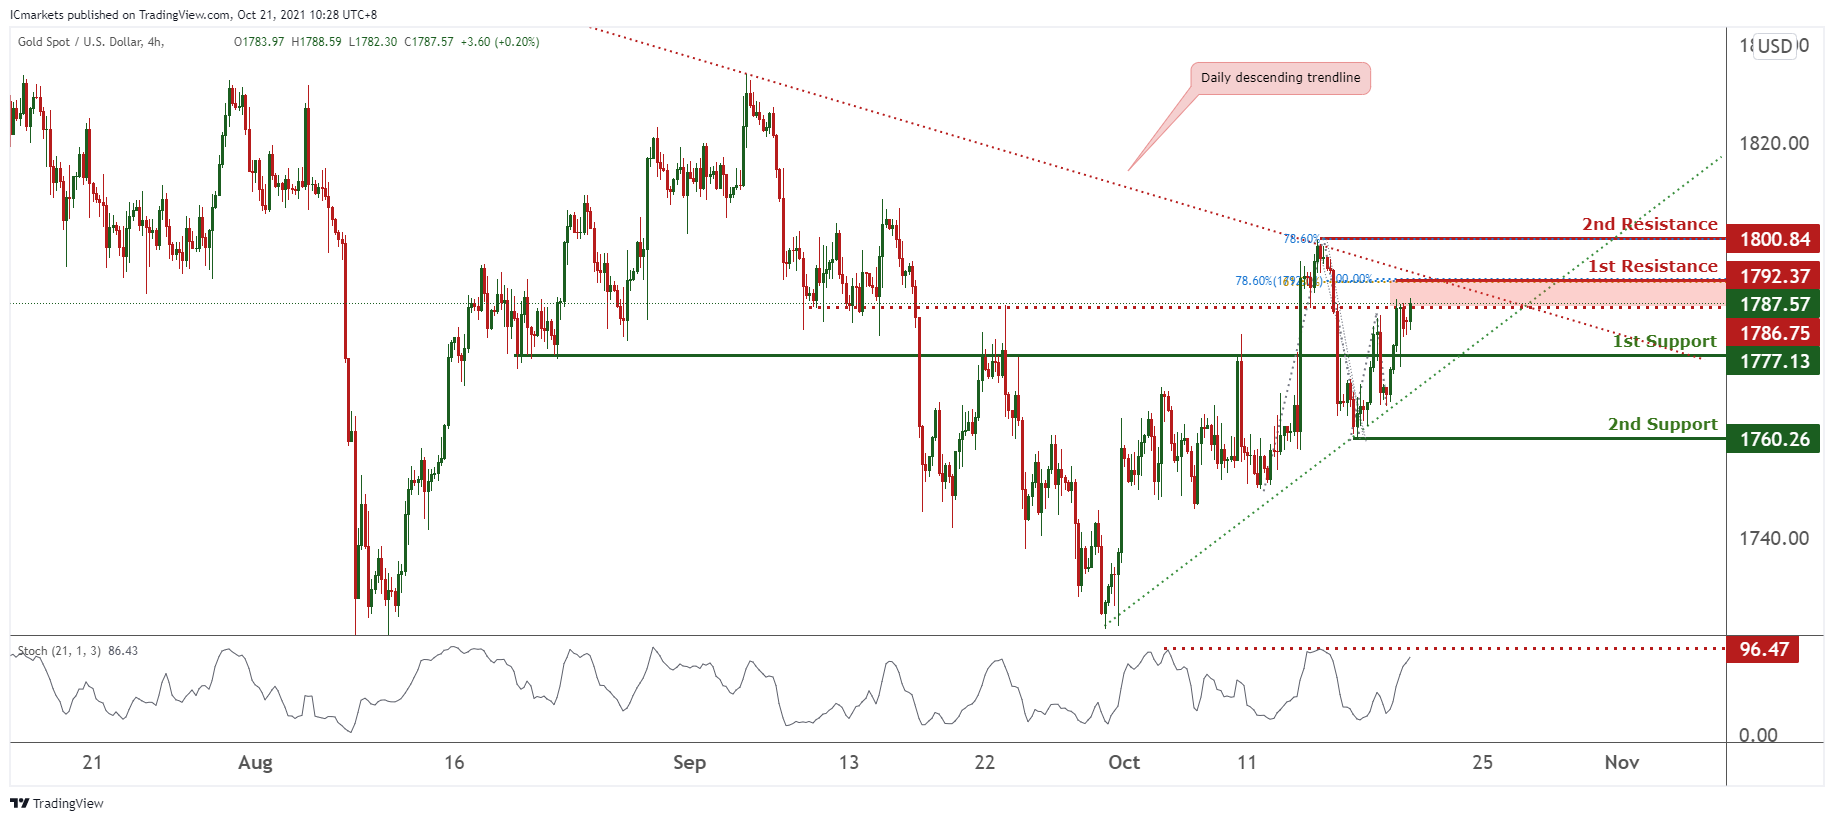
XAU/USD (GOLD):
On the H4 chart, prices are consolidating in a triangle. Prices have recently tested our previous intermediate resistance and have the potential to reverse to test our bullish trendline. We would watch our intermediate resistance at 1776.29 in line with 61.8% Fibonacci retracement for a small pullback. Stochastics are close to a level where pullbacks have taken place previously. Alternatively, surpassing the intermediate resistance would expect a climb towards our 1st resistance at 1792.37 in line with 78.6% Fibonacci retracement and 61.8% Fibonacci projection, also in line with our descending trendline.
Areas of consideration:
- 4h 1st support at 1777.13
- 4h intermediate resistance at 1787.57
- 4h 1st resistance at 1792.37
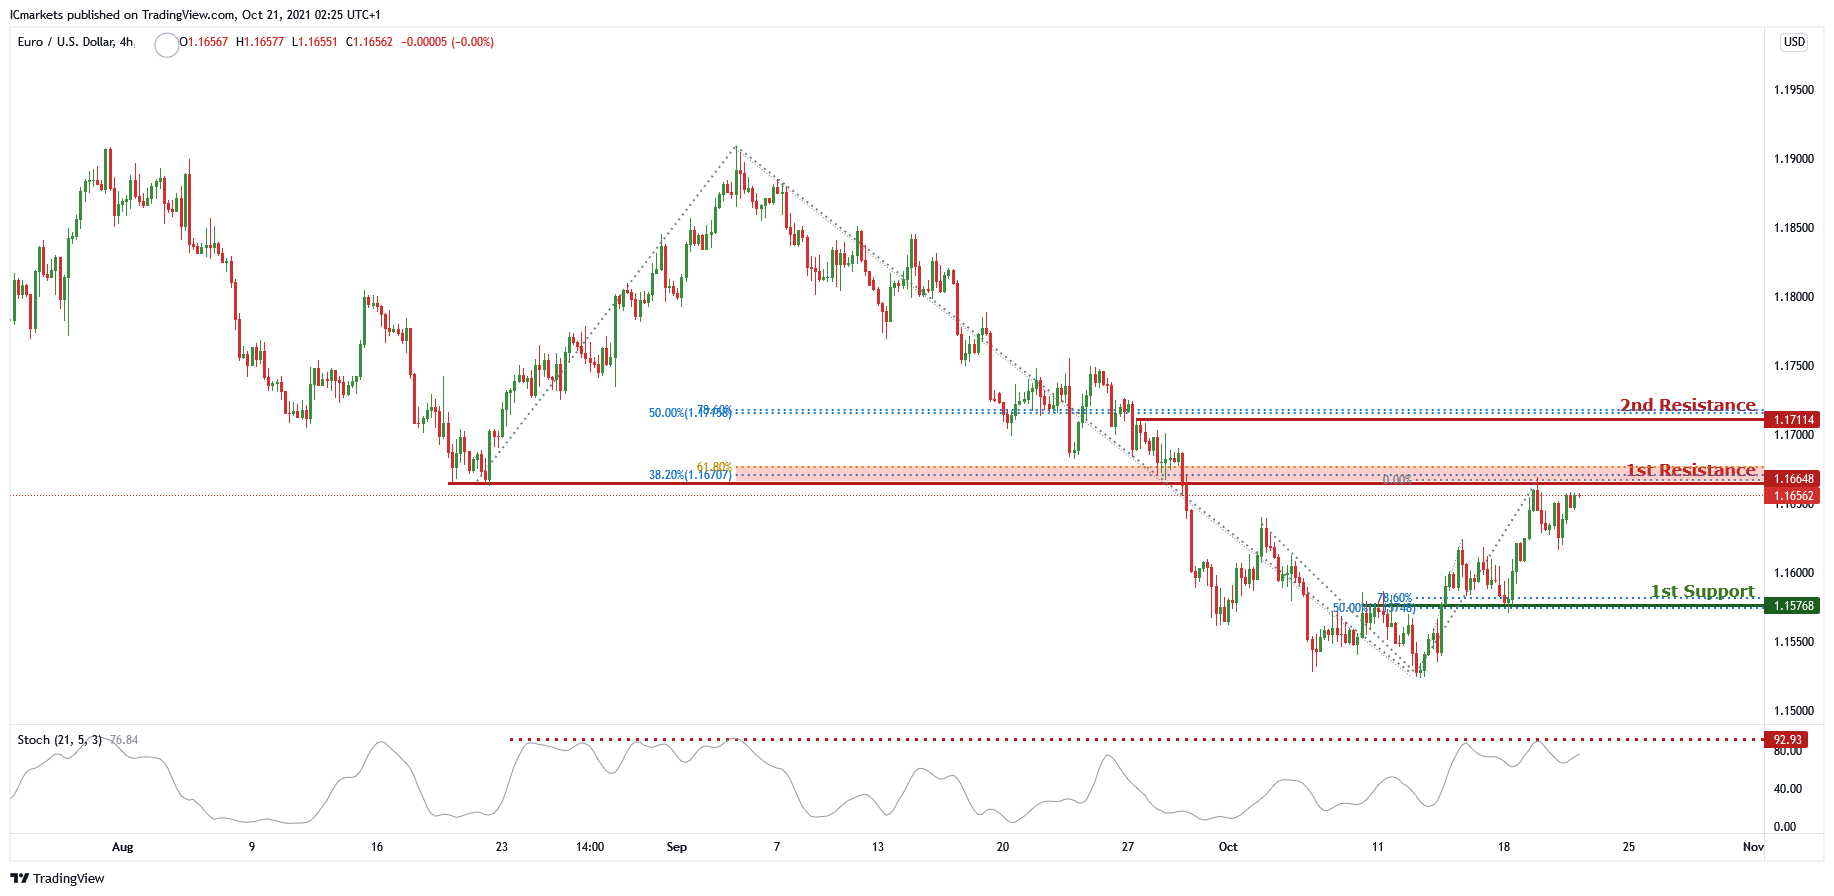
EUR/USD:
On the H4 chart, price has recently reacted from the first resistance which is also 50% retracement and 78.6% projection level. The first resistance is also a pullback resistance level. Price can then potentially dip back to the first support level of 1.15768 which is also 50% Fibonacci retracement and 78.6% projection level. Alternatively if price were to break the first resistance, it can potentially go to the 2nd resistance of 1.17104. Our temporary bearish bias is supported by the stochastic indicator as it is currently near resistance level.
Key considerations :
H4 first resistance – 1.16648
H4 first support – 1.15768
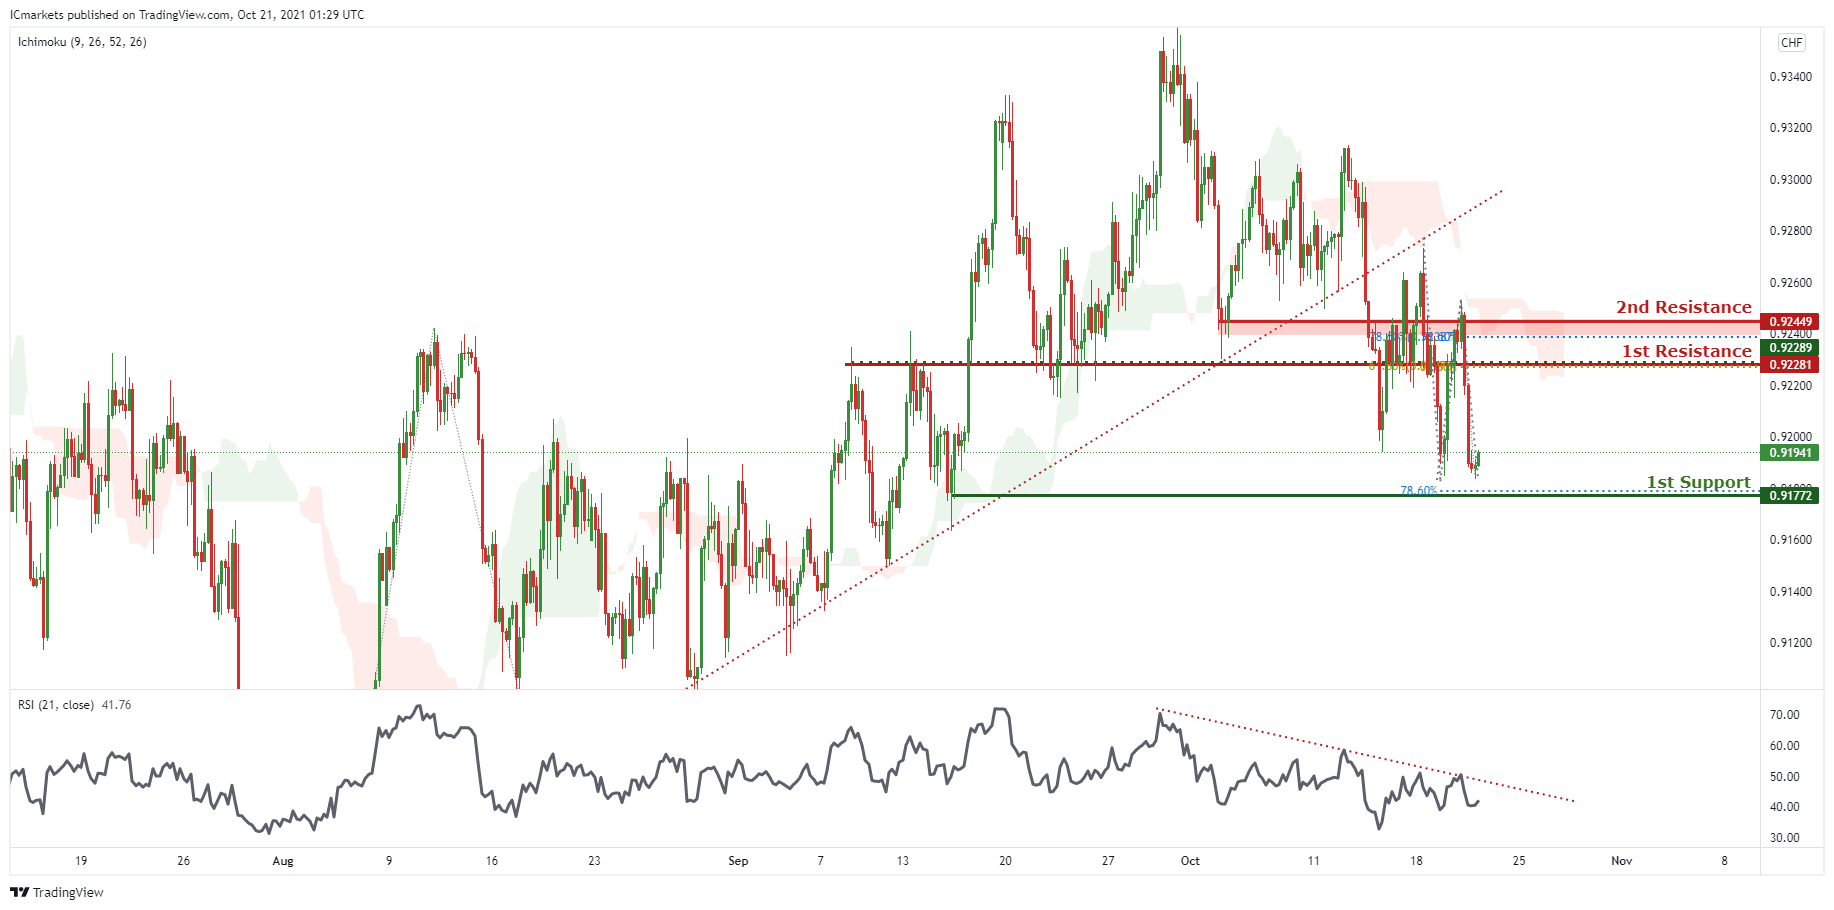
USD/CHF:
On the H4, price is seen to be reacting in a potential triangle. In reference to yesterday’s analysis, price did indeed move down to the 1st Support at 0.92028 and it bounced up. Now, price is reacting in between the 1st resistance and 1st support, should wait for a better entry point at either the 1st support and 1st resistance.
Areas of consideration:
- Watch 1st Support at 0.91531
- Watch 1st Resistance at 0.92281
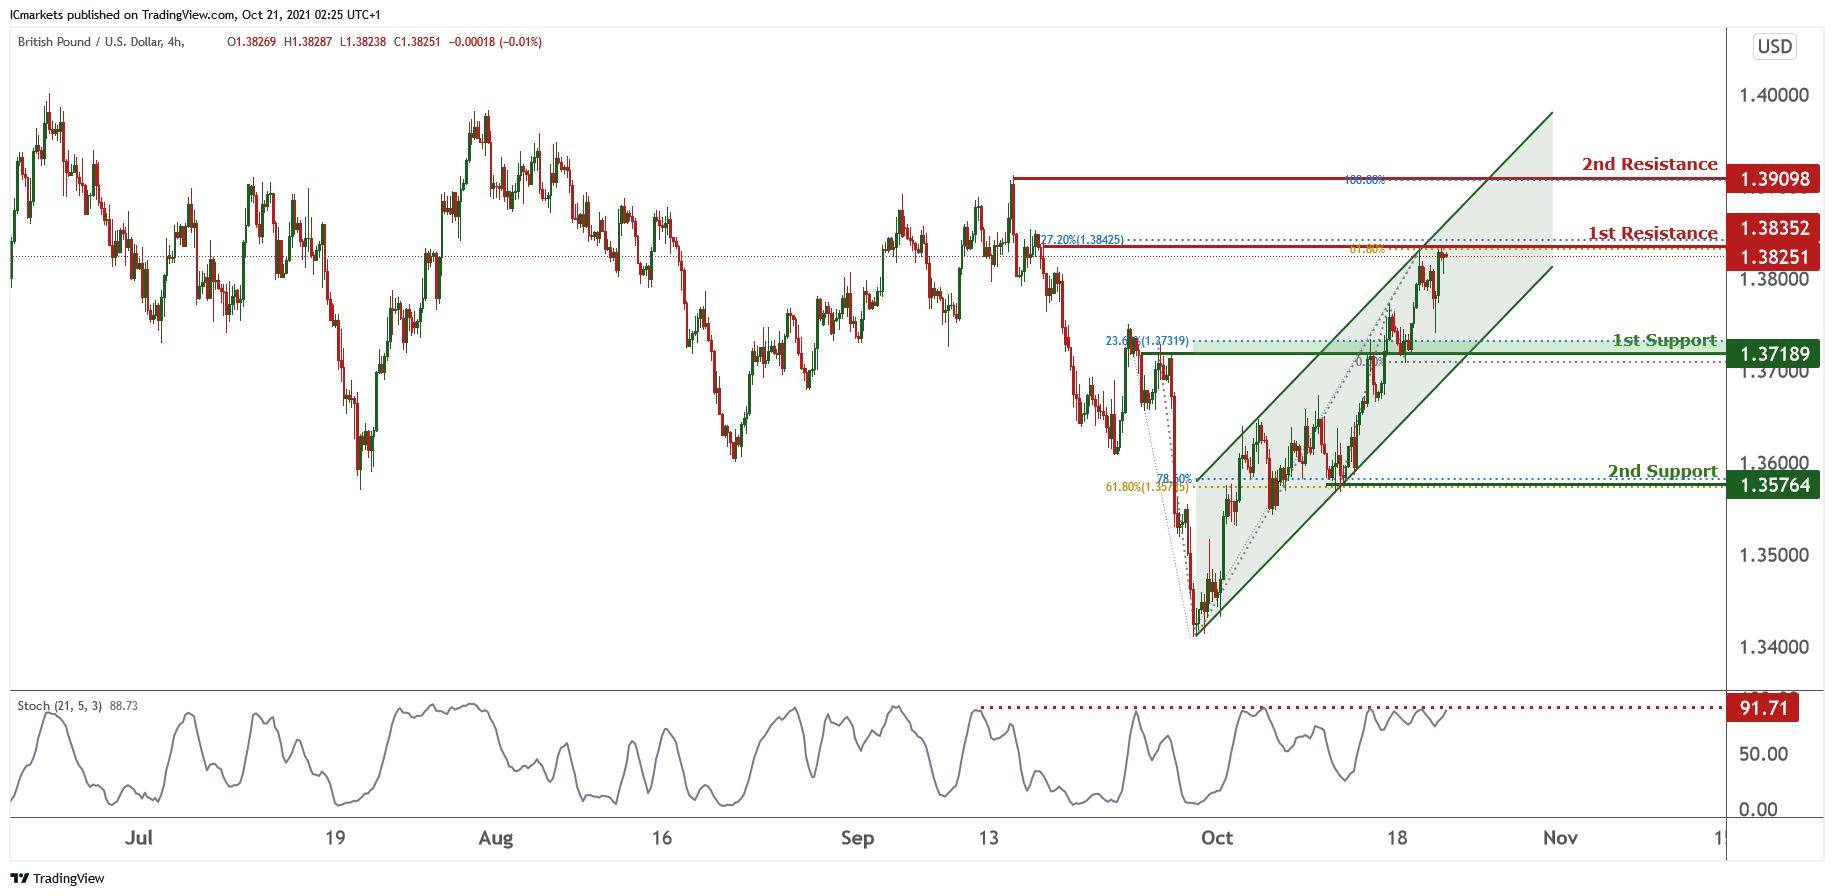
GBP/USD:
On the H4 chart , price is trading in an ascending channel and near our first resistance level of 1.38352 which is also 127% retracement and 61.8% projection level. Price can potentially do a short pull back to first support level of 1.37189 which is also 23.6% Fibonacci retracement. Our temporary bearish bias is further supported by the stochastic indicator which shows that it is at our resistance level.
Key areas of consideration:
H4 first resistance : 1.38352
H4 first support : 1.37189
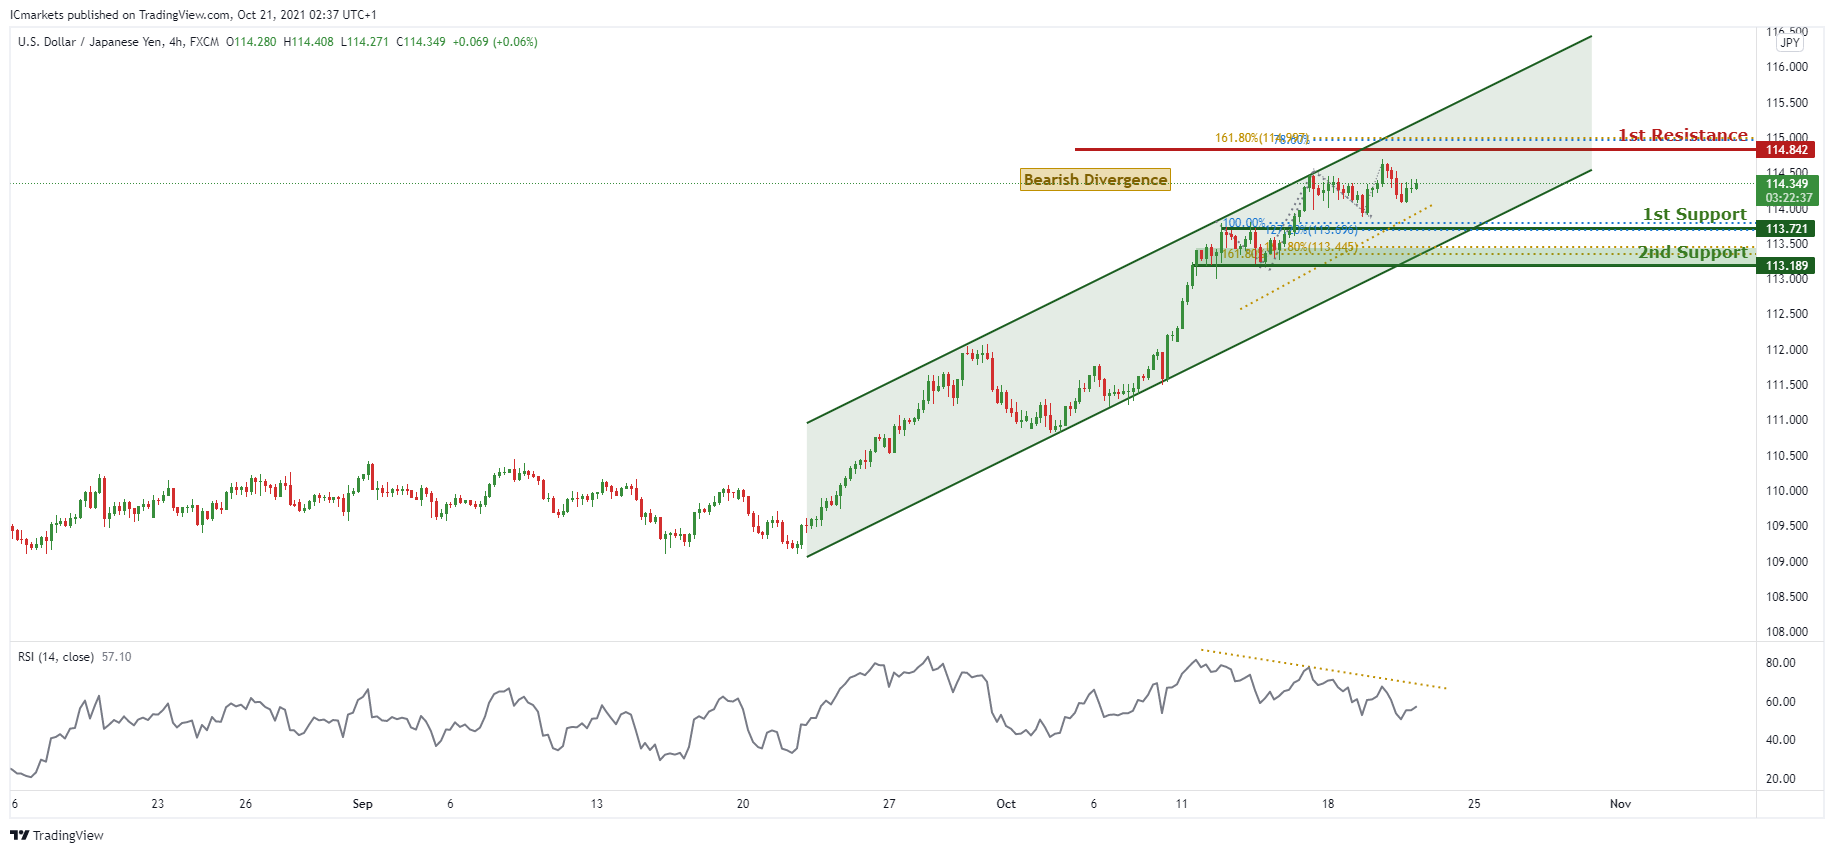
USD/JPY
On the H4 timeframe, price is in the middle of 1st Resistance in line with 78.6% Fibonacci projection and 1st Support in line with 23.6 % Fibonacci retracement and 161.8% Fibonacci projection. Preference: Wait for a better entry level either at the 1st resistance or 1st support, do keep the potential bearish divergence in mind.
Areas of consideration:
- H4 1st resistance level 114.671
- H4 1st support level 113.721
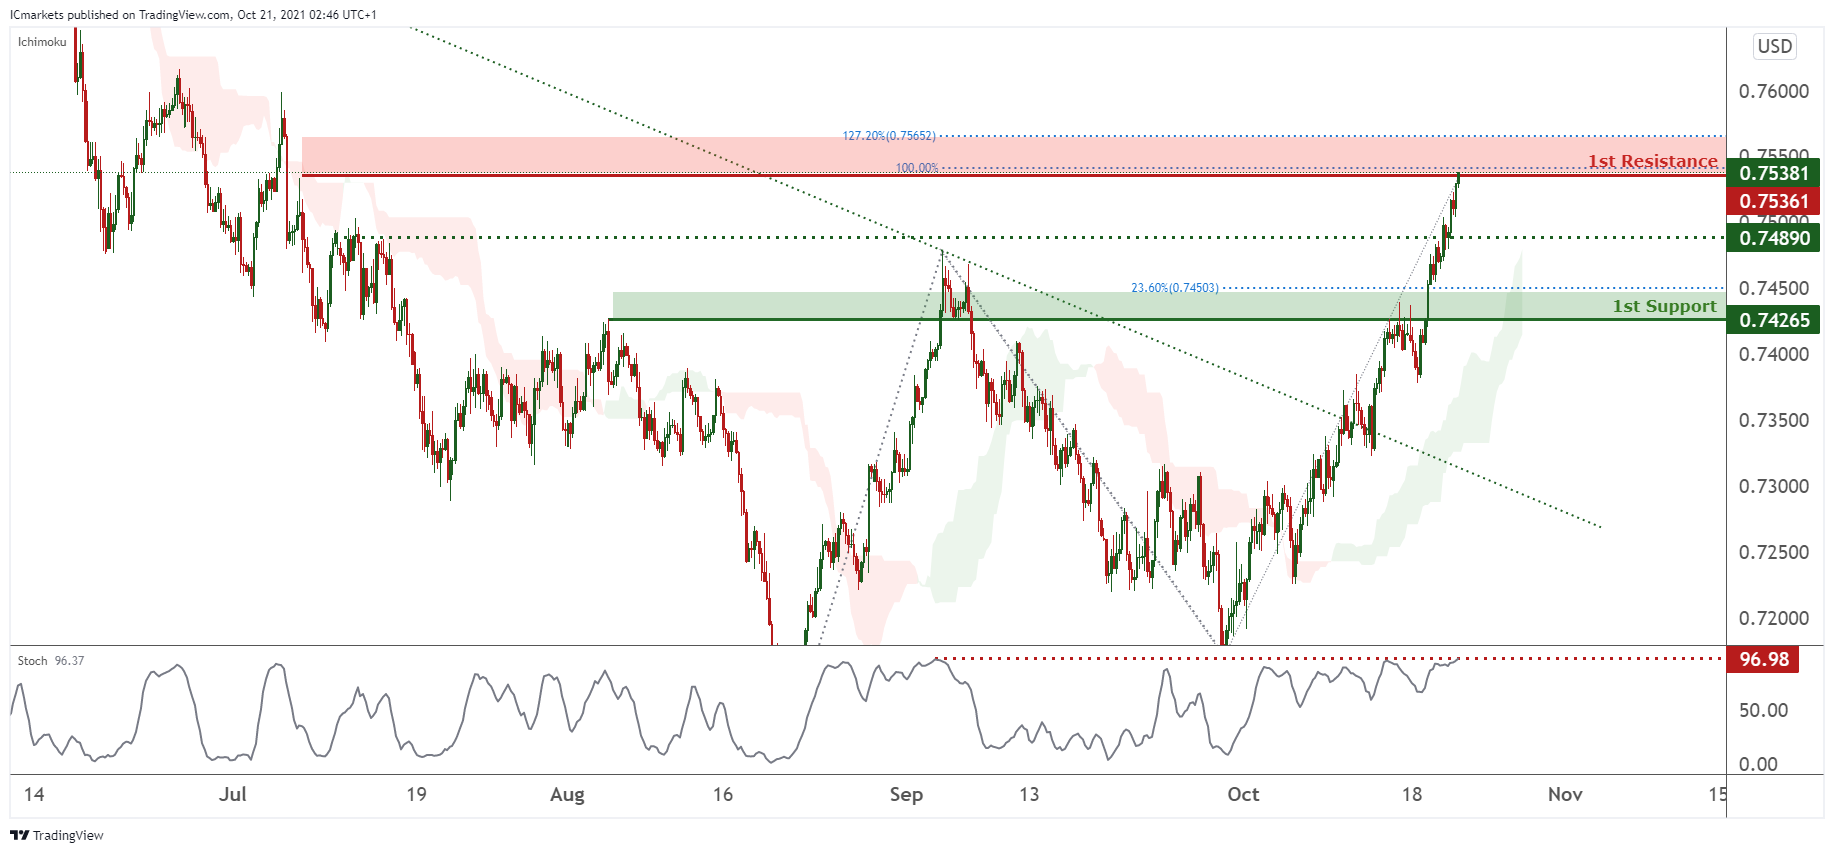
AUD/USD:
On the H4, price is seen to have reached our 1st resistance just as we expected yesterday. We can expect the price to reverse from the 1st Resistance in line with 100% Fibonacci projection, 127.2% Fibonacci retracement and 50% Fibonacci retracement and push back down to 1st Support in line with graphical overlap support. Our short-term bearish bias is further supported by the stochastic indicator where it is at the resistance level.
Areas of consideration:
- H4 1st resistance level 0.75361
- H4 1st support level 0.74895
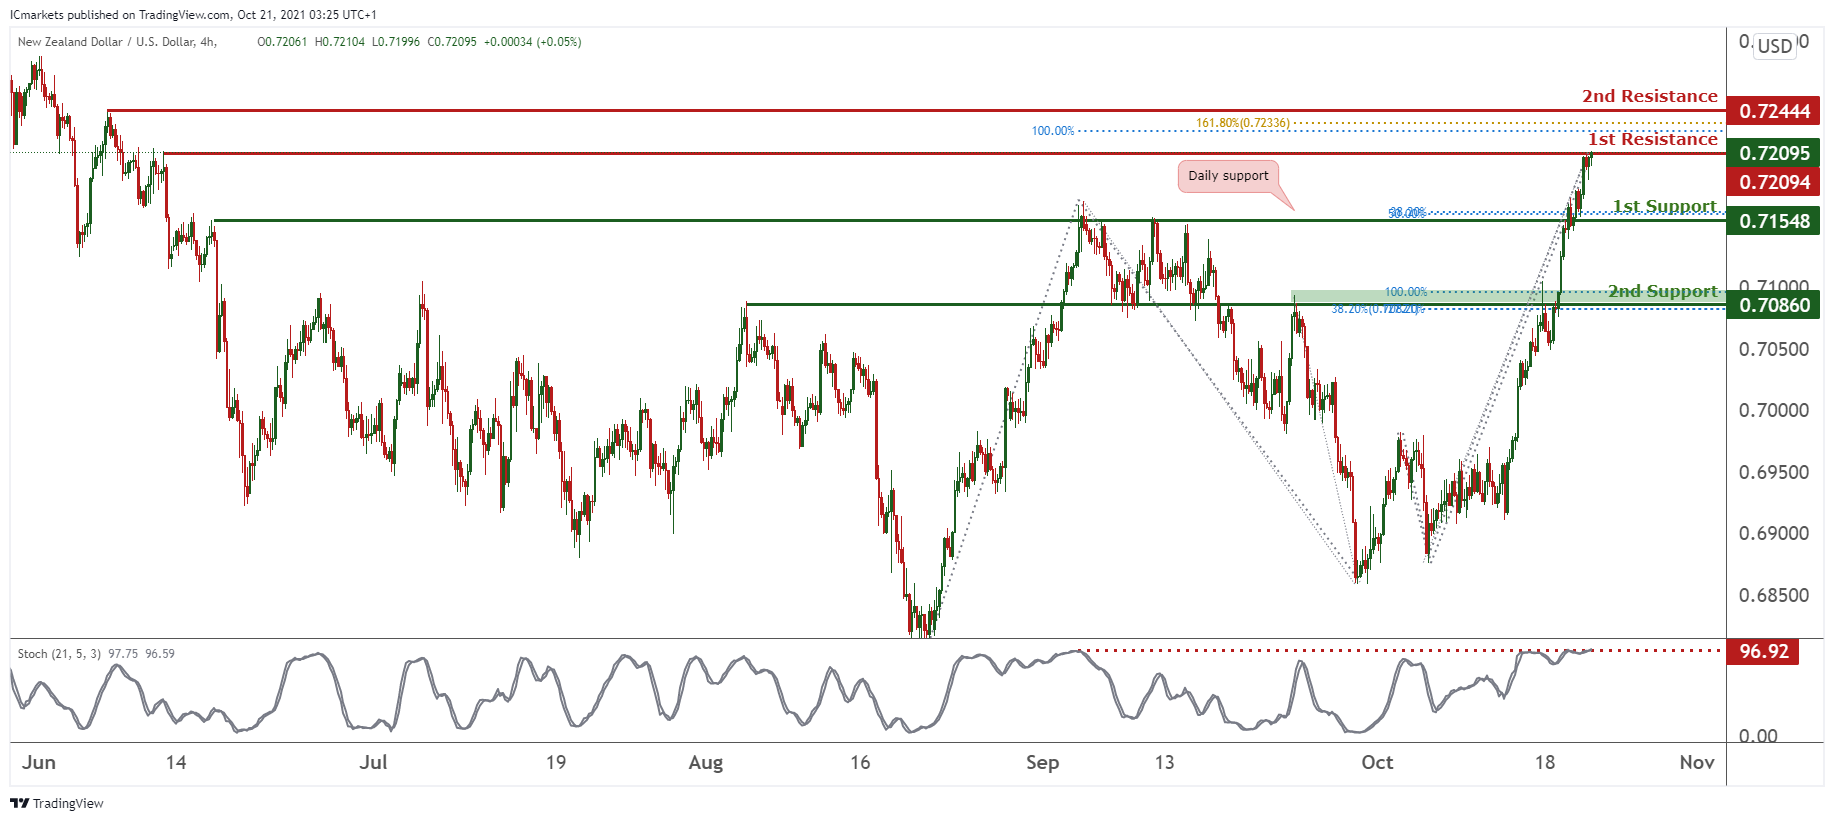
NZD/USD:
On the H4 timeframe, prices are on a bullish momentum. Price could potentially experience a small pullback towards our 1st support at 0.71548 in line with 38.6% and 50% Fibonacci retracement. Stochastics are at a level where pullbacks occurred previously. Alternatively, prices may climb higher towards our 2nd resistance at 0.72444 which is an area of Fibonacci confluences.
Areas of consideration:
- H4 time frame, 1st resistance at 0.72094
- H4 time frame, 1st support at 0.71548
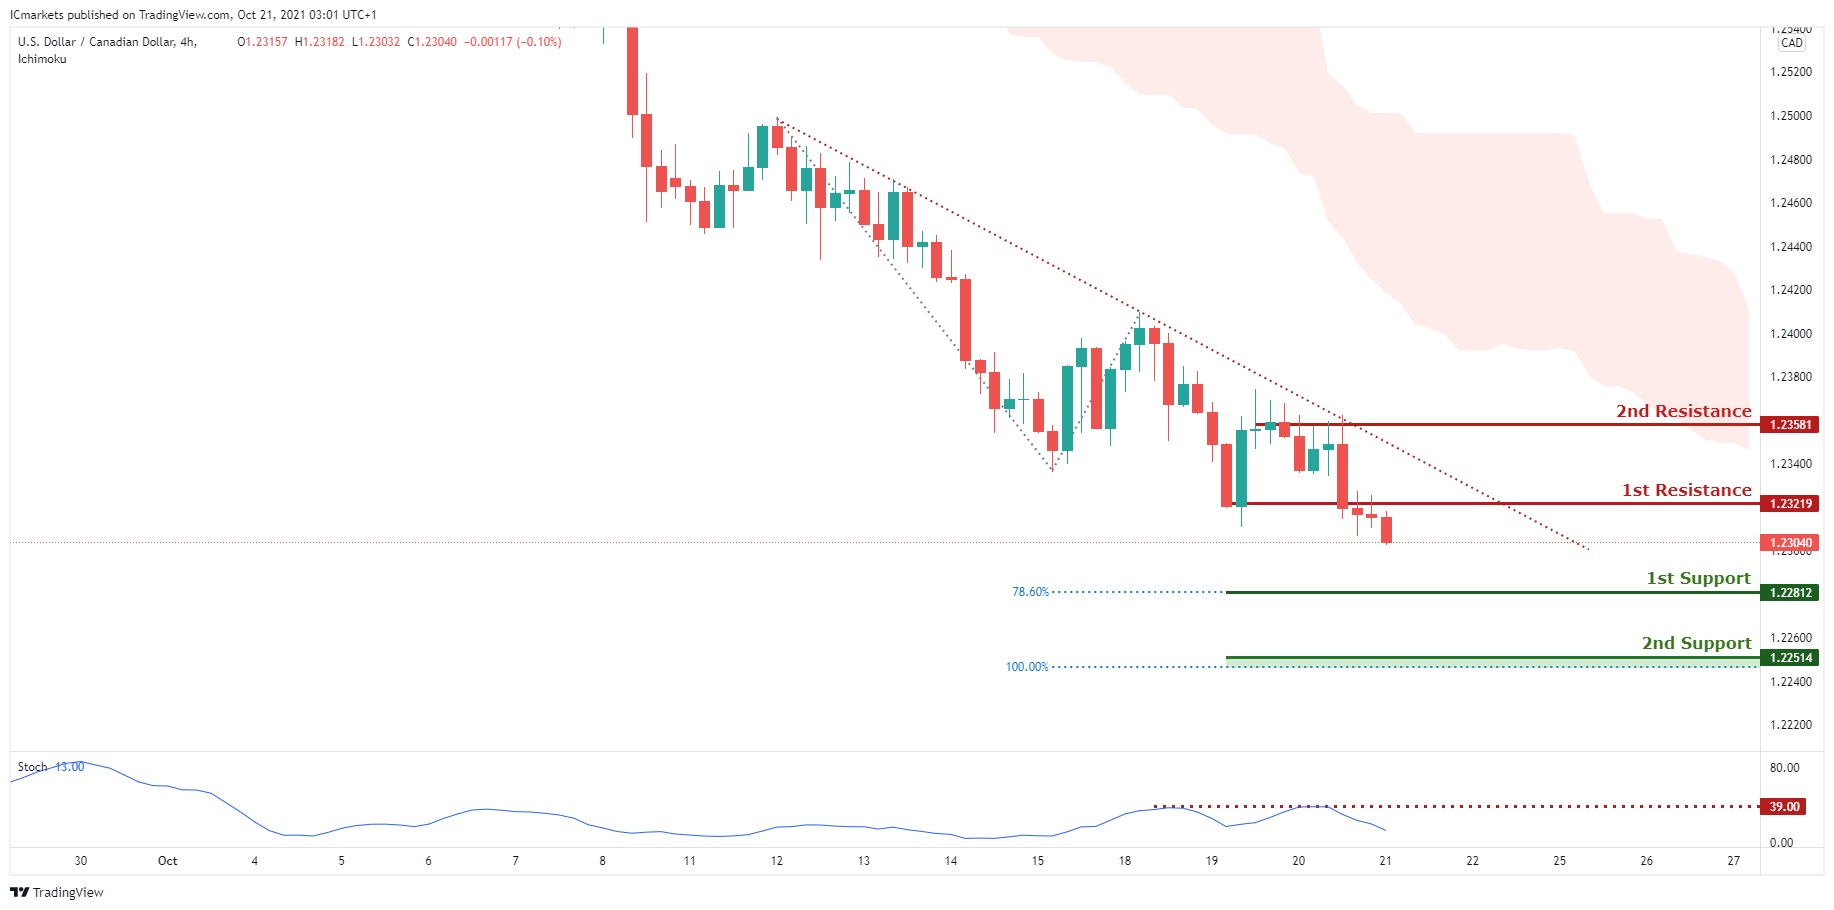
USD/CAD:
On the H4, with the existing bearish sentiment where price is moving below the ichimoku and in a downwards trend within the channel, we may expect to see price head for 1st support at 1.22812 which is a horizontal swing low support in line with the 78.6% Fibonacci extension and possibly even head to 2nd support at 1.22514 in line with the 100% Fibonacci extension level. Our bearish bias is further supported by the fact that price is moving below the moving average. Alternatively, price may retest at 1st resistance at 1.23219 which is a horizontal overlap resistance before continuing with its downwards trend.
Areas of consideration:
- H4 time frame, support at 22812
- H4 time frame, resistance at 23219
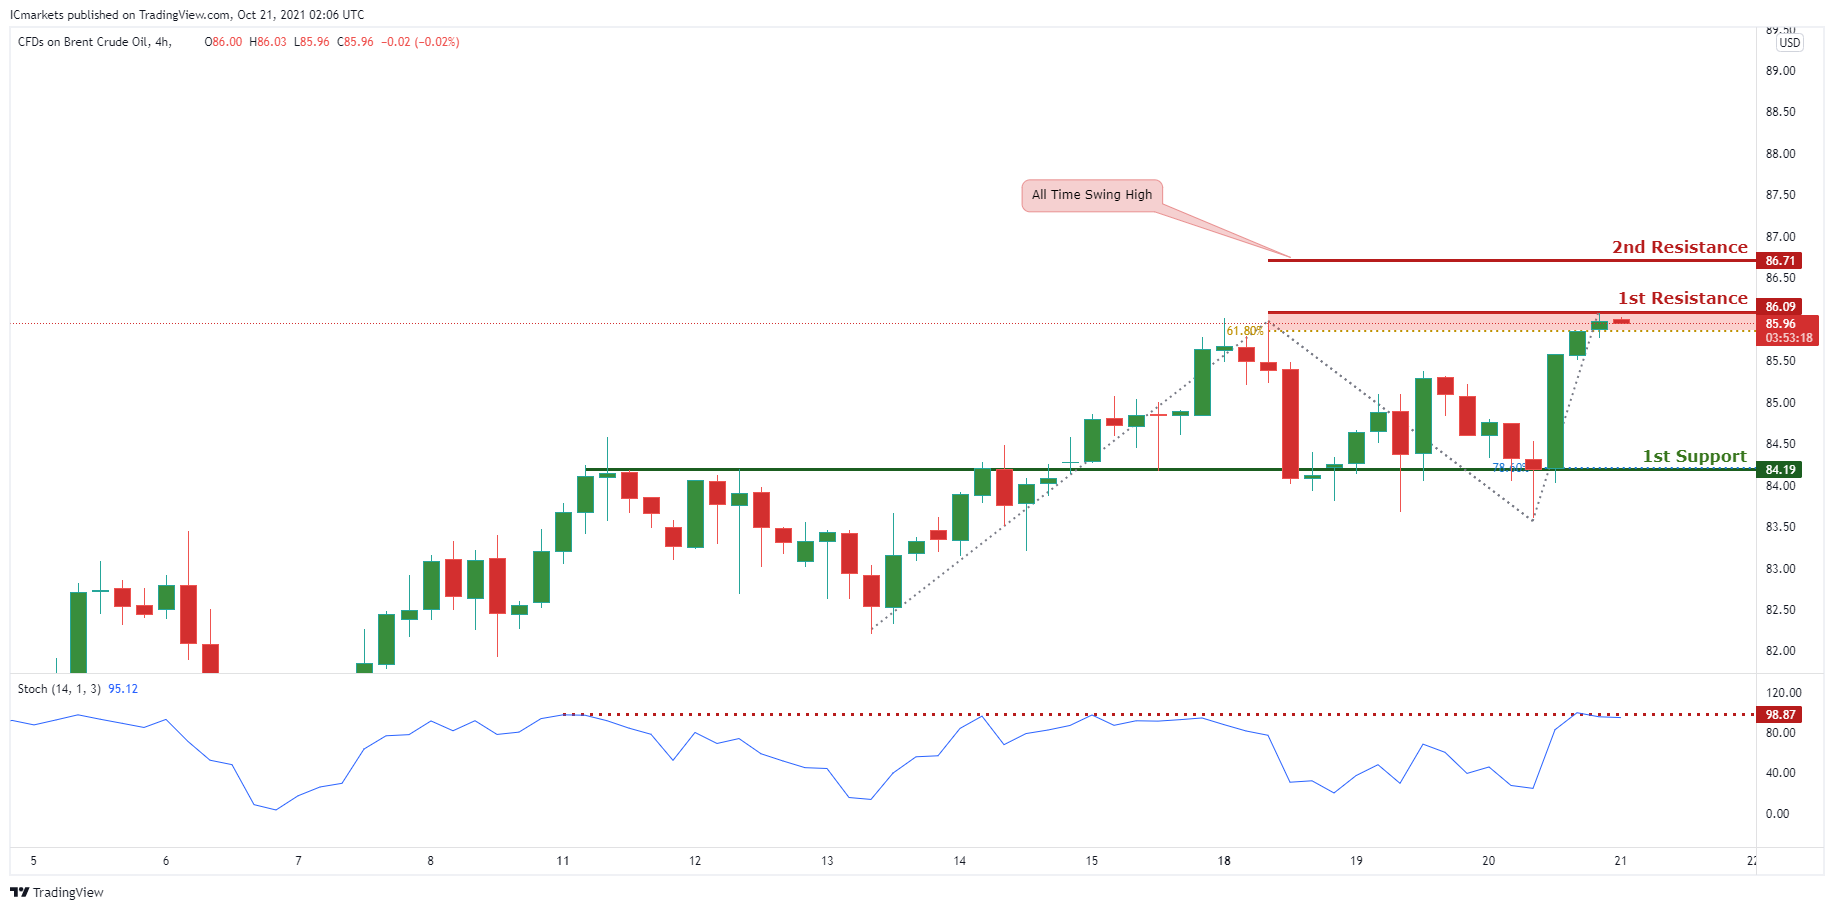
OIL:
On the H4 timeframe, price is testing the 1st resistance at 86.09 in line with the 61.8% Fibonacci extension. With the stochastic showing that price is at its resistance as well, we are biased that price will head down to 1st support at 84.19 in line with the 78.6% Fibonacci extension and also a horizontal overlap support area. Otherwise, price may break 1st resistance support and head for the all time swing high resistance at 86.781.
Areas of consideration:
- H4 time frame, 1st resistance of 09
- H4 time frame, 1st support of 19
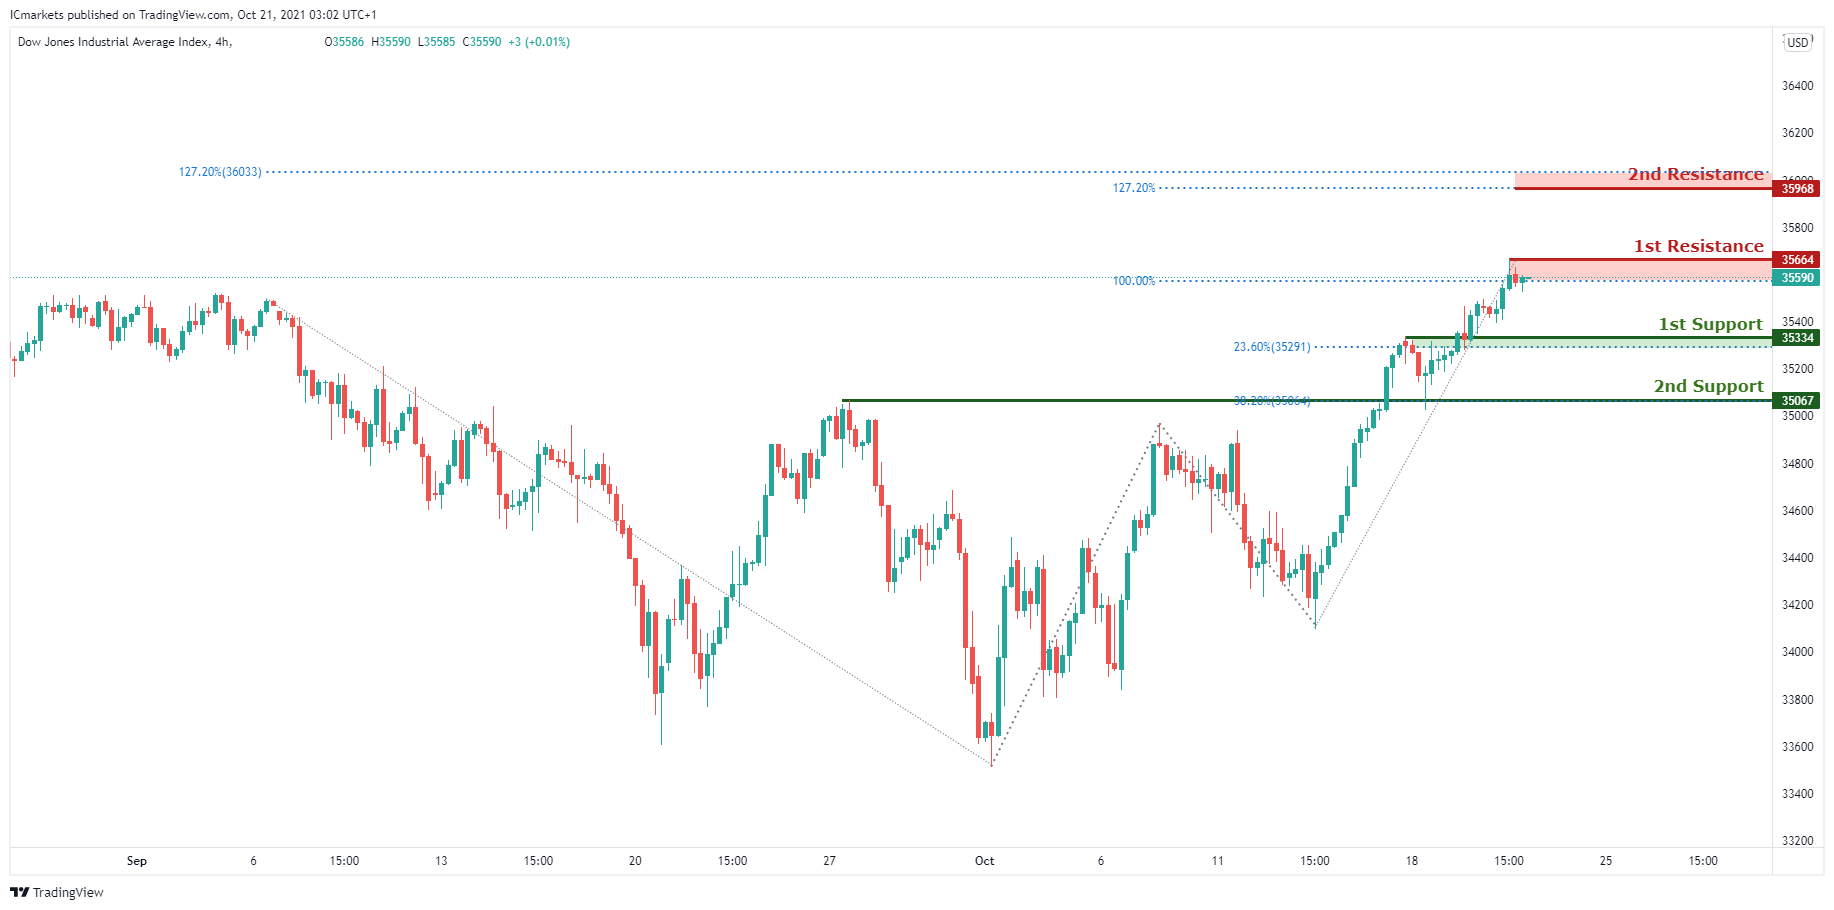
Dow Jones Industrial Average:
On the H4, with price is approaching the 1st resistance at 35664 which is a graphical horizontal swing high resistance in line with 100% Fibonacci projection, we have a bearish bias that price will head down from here to 1st support at 35334 in line with the 23.6% Fibonacci retracement level which is a horizontal overlap support . Price may even head for 2nd support at 35067 in line 38.2% Fibonacci retracement level. Otherwise, if price breaks structure at 1st resistance, we may likely see a new high at 2nd resistance at 35968.
Areas of consideration:
- 4H resistance at 35664
- 4H support at 35334
The accuracy, completeness and timeliness of the information contained on this site cannot be guaranteed. IC Markets does not warranty, guarantee or make any representations, or assume any liability regarding financial results based on the use of the information in the site.
News, views, opinions, recommendations and other information obtained from sources outside of www.icmarkets.com.au, used in this site are believed to be reliable, but we cannot guarantee their accuracy or completeness. All such information is subject to change at any time without notice. IC Markets assumes no responsibility for the content of any linked site.
The fact that such links may exist does not indicate approval or endorsement of any material contained on any linked site. IC Markets is not liable for any harm caused by the transmission, through accessing the services or information on this site, of a computer virus, or other computer code or programming device that might be used to access, delete, damage, disable, disrupt or otherwise impede in any manner, the operation of the site or of any user’s software, hardware, data or property.