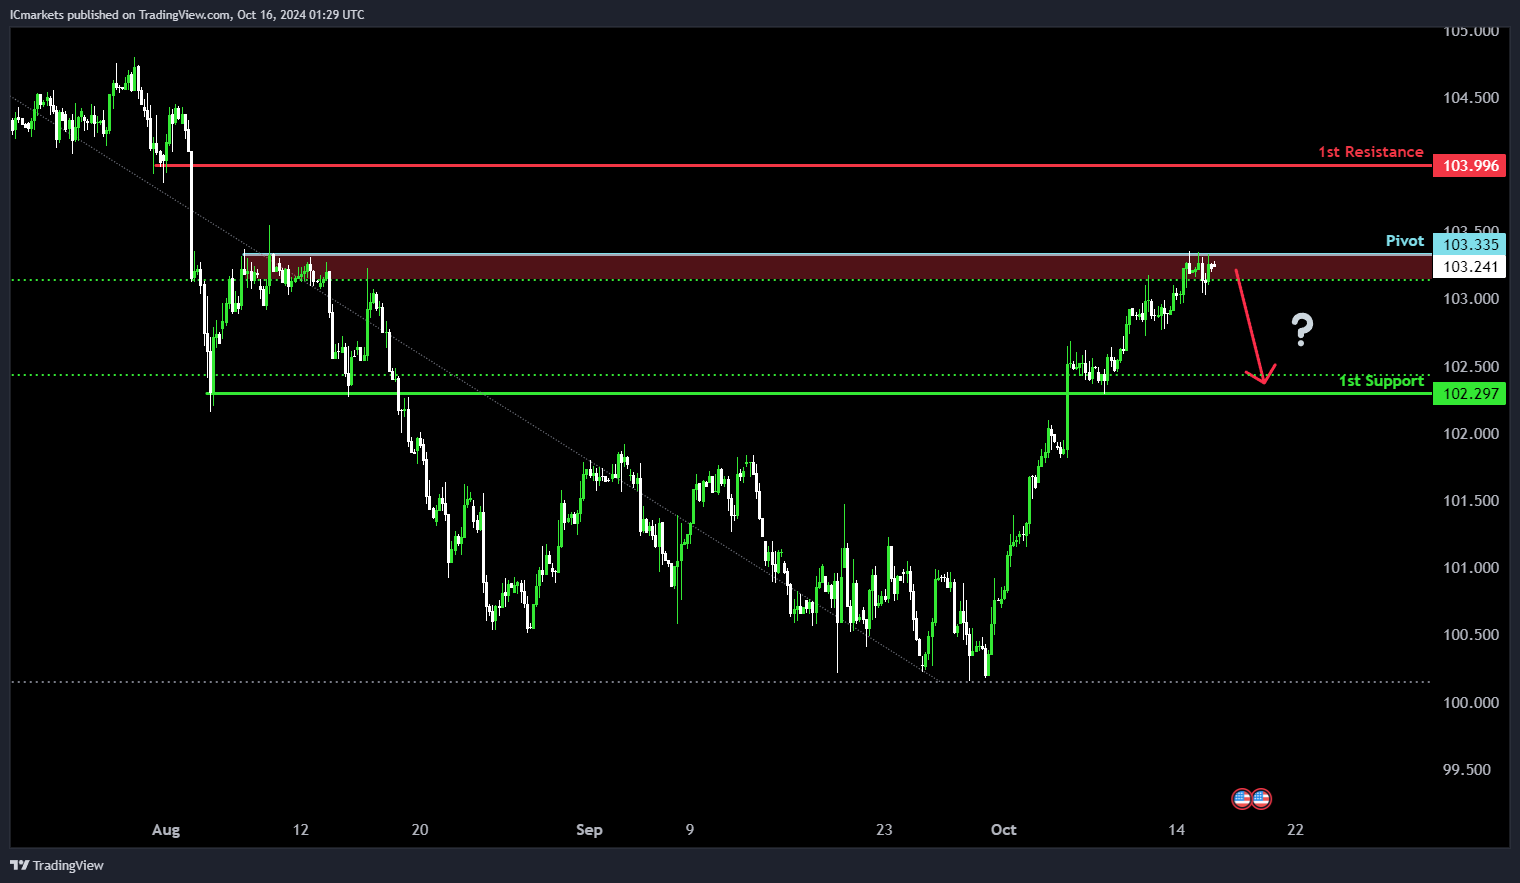
DXY (US Dollar Index):
Potential Direction: Bearish
Overall momentum of the chart: Bullish
Price could potentially make a bearish continuation toward 1st support.
Pivot: 103.33
Supporting reasons: Identified as a pullback resistance with 50% Fibonacci Retracement, indicating this level may act as a significant resistance point.
1st support: 102.29
Supporting reasons: Identified as overlap support near the 38.2% Fibonacci Retracement, suggesting this level could provide strong support if the price declines.
1st resistance: 103.99
Supporting reasons: Identified as pullback resistance, marking a level where the price might encounter selling pressure if it attempts to rise.
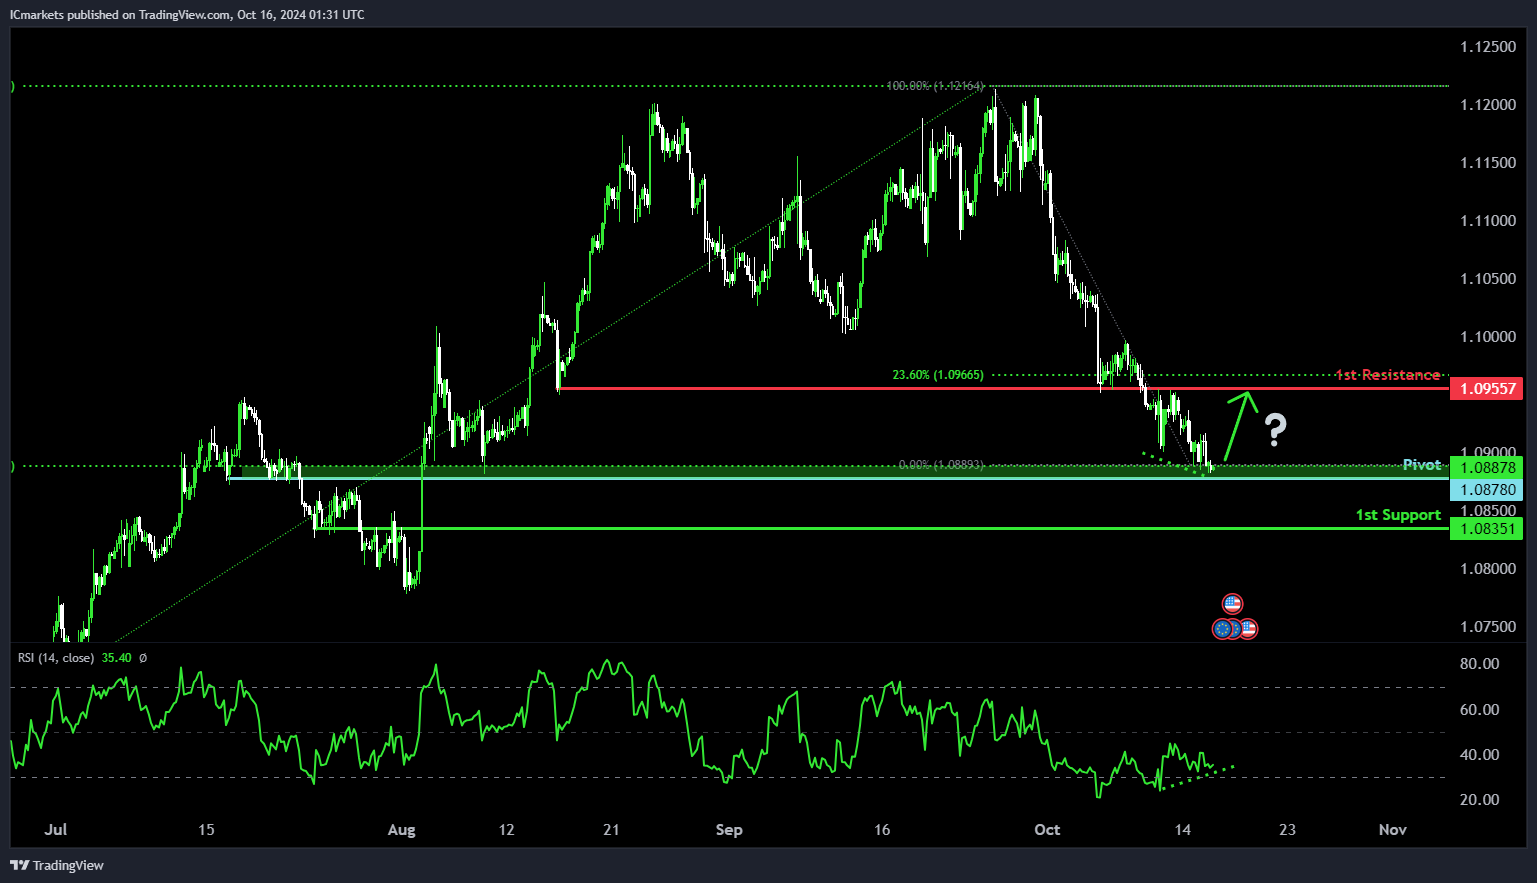
EUR/USD:
Potential Direction: Bullish
Overall momentum of the chart: Bearish
Price could potentially make a bullish bounce off pivot and head towards 1st resistance.
Pivot: 1.0878
Supporting reasons: Identified as an overlap support with 61.80% Fibonacci Retracement, indicating this level may act as a significant support point.
1st support: 1.0351
Supporting reasons: Identified as a pullback support, suggesting this level could provide strong support if the price declines.
1st resistance: 1.0955
Supporting reasons: Identified as an overlap resistance with 23.6% Fibonacci Retracement, marking a level where the price might encounter selling pressure if it attempts to rise.
Additionally, divergence occurs when an asset’s price moves in the opposite direction of a technical indicator. It signals that the current trend may be weakening and could potentially lead to a price reversal.
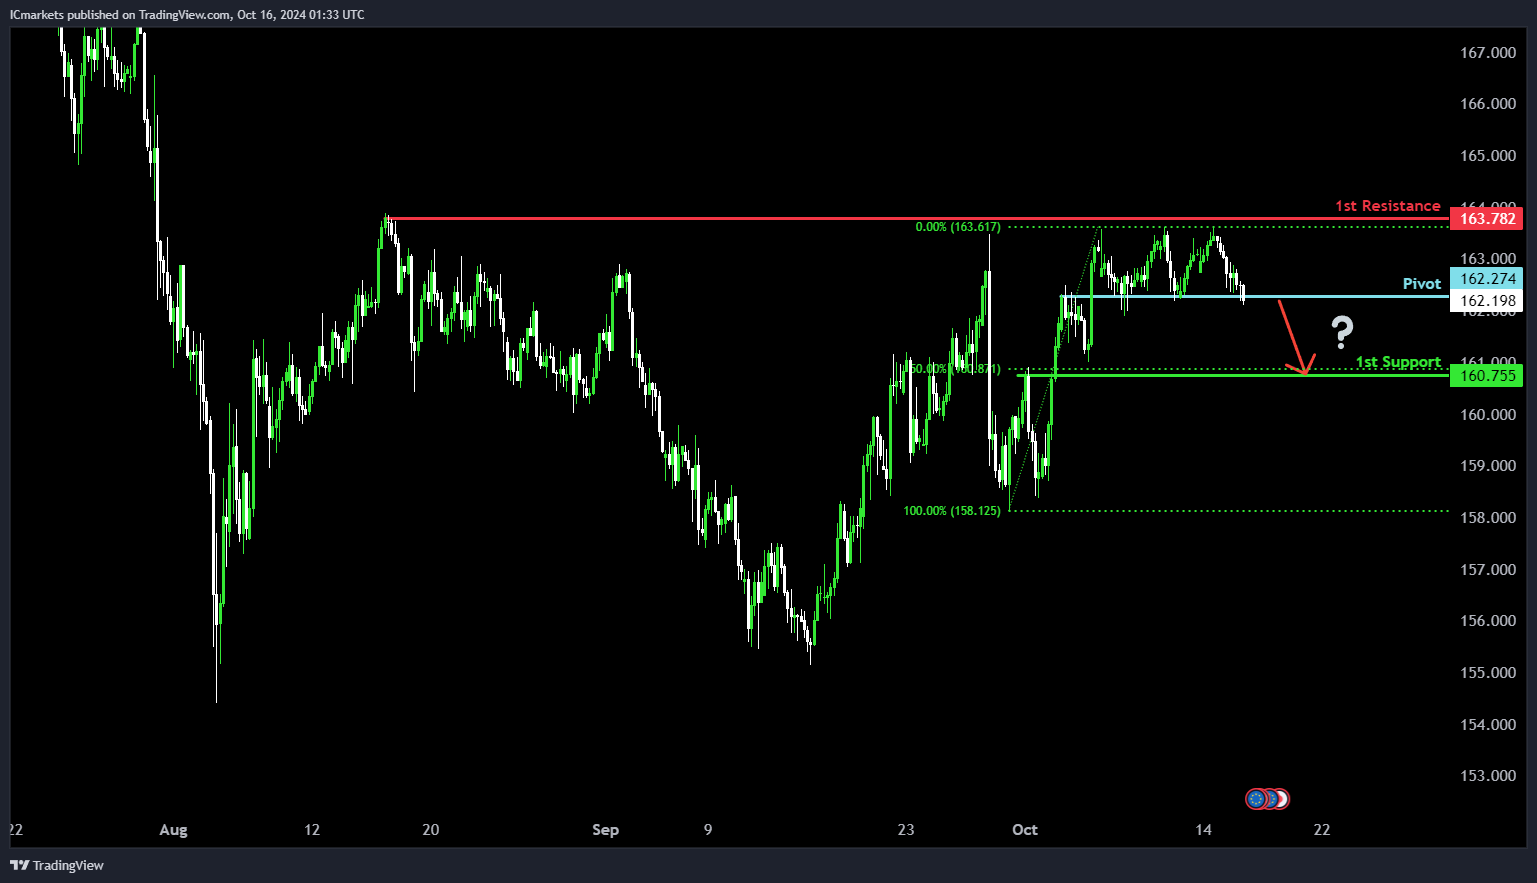
EUR/JPY:
Potential Direction: Bearish
Overall momentum of the chart: Bearish
Price could potentially make a bearish break-off pivot and drop toward 1st support
Pivot: 162.27
Supporting reasons: Identified as pullback resistance, indicating this level may act as resistance during price fluctuations.
1st support: 160.75
Supporting reasons: Identified as pullback support, aligned with the 50% Fibonacci Retracement, suggesting this level could provide strong support if the price declines.
1st resistance: 163.78
Supporting reasons: Identified as multi-swing high resistance, indicating this level may act as a significant resistance point where selling pressure could arise.
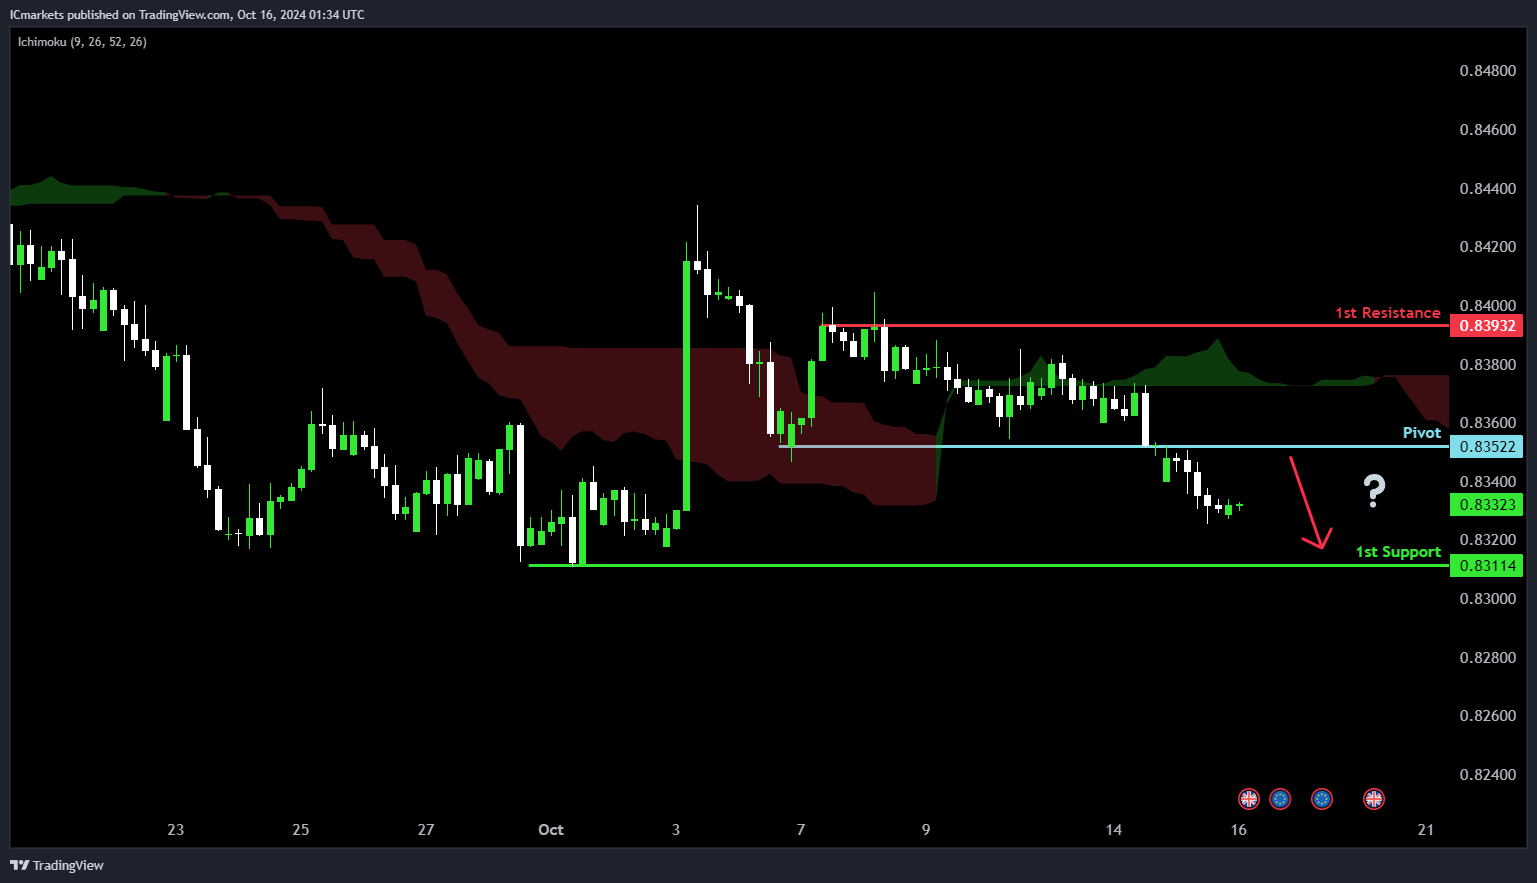
EUR/GBP:
Potential Direction: Bearish
Overall momentum of the chart: Bearish
Price could potentially make a bearish continuation towards 1st resistance.
Pivot: 0.8352
Supporting reasons: Identified as an overlap resistance, indicating this level may provide significant resistance during price fluctuations.
1st support: 0.8311
Supporting reasons: Identified as multi-swing low support, suggesting this level could offer strong support if the price declines.
1st resistance: 0.8993
Supporting reasons: Identified as multi-swing high resistance, marking a level where the price might encounter selling pressure if it attempts to rise.
Additionally, when the price remains below the Ichimoku cloud, it’s typically seen as a strong bearish signal, indicating downward momentum
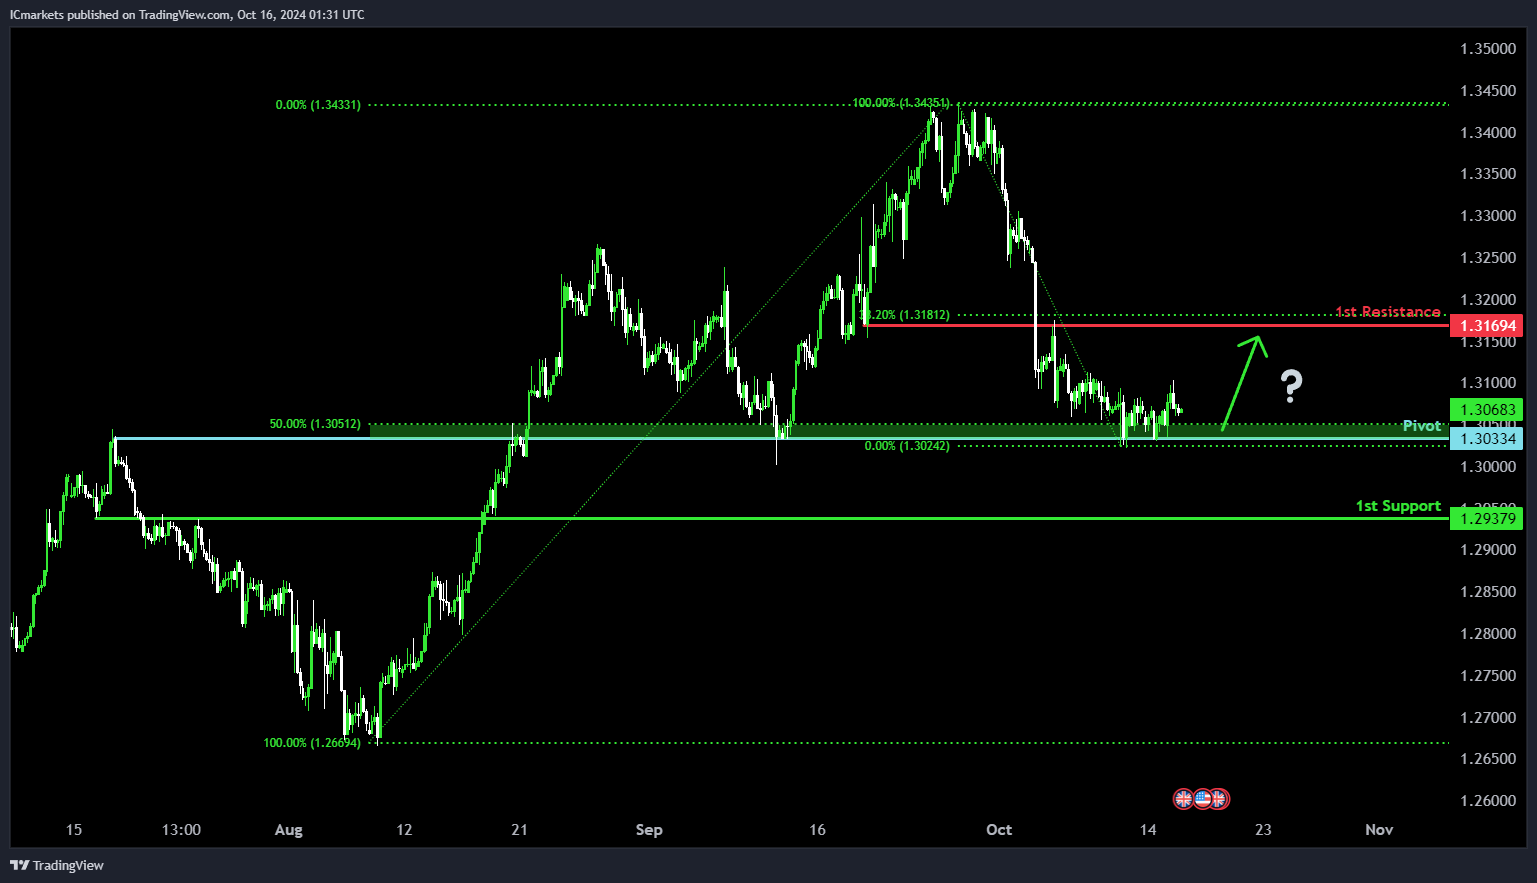
GBP/USD:
Potential Direction: Bullish
Overall momentum of the chart: Bearish
Price could potentially make a bullish continuation toward 1st resistance
Pivot: 1.3033
Supporting reasons: Identified as an overlap support with 50% Fibonacci Retracement, indicating this level may act as a significant support point.
1st support: 1.2937
Supporting reasons: Identified as an overlap support, suggesting this level could provide strong support if the price declines.
1st resistance: 1.3169
Supporting reasons: Identified as a pullback resistance close to 38.2% Fibonacci retracement, marking a level where the price might encounter selling pressure if it attempts to rise.
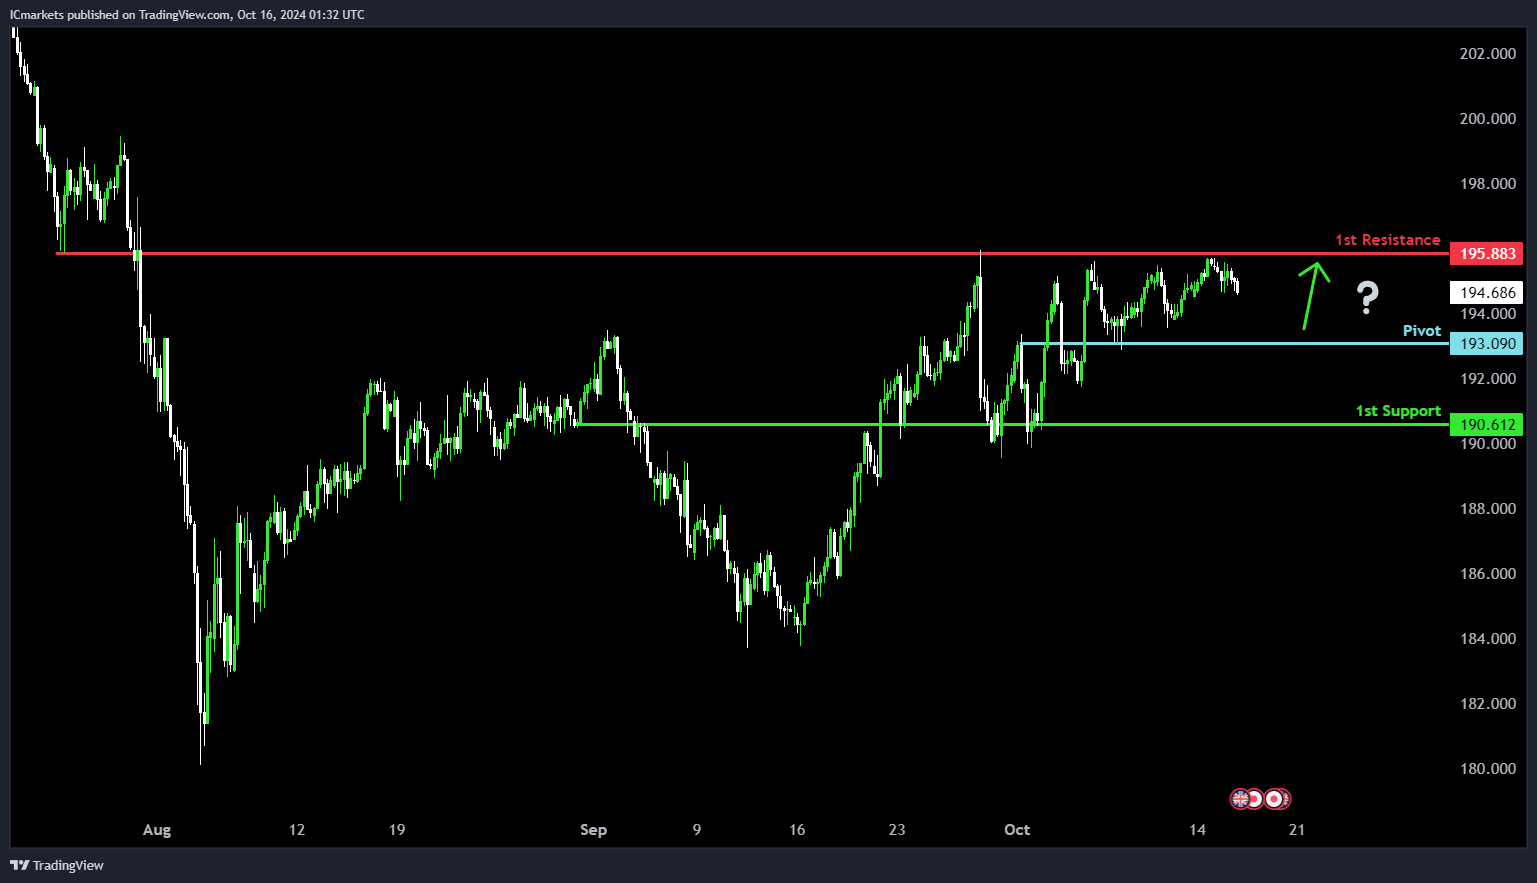
GBP/JPY:
Potential Direction: Bullish
Overall momentum of the chart: Bullish
Price could potentially make a bullish bounce-off pivot and head toward 1st resistance
Pivot: 193.09
Supporting reasons: Identified as an overlap support, indicating a potential area where price may find support.
1st support: 190.61
Supporting reasons: Another overlap support, suggesting this level could offer additional support if the price declines further.
1st resistance: 195.88
Supporting reasons: Identified as an overlap resistance, marking a significant level where price may encounter selling pressure.
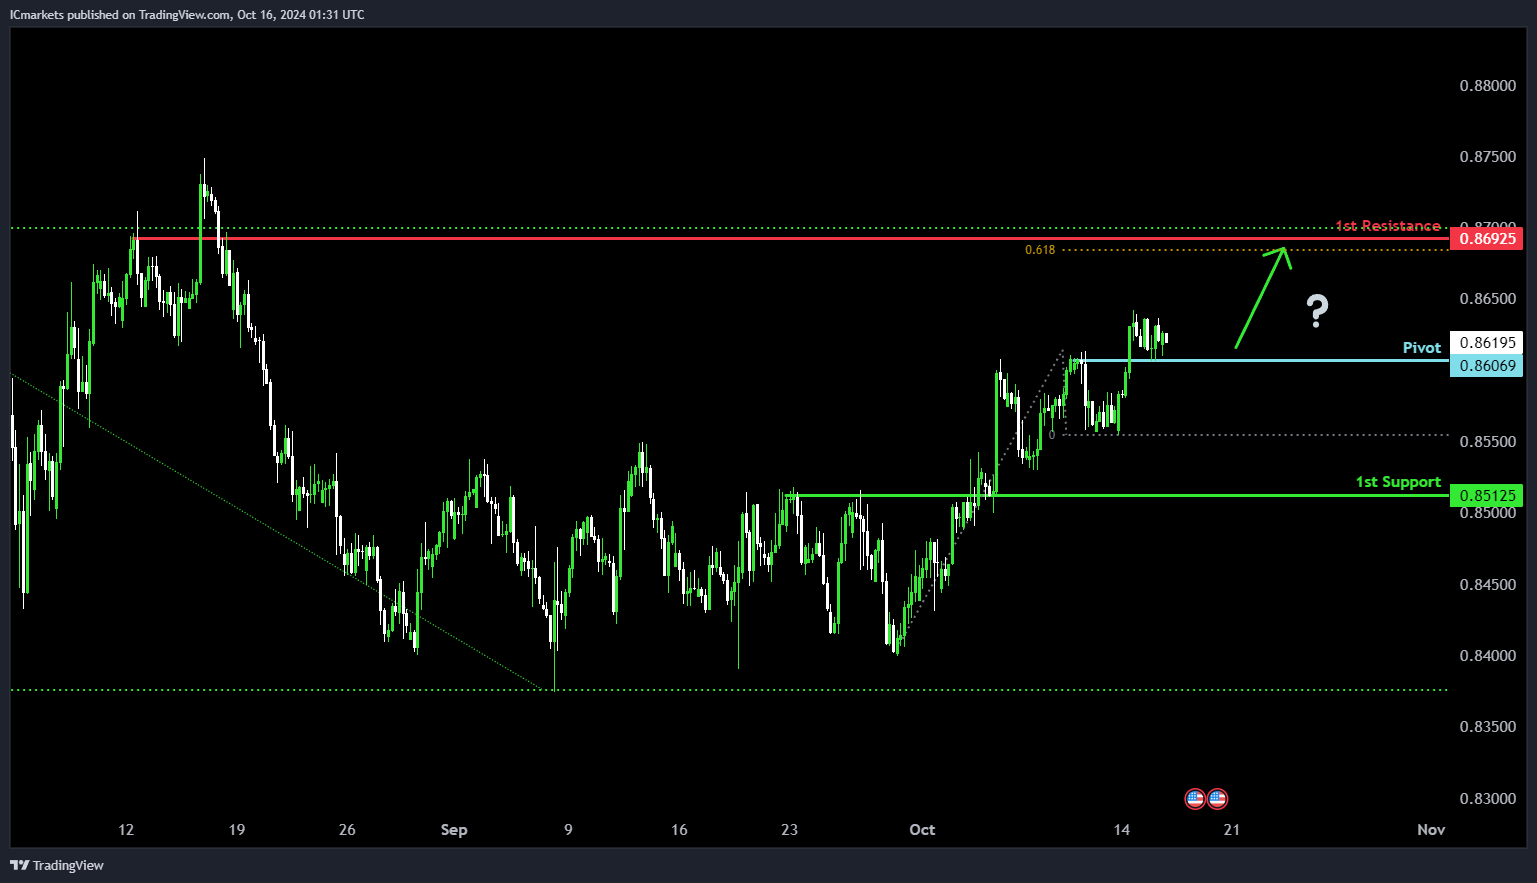
USD/CHF:
Potential Direction: Bullish
Overall momentum of the chart: Bullish
Price could potentially make a bullish continuation towards 1st resistance.
Pivot: 0.8606
Supporting reasons: Identified as an overlap support, indicating this level may provide significant support during price fluctuations.
1st support: 0.8512
Supporting reasons: Identified as a pullback support, suggesting this level could offer strong support if the price declines.
1st resistance: 0.8692
Supporting reasons: Identified as an overlap resistance, aligned with 61.8% Fibonacci projection indicating a potential resistance level where selling pressure may arise.
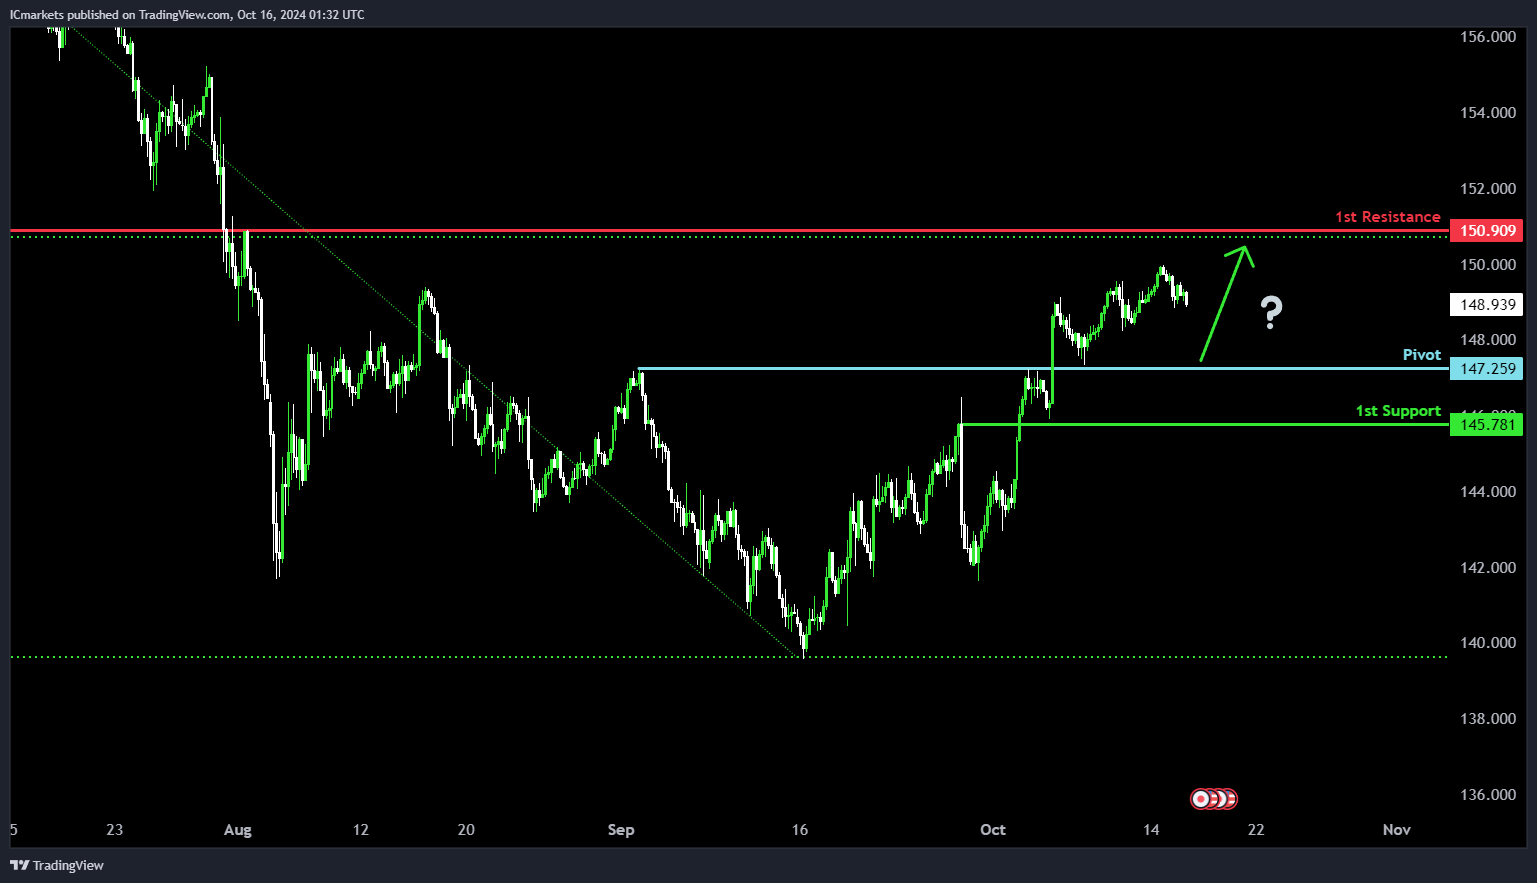
USD/JPY:
Potential Direction: Bullish
Overall momentum of the chart: Bullish
Price could potentially make a bullish bounce off pivot and head towards 1st resistance.
Pivot: 147.25
Supporting reasons: Identified as an overlap support, indicating this level may act as a significant support during retracements.
1st support: 145.78
Supporting reasons: Identified as a pullback support, suggesting this level could provide additional support if the price moves lower.
1st resistance: 150.90
Supporting reasons: Identified as a pullback resistance, aligned with 50% Fibonacci Retracement, indicating a potential area where selling pressure may emerge.
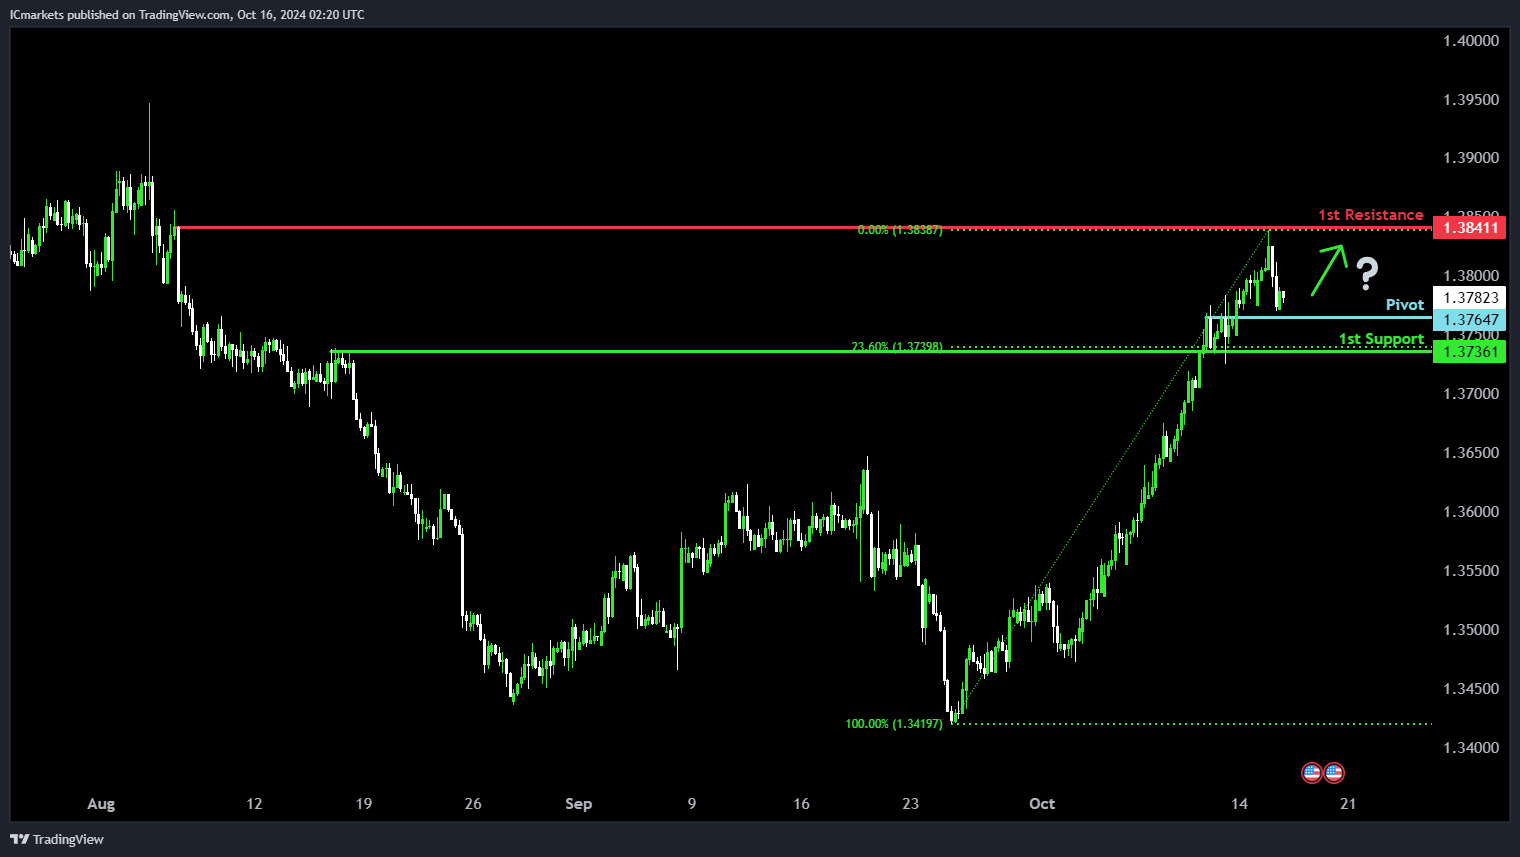
USD/CAD:
Potential Direction: Bullish
Overall momentum of the chart: Bullish
Price is falling towards the pivot and could potentially make a bullish bounce off this level to rise towards the 1st resistance.
Pivot: 1.3764
Supporting reasons: Identified as a pullback support, indicating a potential level where buying interests could pick up to resume the uptrend.
1st support: 1.3736
Supporting reasons: Identified as an overlap support that aligns with a 23.6% Fibonacci retracement, indicating a key level where price could find support once more.
1st resistance: 1.3841
Supporting reasons: Identified as a swing-high resistance, indicating a potential area that could halt any further upward movement.
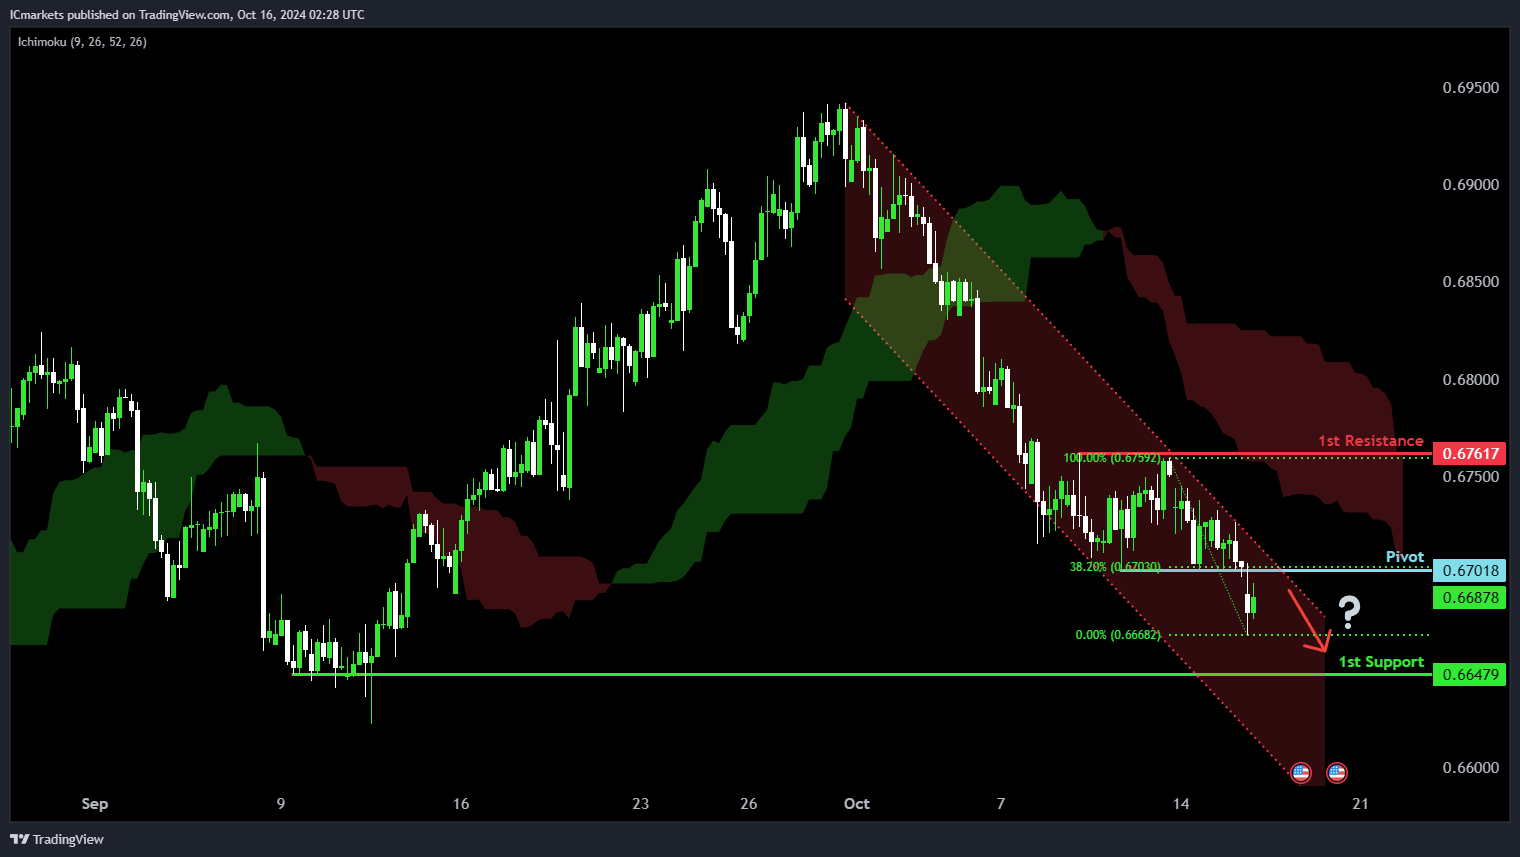
AUD/USD:
Potential Direction: Bearish
Overall momentum of the chart: Bearish
Price is rising towards the pivot and could potentially make a bearish reversal off this level to fall towards the 1st support.
Pivot: 0.6701
Supporting reasons: Identified as a pullback resistance that aligns with a 38.2% Fibonacci retracement, indicating a potential level where selling pressures could intensify.
1st support: 0.6647
Supporting reasons: Identified as a swing-low support, indicating a potential level where price could find support once more.
1st resistance: 0.6761
Supporting reasons: Identified as a swing-high resistance, indicating a potential area that could halt any further upward movement.
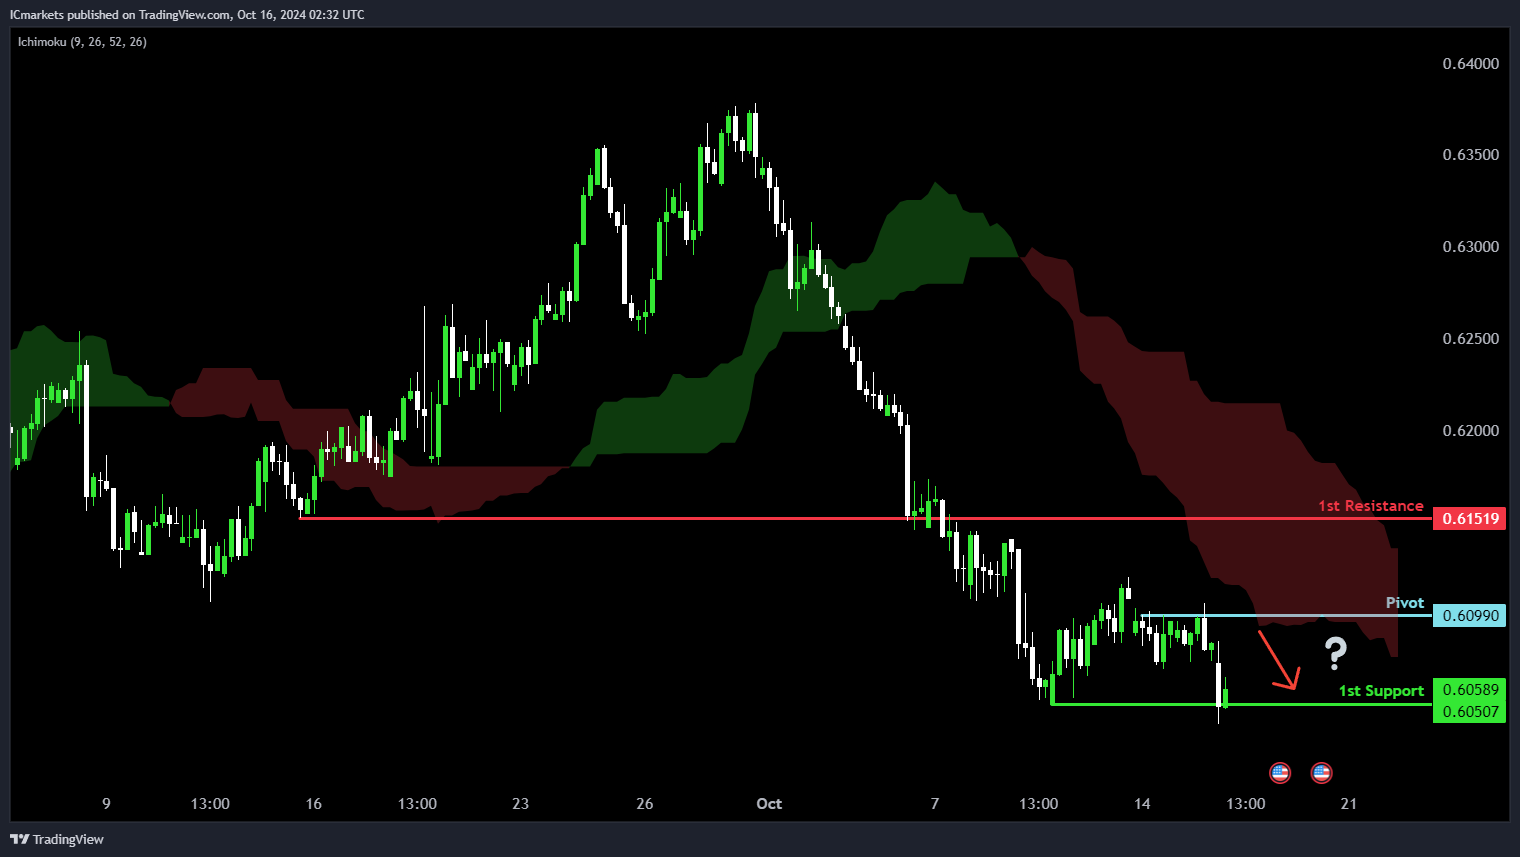
NZD/USD
Potential Direction: Bearish
Overall momentum of the chart: Neutral
Price is rising towards the pivot and could potentially make a bearish reversal off this level to fall towards the 1st support.
Pivot: 0.6099
Supporting reasons: Identified as a pullback resistance, indicating a potential level where selling pressures could intensify.
1st support: 0.6050
Supporting reasons: Identified as a swing-low support, indicating a potential level where price could find support once more.
1st resistance: 0.6151
Supporting reasons: Identified as an overlap resistance, indicating a potential area that could halt any further upward movement.
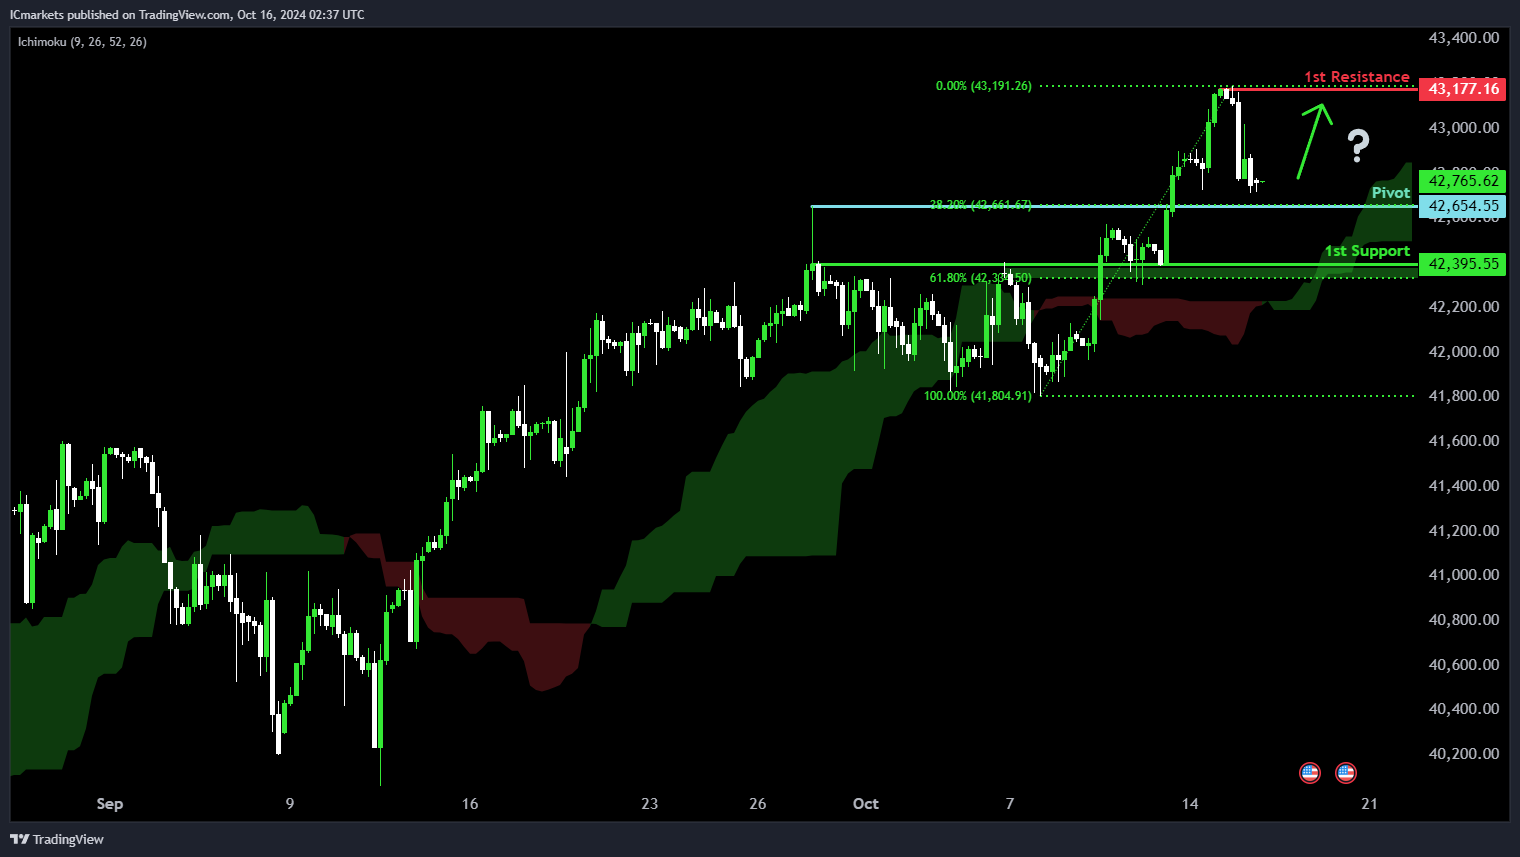
US30 (DJIA):
Potential Direction: Bullish
Overall momentum of the chart: Neutral
Price is falling towards the pivot and could potentially make a bullish bounce off this level to rise towards the 1st resistance.
Pivot: 42,654.55
Supporting reasons: Identified as a pullback support that aligns with a 38.2% Fibonacci retracement, indicating a potential level where buying interests could pick up to stage a rebound.
1st support: 42,395.55
Supporting reasons: Identified as an overlap support that aligns close to a 61.8% Fibonacci retracement, indicating a potential level where price could find support once more.
1st resistance: 43,177.16
Supporting reasons: Identified as a swing-high resistance that aligns close to the all-time high, indicating a potential area that could halt any further upward movement.
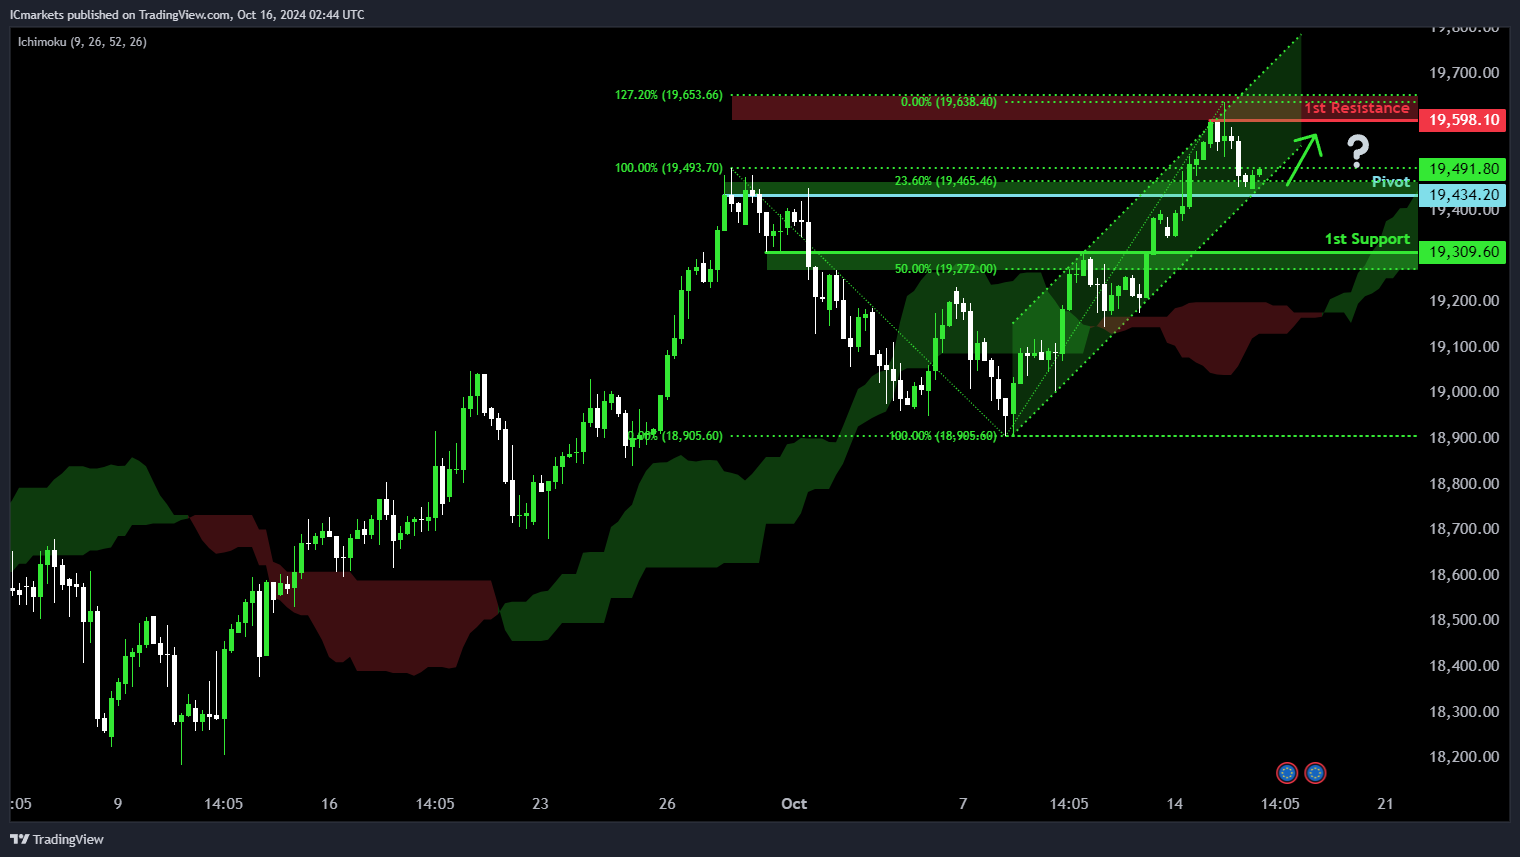
DE40 (DAX):
Potential Direction: Bullish
Overall momentum of the chart: Bullish
Price has made a bullish reversal close to the pivot and could potentially rise towards the 1st resistance.
Pivot: 19,434.20
Supporting reasons: Identified as a pullback support that aligns close to a 23.6% Fibonacci retracement, indicating a potential level where buying interests could pick up to resume the uptrend.
1st support: 19,309.60
Supporting reasons: Identified as an overlap support that aligns close to a 50% Fibonacci retracement, indicating a key level where price could find support.
1st resistance: 19,598.10
Supporting reasons: Identified as a swing-high resistance that aligns close to a 127.2% Fibonacci extension, indicating a potential area that could halt any further upward movement.
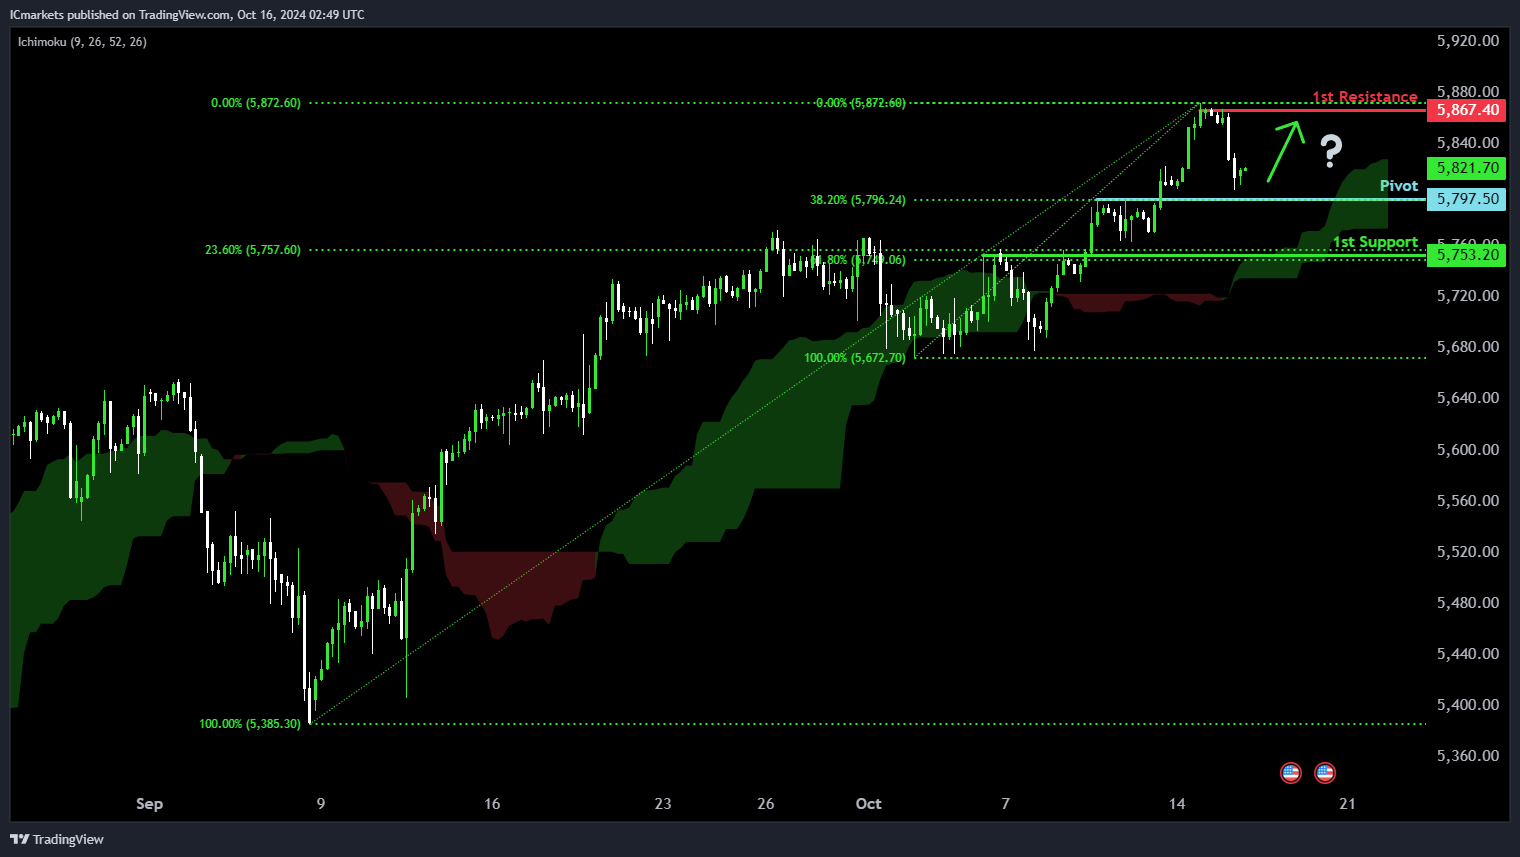
US500 (S&P 500):
Potential Direction: Bullish
Overall momentum of the chart: Neutral
Price has made a bullish reversal close to the pivot and could potentially rise towards the 1st resistance.
Pivot: 5,797.50
Supporting reasons: Identified as a pullback support that aligns with a 38.2% Fibonacci retracement, indicating a potential level where buying interests could pick up to resume the uptrend.
1st support: 5,753.20
Supporting reasons: Identified as a pullback support that aligns with a confluence of Fibonacci levels i.e. the 23.6% and 61.8% retracements, indicating a potential level where price could find support.
1st resistance: 5,867.40
Supporting reasons: Identified as a swing-high resistance that aligns close to the all-time high, indicating a potential area that could halt any further upward movement.
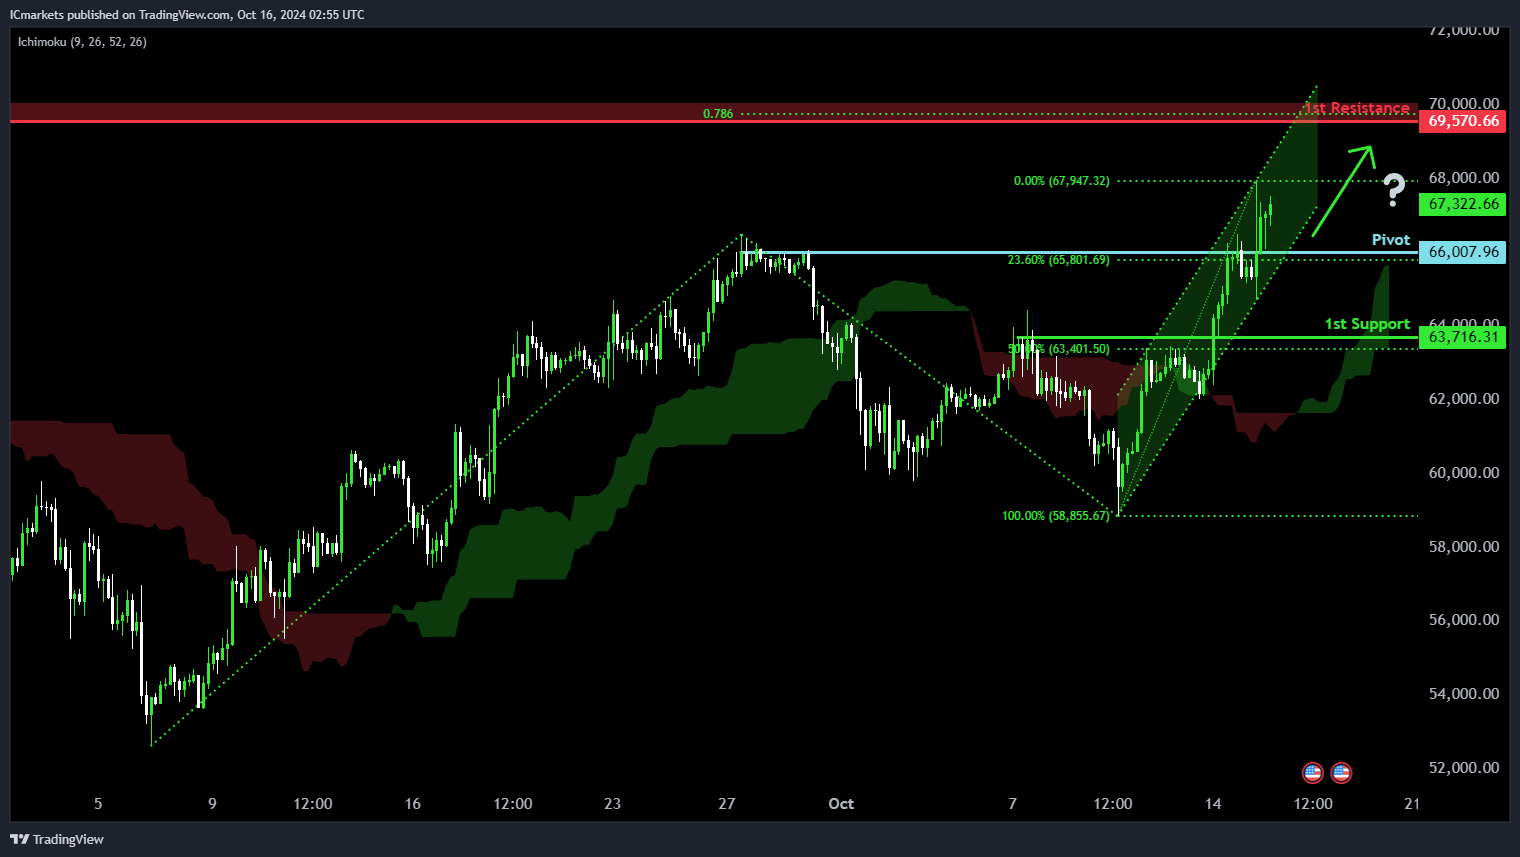
BTC/USD (Bitcoin):
Potential Direction: Bullish
Overall momentum of the chart: Bullish
Price has made a bullish break above the pivot and could potentially rise towards the 1st resistance.
Pivot: 66,007.96
Supporting reasons: Previously identified as a swing-high resistance which now has been broken due to the strong bullish momentum.
1st support: 63,716.31
Supporting reasons: Identified as a pullback support that aligns close to a 50% Fibonacci retracement, indicating a potential level where price could find support.
1st resistance: 69,570.66
Supporting reasons: Identified as a swing-high resistance that aligns close to a 78.6% Fibonacci projection, indicating a potential area that could halt any further upward movement.
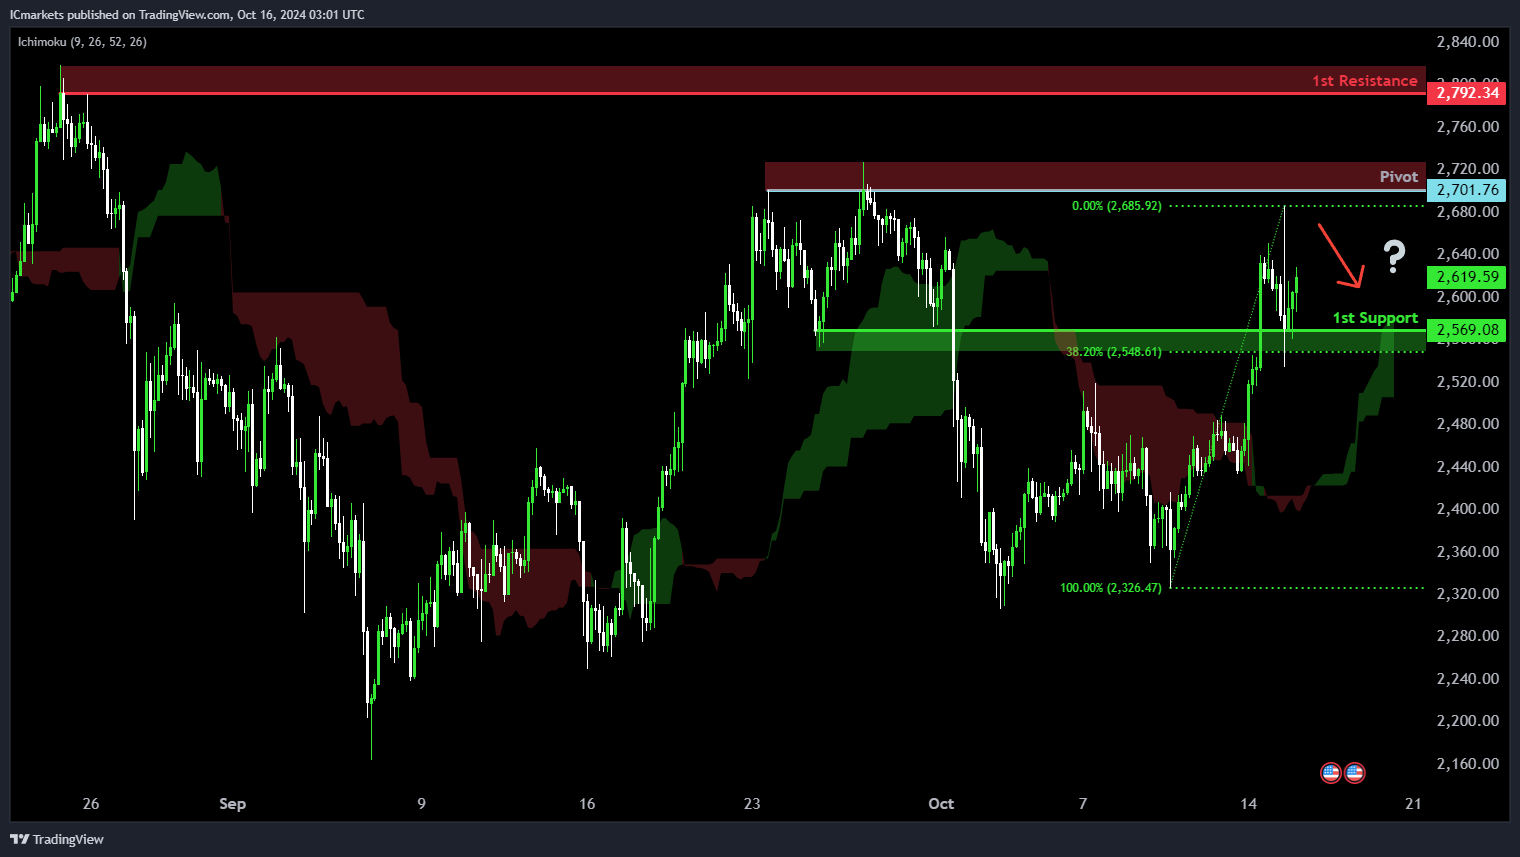
ETH/USD (Ethereum):
Potential Direction: Bearish
Overall momentum of the chart: Bullish
Price is rising towards the pivot and could potentially make a bearish reversal off this level to pull back towards the 1st support.
Pivot: 2,701.76
Supporting reasons: Identified as a multi-swing-high resistance, suggesting a potential area where selling pressures could intensify.
1st support: 2,569.08
Supporting reasons: Identified as a pullback support that aligns close to a 38.2% Fibonacci retracement, indicating a potential level where price could find support.
1st resistance: 2,792.34
Supporting reasons: Identified as a swing-high resistance, indicating a potential area that could halt any further upward movement.
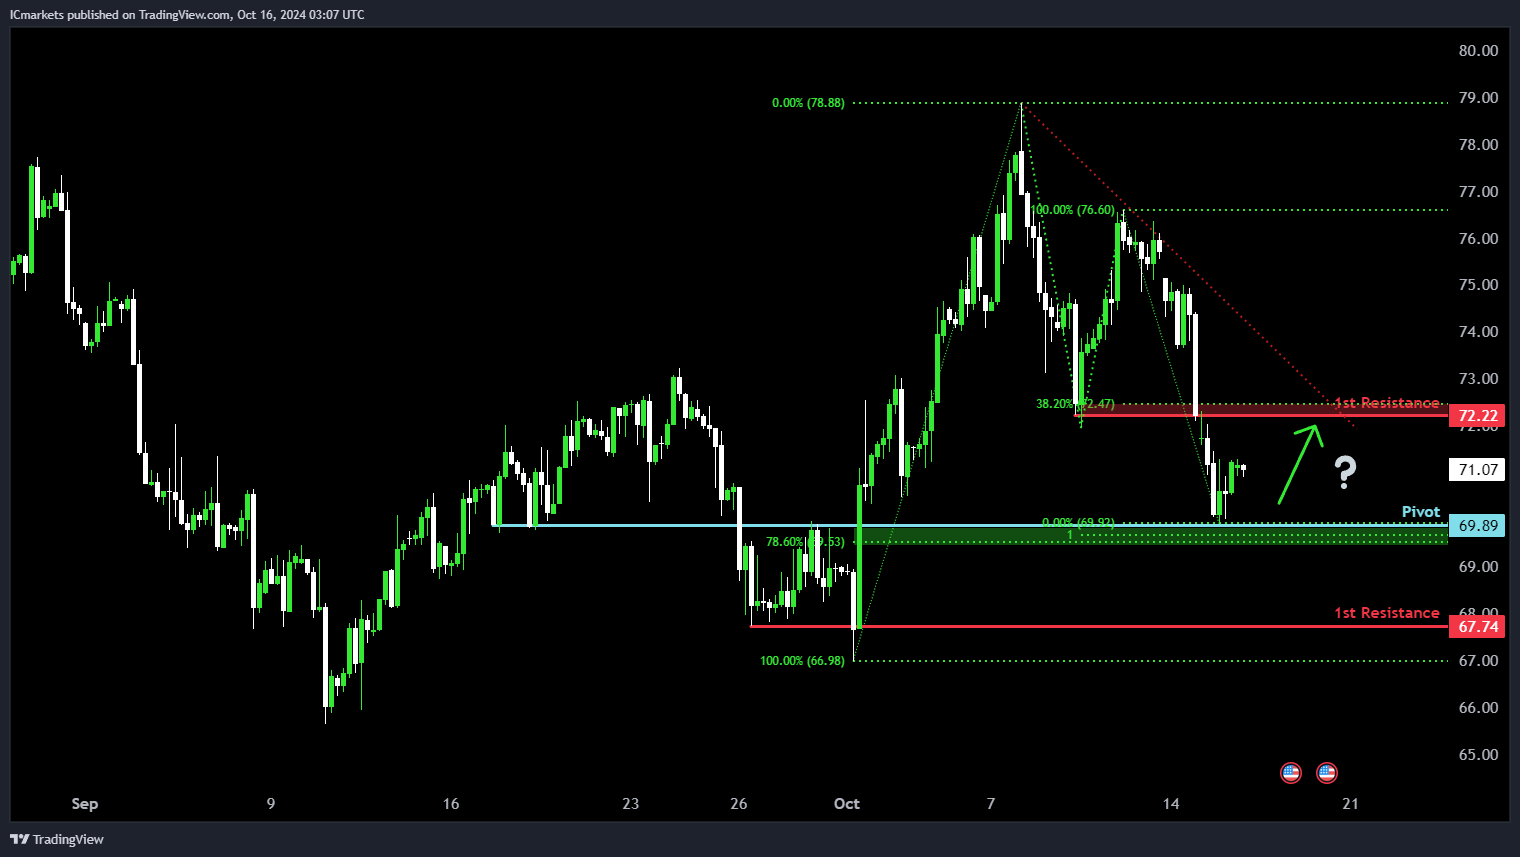
WTI/USD (Oil):
Potential Direction: Bullish
Overall momentum of the chart: Bearish
Price is falling towards the pivot and could potentially make a bullish bounce off this level to rise towards the 1st resistance.
Pivot: 69.89
Supporting reasons: Identified as an overlap support that aligns close to a confluence of Fibonacci levels i.e. a 78.6% retracement and a 100% projection, suggesting a potential area where buying interests could pick up to stage a minor rebound.
1st support: 67.74
Supporting reasons: Identified as a swing-low support, indicating a key level where price could find support once more.
1st resistance: 72.22
Supporting reasons: Identified as a pullback resistance that aligns close to a 38.2% Fibonacci retracement, indicating a potential area that could halt any further upward movement.
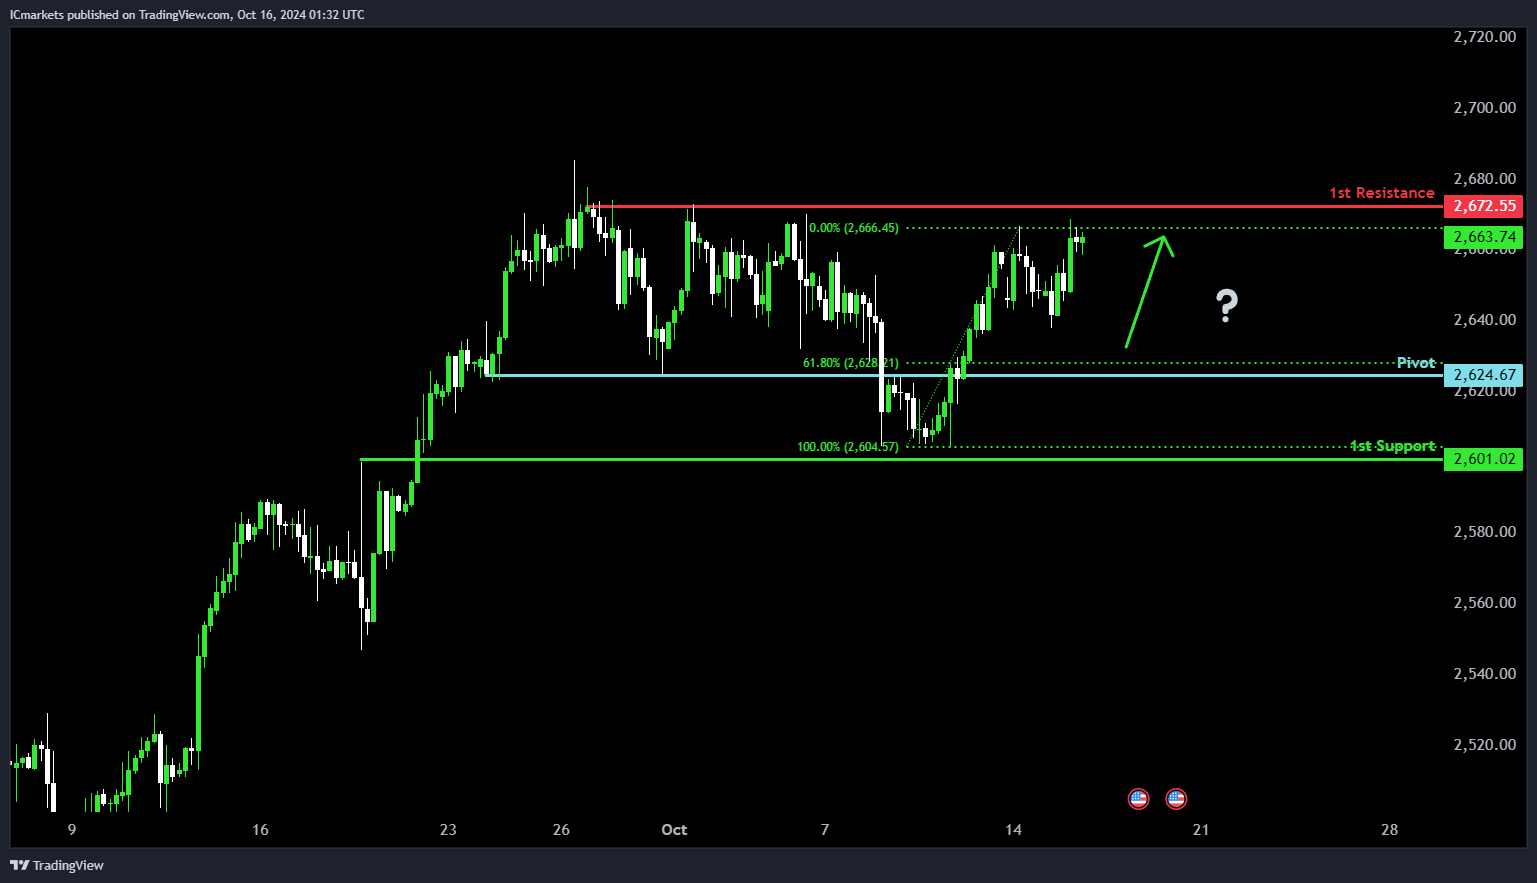
XAU/USD (GOLD):
Potential Direction: Bullish
Overall momentum of the chart: Bullish
Price could potentially make a bullish bounce-off pivot and head toward 1st resistance
Pivot: 2624.67
Supporting reasons: Identified as pullback support, aligned with the 61.80% Fibonacci Retracement, indicating this level could act as a significant support during price fluctuations.
1st support: 2601.02
Supporting reasons: Identified as pullback support, suggesting this level could offer strong support if the price declines.
1st resistance: 2672.55
Supporting reasons: Identified as multi-swing high resistance, indicating this level may act as a key resistance point where selling pressure could emerge.
The accuracy, completeness and timeliness of the information contained on this site cannot be guaranteed. IC Markets does not warranty, guarantee or make any representations, or assume any liability regarding financial results based on the use of the information in the site.
News, views, opinions, recommendations and other information obtained from sources outside of www.icmarkets.com, used in this site are believed to be reliable, but we cannot guarantee their accuracy or completeness. All such information is subject to change at any time without notice. IC Markets assumes no responsibility for the content of any linked site.
The fact that such links may exist does not indicate approval or endorsement of any material contained on any linked site. IC Markets is not liable for any harm caused by the transmission, through accessing the services or information on this site, of a computer virus, or other computer code or programming device that might be used to access, delete, damage, disable, disrupt or otherwise impede in any manner, the operation of the site or of any user’s software, hardware, data or property.