U.S. stock indices typically experience volatility around elections, both before and after the event. In 2024, the Nasdaq has led market movements, rising 25% over the year, outperforming the Dow, which is up nearly 14%, and the S&P, which has gained 22%. Currently, the Nasdaq is just below its record high, only a couple of weeks ahead of the November 5th election day. Traders are bracing for increased volatility in the days and weeks leading up to the election, as well as potential new trends emerging once the results are known.
The prevailing sentiment is that a Trump victory, especially if he sweeps the White House, Senate, and House of Representatives, would be negative for stock markets overall. Although some sectors may benefit, it could lead to significant corrections across indices, with the Nasdaq likely to be most affected, particularly if Trump enacts the tariffs he has proposed. His administration would also represent more inflationary conditions, potentially pressuring the Federal Reserve to maintain or raise interest rates, which is generally seen as negative for stocks.
A Democratic victory for Kamala Harris is perceived as less disruptive to the markets, partly because her party currently holds office. While her policies are also seen as inflationary, they are not viewed as having as severe a negative impact on the overall market. This scenario could present the best opportunity for the current bull run to continue post-election.
A split outcome, with different parties controlling the White House, Senate, and House of Representatives, could introduce more market uncertainty. Although this would likely be seen as a negative, it could also mean difficulty in implementing either candidate’s policies, possibly resulting in the continuation of current conditions. Regardless of the outcome, increased volatility appears to be the most likely scenario.
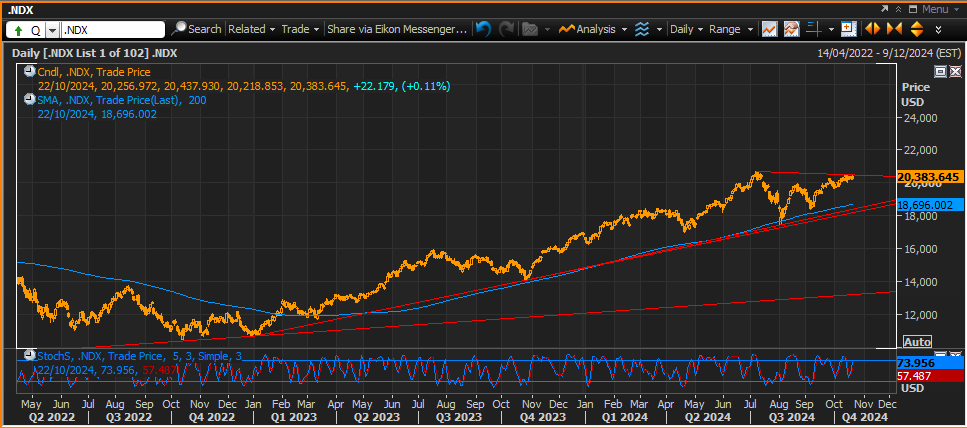
Resistance Levels:
- Resistance 2: 20,690.96 – All-Time High
- Resistance 1: 20,469.11 – Trendline Resistance
Support Levels:
- Support 1: 18,696.00 – 200-Day Moving Average
- Support 2: 18,426.88 – Trendline Support