Traders are bracing for a lively end to an already busy week in the financial markets. The key Non-Farm Payrolls data is set to be released in the final trading session of the week, and it has the potential to move markets even more than it typically does. Jobs data has been a clear focal point for the Federal Reserve at recent meetings, and this release comes just days ahead of their latest session. Any major surprise from the expected 108k increase could send markets into a fresh rally. Average Hourly Earnings (expected +0.3%) and the Unemployment Rate (expected 4.1%) are due at the same time, but the main focus will be on the headline number, which saw a massive upside surprise last month, leading to a 4%+ rally in the dollar.
Adding a significant twist to this week’s update is the upcoming U.S. election, which could overshadow the impact of key data as investors shift their focus to next week’s results. Currently, markets are pricing in a 62% chance of a Trump victory. Should this forecast prove accurate, especially with control of both the Senate and the House of Representatives, we could see further dollar strength as Republican policies would face fewer hurdles. Conversely, if Kamala Harris gains momentum in the polls, expect the dollar to retreat somewhat, though Democratic policies could also introduce inflationary pressures into the U.S. economy over the long term.
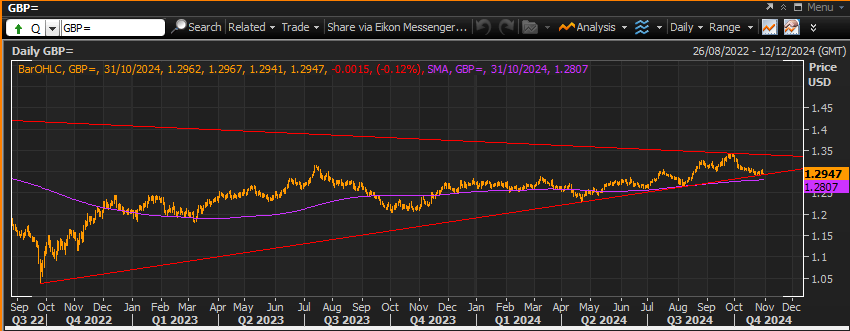
Cable has been trading in alignment with the dollar’s performance in recent sessions and sits attractively on the daily charts for traders looking to capitalize on potential dollar moves from both Non-Farm data and longer-term election outcomes. Recently, it has retreated from annual highs in line with a stronger dollar and now rests on strong, long-term support levels. Stronger U.S. job numbers combined with a Trump victory could see the pair break through these levels, pushing it toward annual lows in short order. Conversely, weaker job numbers and/or a Democratic victory could lead to dollar selling, allowing Cable to rally back into recent ranges and potentially push toward the annual high. Many possible scenarios lie ahead, and if key events align, we could see the beginning of fresh trends for longer-term movements.
Resistance 2: 1.3434 – 2024 High
Resistance 1: 1.3396 – Trendline Resistance
Support 1: 1.2904 – October Low
Support 2: 1.2807 – 200 Day Moving Average


