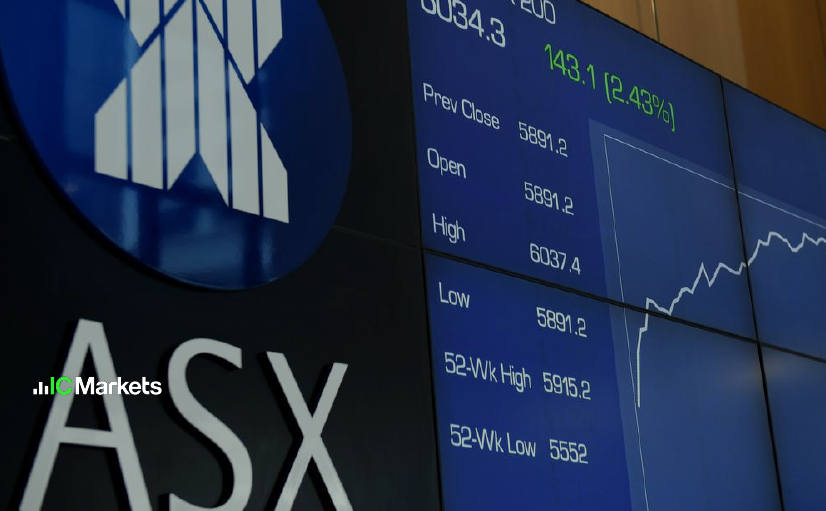
Tuesday 5th September 2023: Asian Markets React to Central Bank Decision and Inflation Trends
Global Markets: News & Data: Markets Update: Australia’s central bank, the […]

Tuesday 5th September 2023: Technical Outlook and Review
The DXY chart exhibits a bullish momentum, indicating an upward trend in price movement. This sentiment is supported by the price's position within a bullish ascending channel, suggesting the potential for further upward momentum.

Monday 4th September 2023: Technical Outlook and Review
The DXY chart is currently showing a bullish overall momentum, suggesting an upward trend in the price movement. This bullish sentiment is reinforced by the fact that the price is within a bullish ascending channel, indicating a potential continuation of the upward trajectory.

HK50: Weather Conditions That May Effect Trading
If a Typhoon Signal or Black Rainstorm Warning has been issued […]

Thursday 31st August 2023: Technical Outlook and Review
The current state of the DXY chart indicates a bullish momentum overall. There is a potential scenario where the price could experience a bullish rebound from the 1st support level and subsequently move towards the 1st resistance level.

Wednesday 30th August 2023: Technical Outlook and Review
The DXY (US Dollar Index) chart is currently characterized by a bearish momentum, attributed to its break below an ascending support line, indicating the potential for a downward price movement. In this context, the chart could potentially witness a decline towards the 1st support level at 103.40.

Tuesday 29th Aug 2023: Technical Outlook and Review
The DXY (US Dollar Index) chart is currently showing bullish overall momentum, suggesting a potential upward trend in the price. The price is above a major ascending trend line, indicating the possibility of further bullish movement, and it's also above the bullish Ichimoku cloud, which reinforces the bullish sentiment.

US Labor Day Trading Schedule 2023
Please find our updated trading schedule for the US Labor Day Holiday on Monday, 04th September 2023.

South Africa Heritage Day Trading Schedule 2023
Dear Trader, Please find our updated trading schedule for the South Africa Heritage Day on Monday September 25th, 2023. IC Markets


