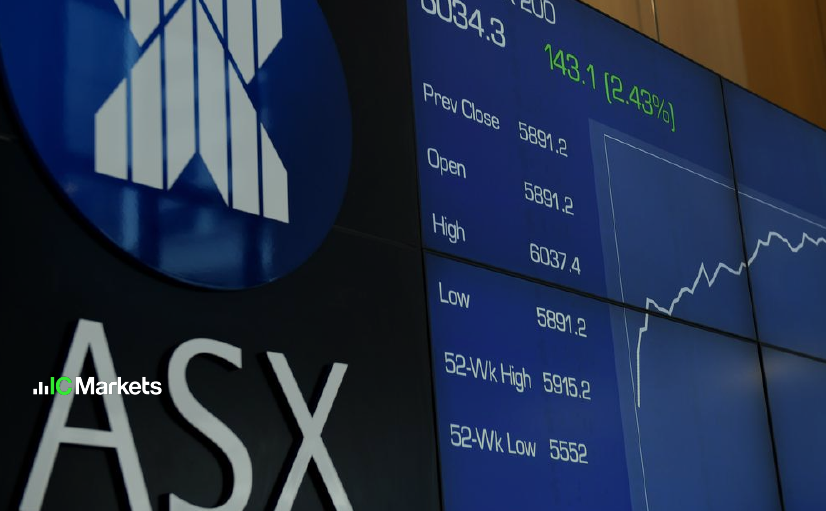
Monday 27th November 2023: Asia-Pacific Markets Begin Week with Declines; Economic Indicators Awaited
Global Markets: News & Data: Markets Update: The Asia-Pacific markets opened […]

Monday 27th November 2023: Technical Outlook and Review
The DXY (Dollar Index), the overall momentum of the chart is weak bullish with low confidence, suggesting a tentative upward bias. There's a potential scenario where price could experience a bullish bounce off the 1st support and head towards the 1st resistance.

IC Markets Asia Fundamental Forecast | 27 November 2023
IC Markets Asia Fundamental Forecast | 27 November 2023 What happened […]

IC Markets Europe Fundamental Forecast | 22 November 2023
IC Markets Europe Fundamental Forecast | 22 November 2023 What happened […]

Wednesday 22nd November 2023: Technical Outlook and Review
The DXY (US Dollar Index) chart currently indicates a bullish momentum, suggesting a potential bullish continuation towards the first resistance at 103.99.

IC Markets Asia Fundamental Forecast | 22 November 2023
IC Markets Asia Fundamental Forecast | 22 November 2023 What happened […]

Wednesday 22nd November 2023: Asia-Pacific Markets React to Fed’s Policy Stance & U.S. Market Movement
Global Markets: News & Data: Markets Update: Asia-Pacific markets displayed a […]

IC Markets Europe Fundamental Forecast | 21 November 2023
IC Markets Europe Fundamental Forecast | 21 November 2023 What happened […]

Tuesday 21st November 2023: Technical Outlook and Review
The DXY (US Dollar Index) chart currently has an overall bearish overall momentum, suggesting the potential for a bearish continuation towards the 1st support.


