Memorizing double candlestick patterns can be a bit more challenging, but the trading results can be very rewarding. As with the single Japanese candlestick patterns, these come in bullish and bearish versions.
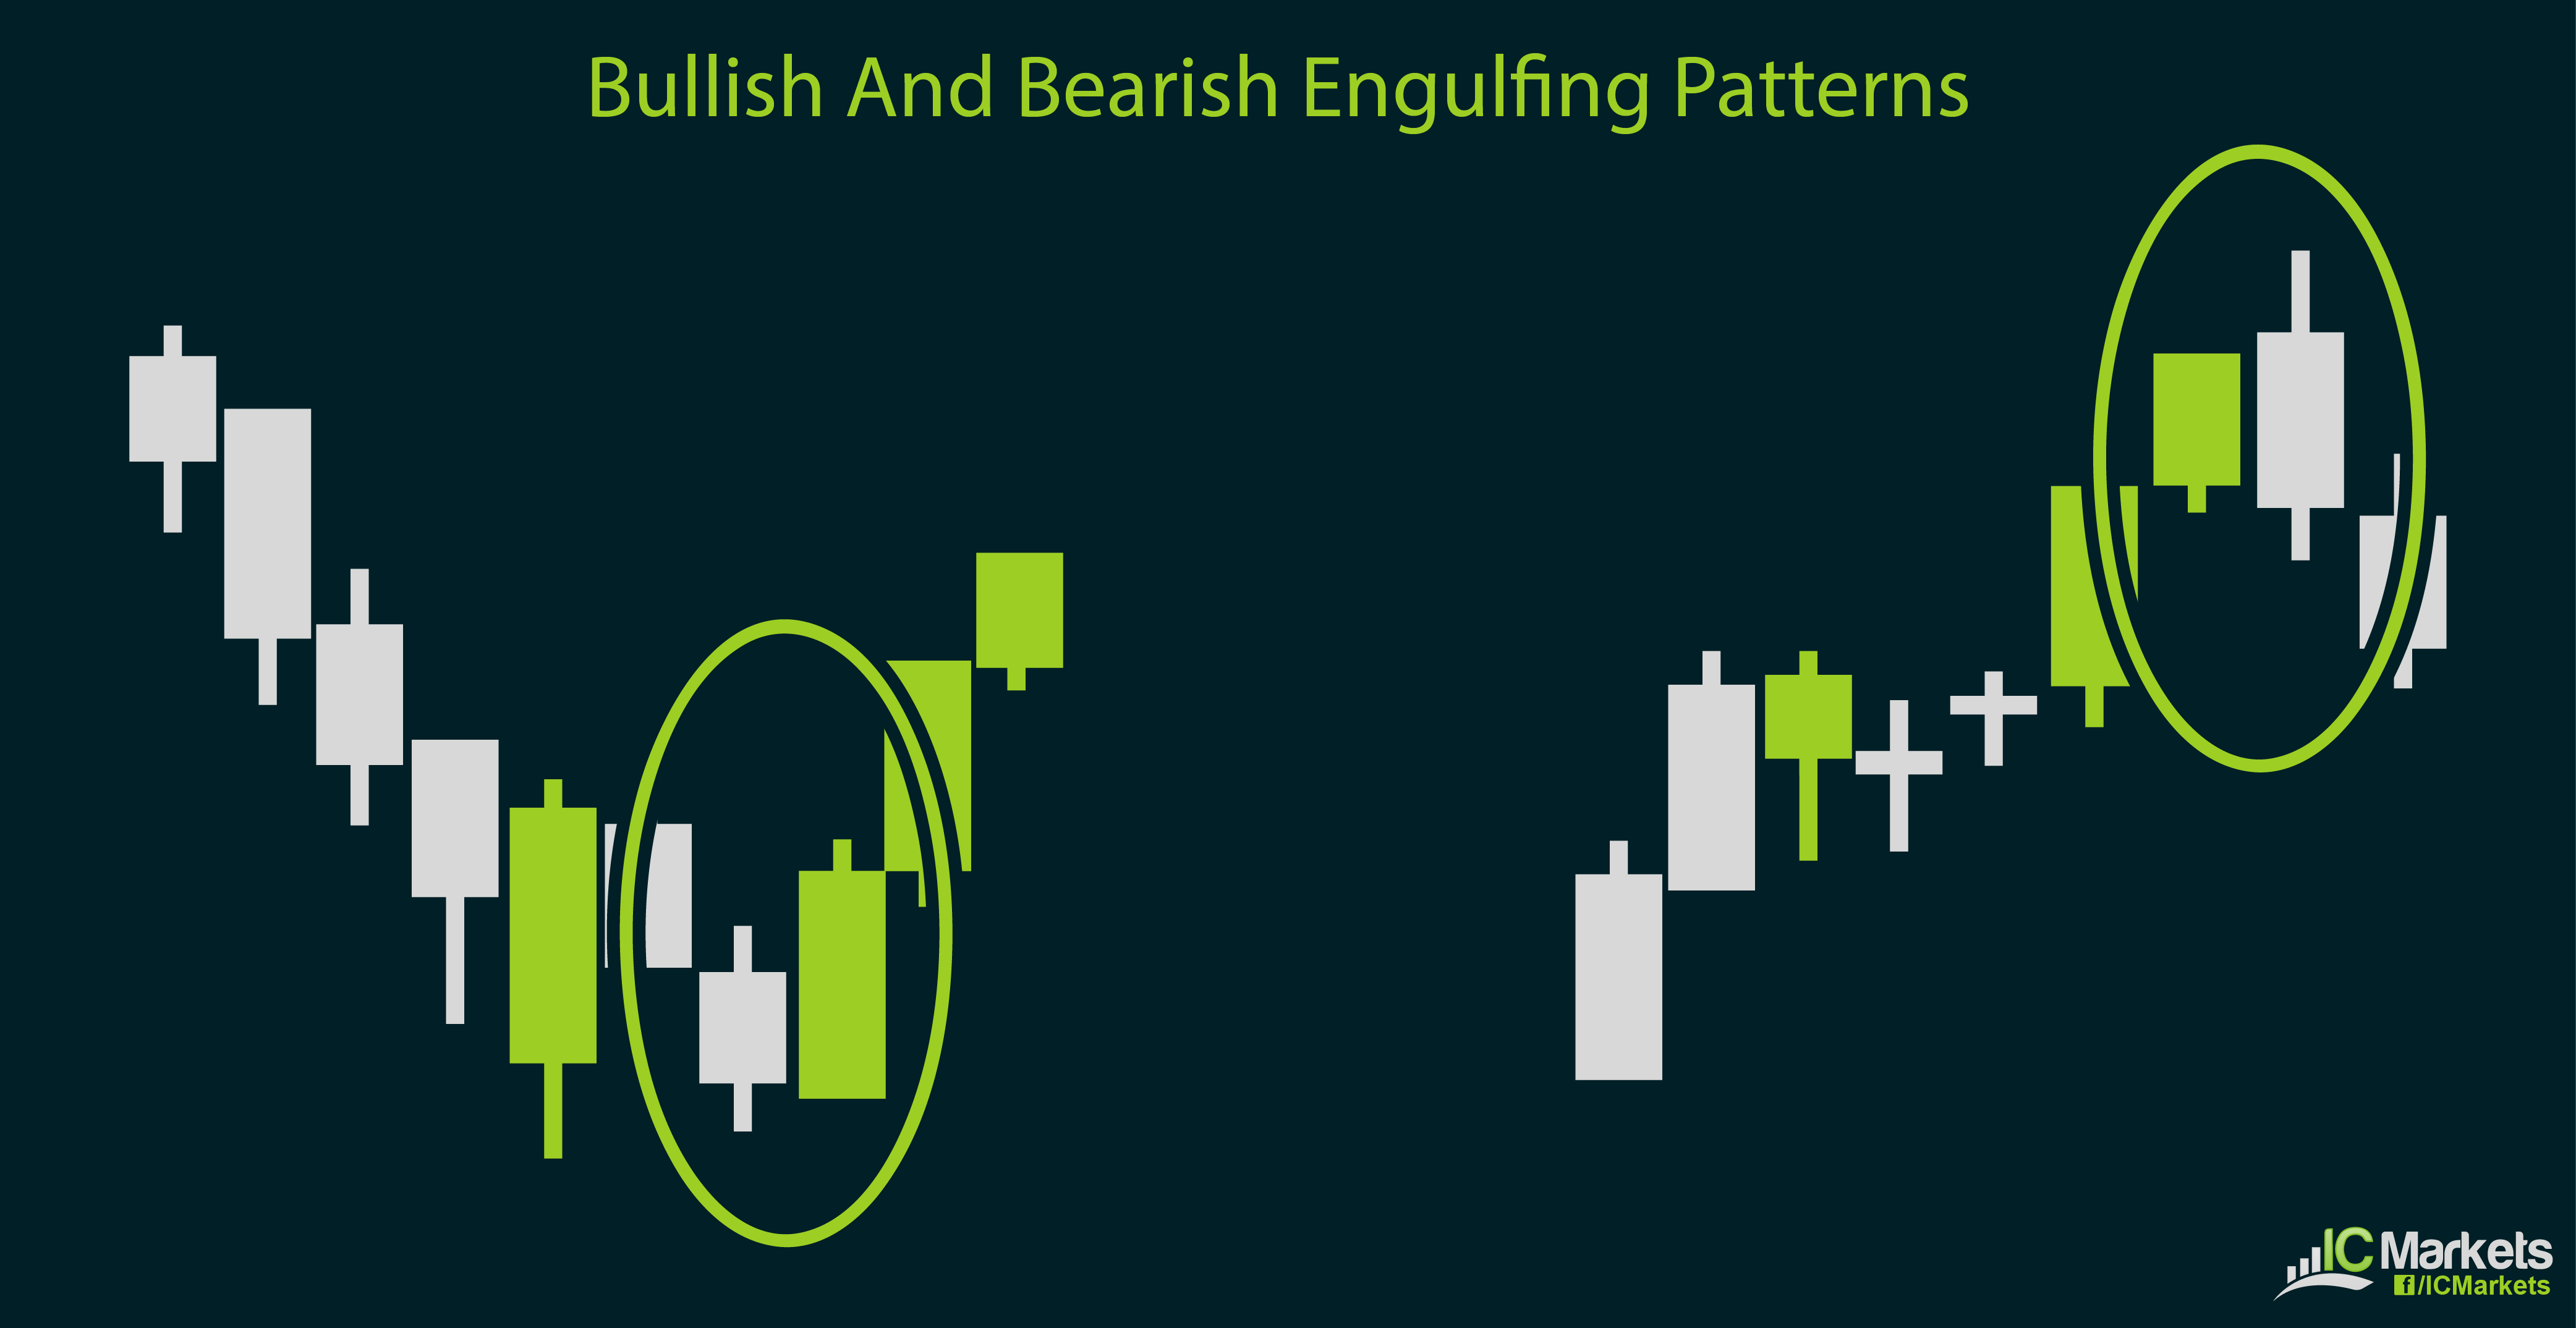
The most basic type of dual candlestick formation is the bullish or bearish engulfing pattern. Simply put, the engulfing pattern occurs at the end of a market trend, with the first or setup candle showing signs of exhaustion and the confirmation candle indicating a complete takeover or reversal.
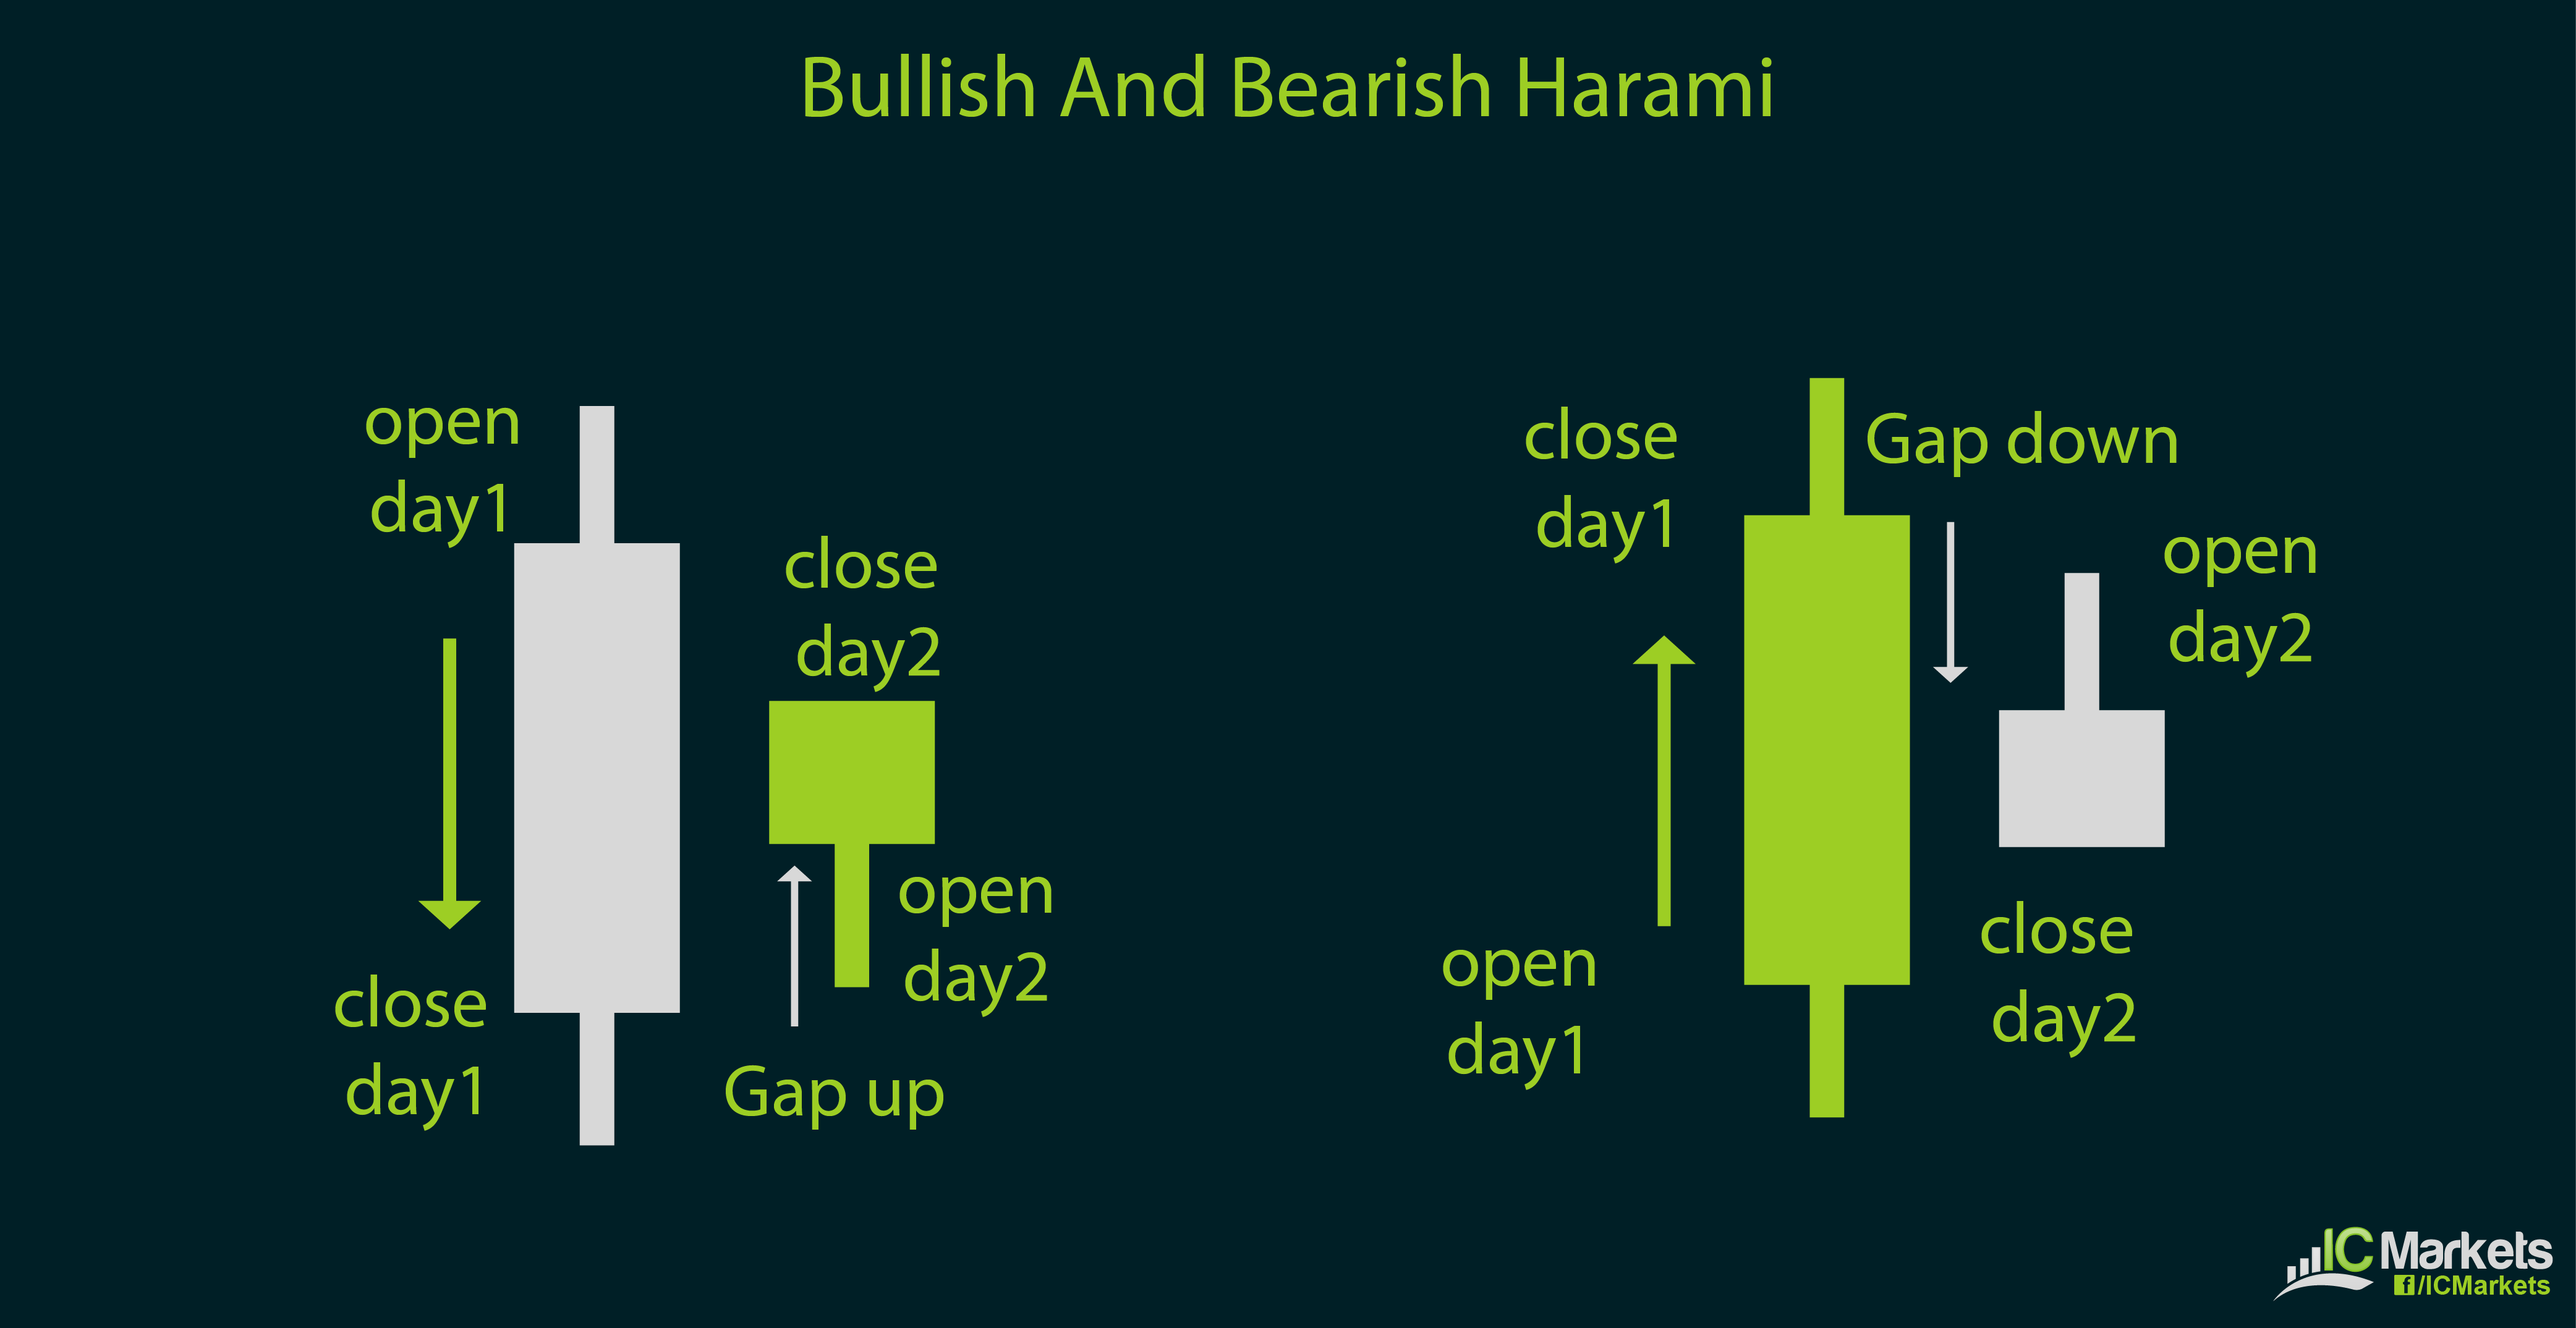
In other words, the confirmation or second candle’s high is higher than that of the setup candle and its low is lower as well. Another kind of dual candlestick formation is the harami. In Japanese, this translates to “pregnant”, which is an easy way of remembering how the pattern looks like. It can be considered a reverse of the engulfing pattern, as the confirmation candle has a lower high and a higher low compared to the first candle.
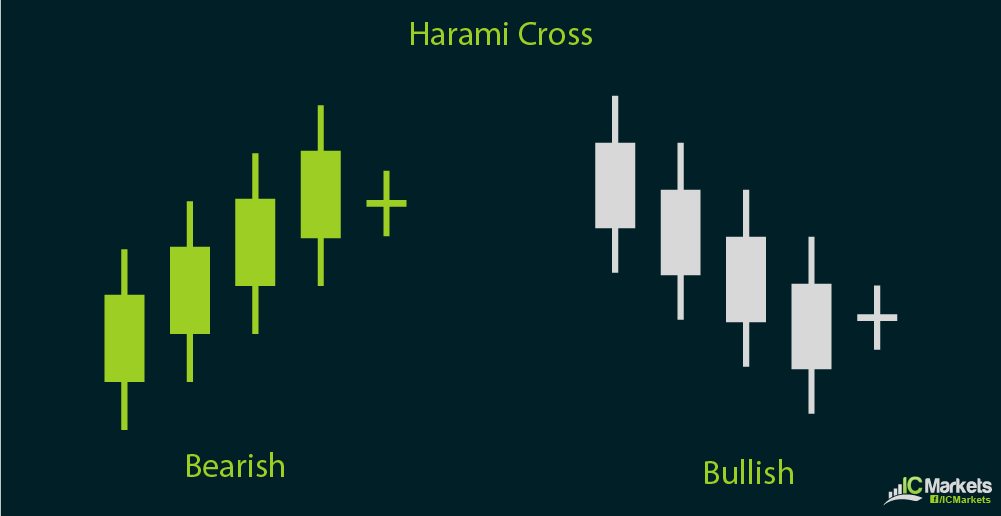
This pattern is also known as an inside day formation. A variation of this pattern is known as the harami cross, wherein the second candle is a doji that is inside the first candle. This also has a bullish and bearish version, both of which indicate a potential price reversal.
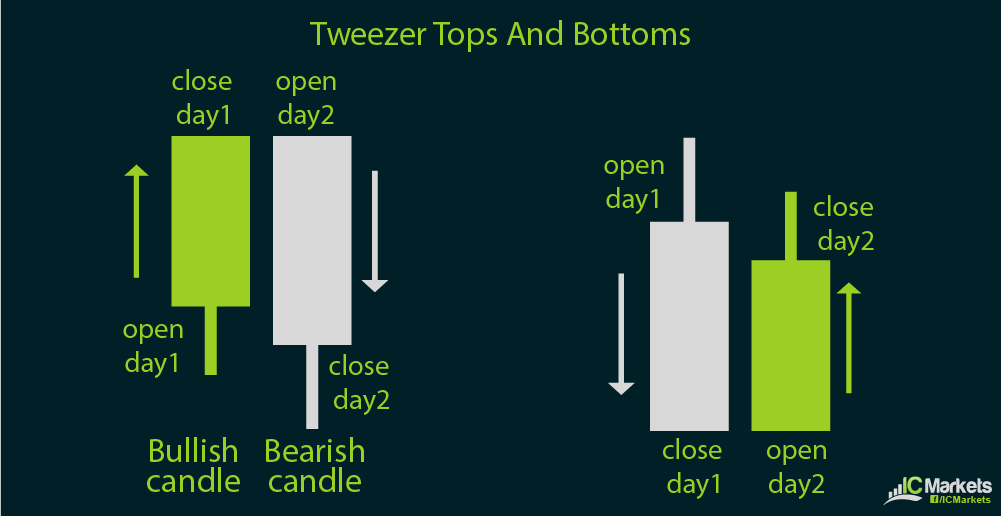
Next up are the tweezer tops and bottoms. This kind of double candlestick pattern also occurs on top of an uptrend or at the bottom of a downtrend, signaling a possible price reversal. The name of the formation is given because of the double highs of tweezer tops or double lows of tweezer bottoms which should be of equal length.
Furthermore, the first candle of the tweezer top or bottom should be in the direction of the previous trend. In other words, a tweezer top should have a bullish first candle while a tweezer bottom should have a bearish first candle. Then the second candle should be the opposite of the previous trend, which means that a tweezer top should have a bearish second candle while a tweezer bottom should have a bullish second candle.
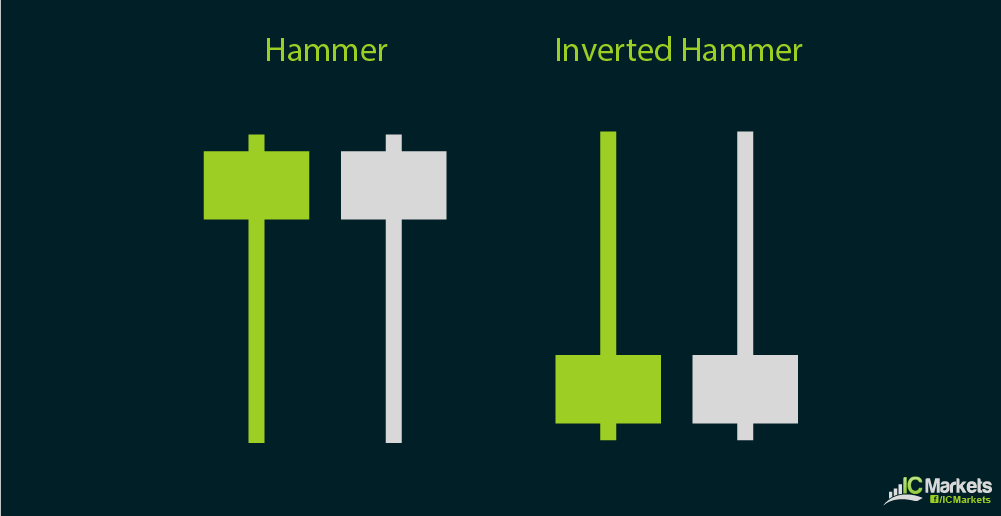
One of the more rare double candlestick patterns are the hammer and inverted hammer, both of which also hint at possible reversals. The hammer has a small body with a long lower wick and no upper wick while the inverted hammer has a small body with a long upper wick and no lower wick.
The bearish hammer is also known as a hanging man while the bearish inverted hammer can also be called a shooting star. For these dual candlestick patterns, the first or signal candlestick is a long candle followed by a gap down before the second or setup candle.

