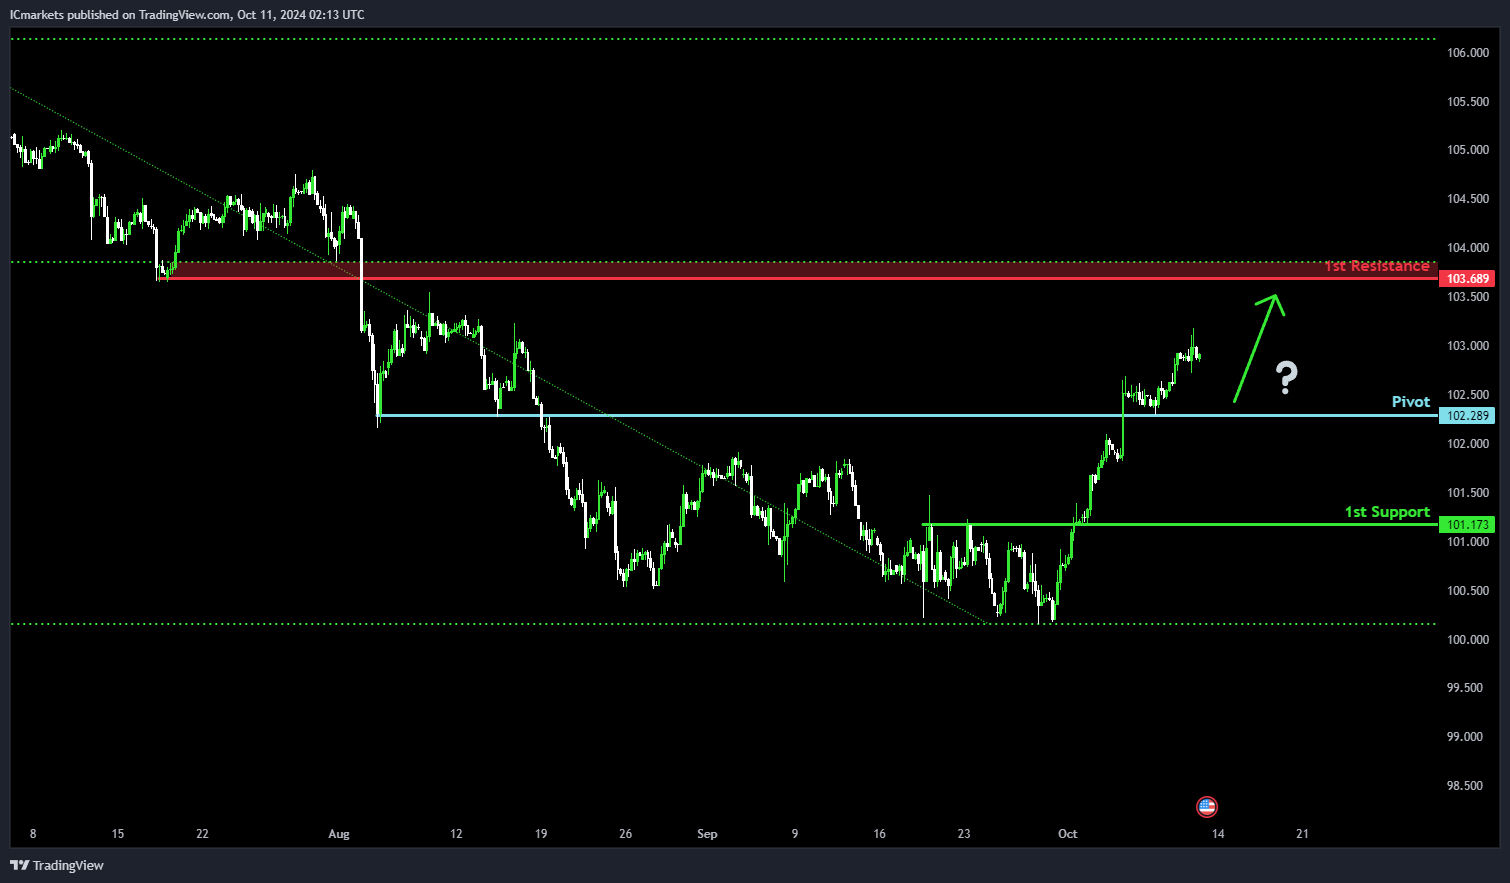
DXY (US Dollar Index):
Potential Direction: Bullish
Overall momentum of the chart: Bullish
Price could potentially make a: Bullish continuation towards 1st resistance.
Pivot: 102.16
Supporting reasons: Pullback support, indicating this level may act as a significant support point.
1st support: 101.17
Supporting reasons: An overlap support, suggesting this level could provide strong support if the price declines.
1st resistance: 103.68
Supporting reasons: Pullback resistance with 78.60% Fibonacci Retracement, marking a level where the price might encounter selling pressure if it attempts to rise.
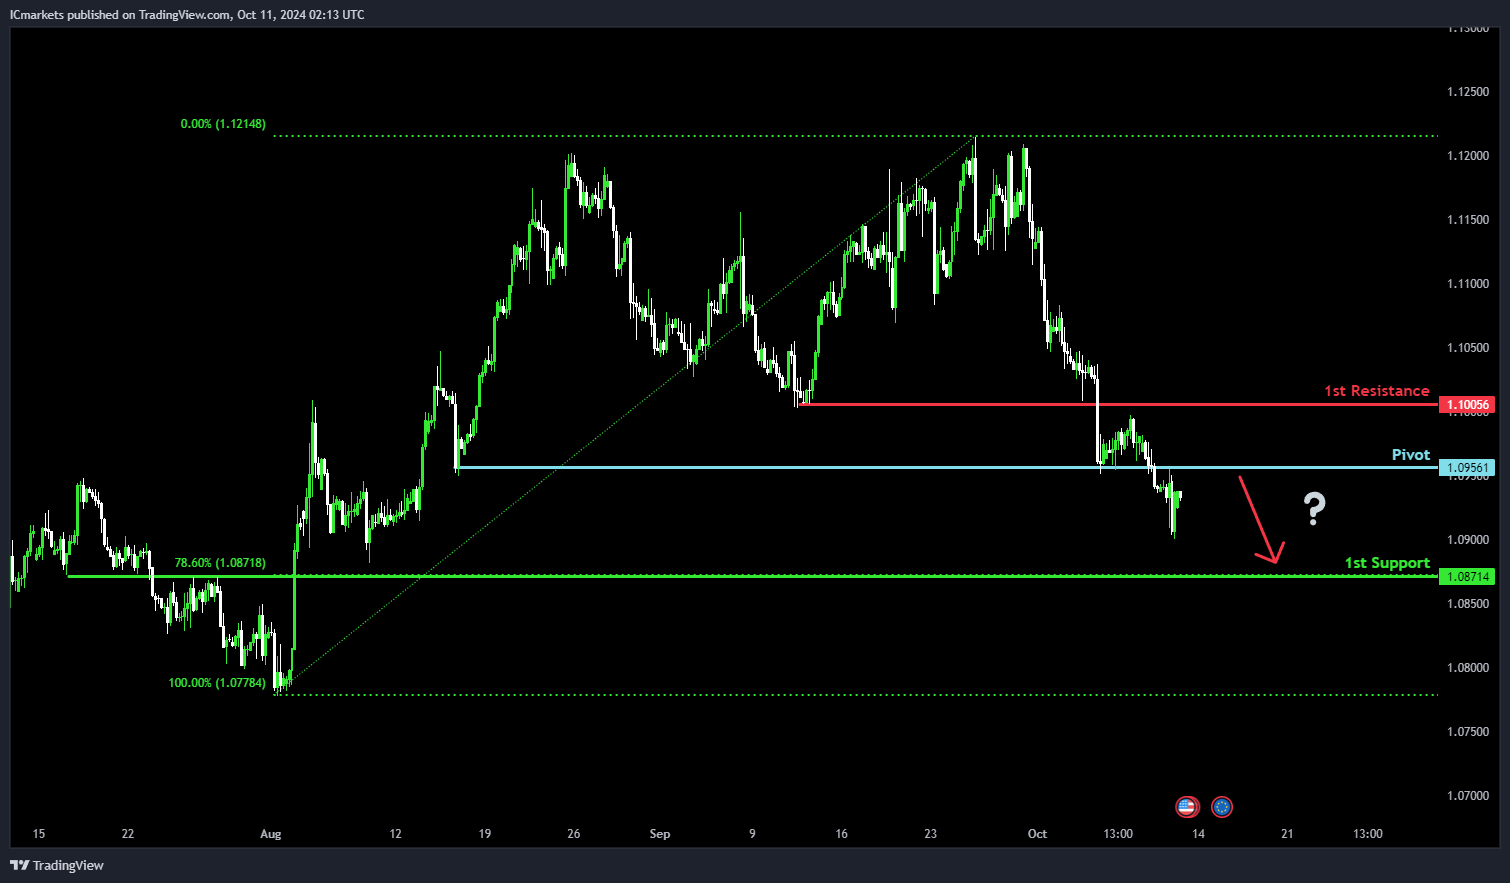
EUR/USD:
Potential Direction: Bearish
Overall momentum of the chart: Bearish
Price could potentially make a: Bearish continuation towards 1st support.
Pivot: 1.0956
Supporting reasons: An overlap resistance, indicating this level may act as a significant resistance point.
1st support: 1.0871
Supporting reasons: Pullback support with 78.60% Fibonacci Retracement, suggesting this level could provide strong support if the price declines.
1st resistance: 1.1005
Supporting reasons: Pullback resistance, marking a level where the price might encounter selling pressure if it attempts to rise.
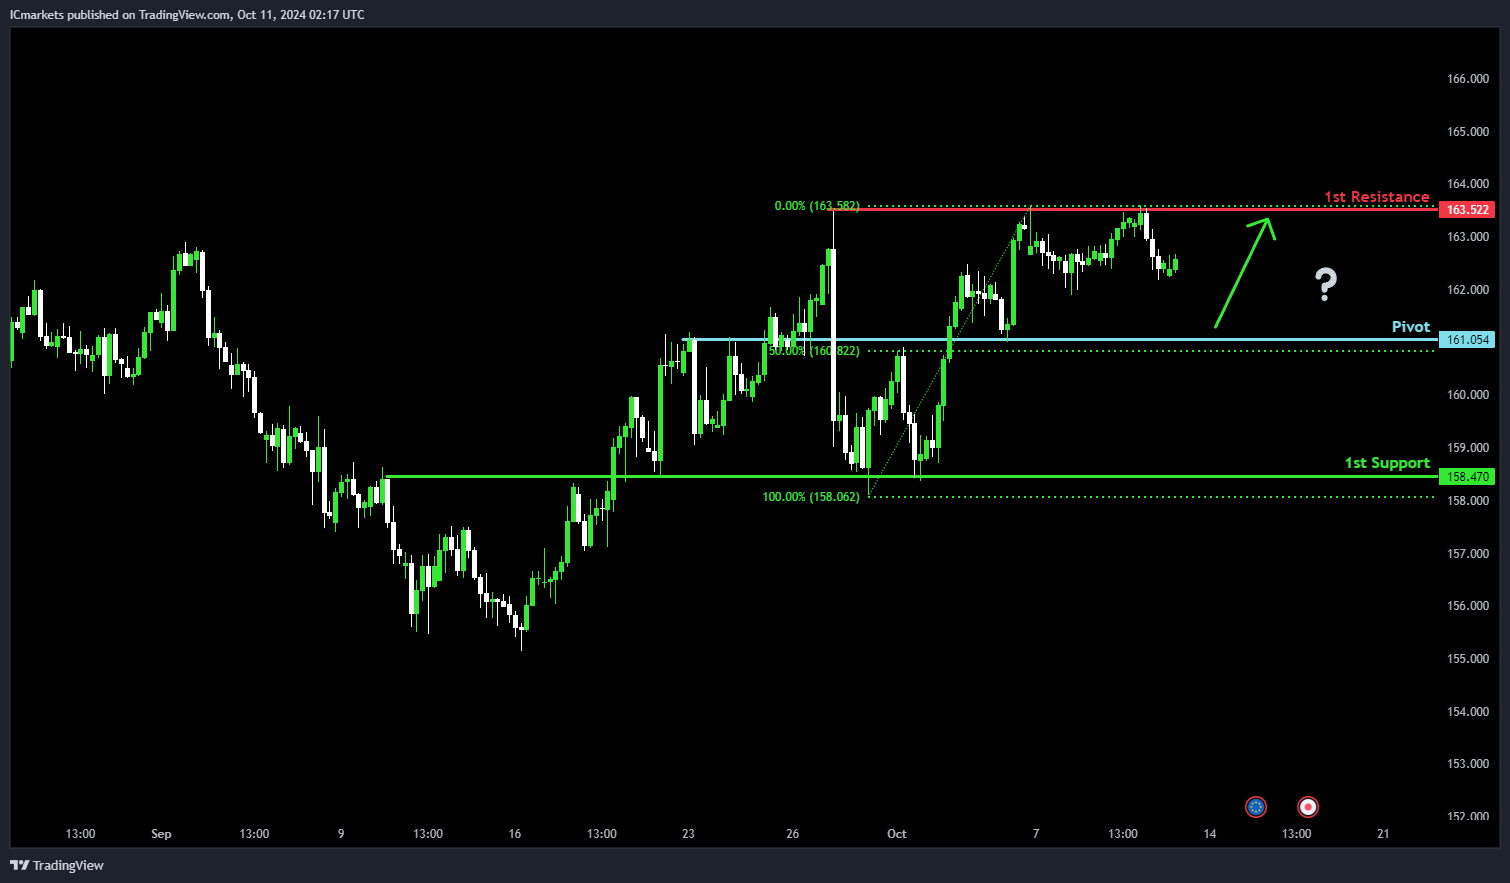
EUR/JPY:
Potential Direction: Bullish
Overall momentum of the chart: Bullish
Price could potentially make a: Bullish bounce off pivot and head towards 1st resistance.
Pivot: 161.05
Supporting reasons: An overlap support with 50% Fibonacci Retracement, indicating this level may act as a significant support point.
1st support: 158.47
Supporting reasons: An overlap support, suggesting this level could provide strong support if the price declines.
1st resistance: 163.52
Supporting reasons: Multi-swing high resistance, marking a level where the price might encounter selling pressure if it attempts to rise.
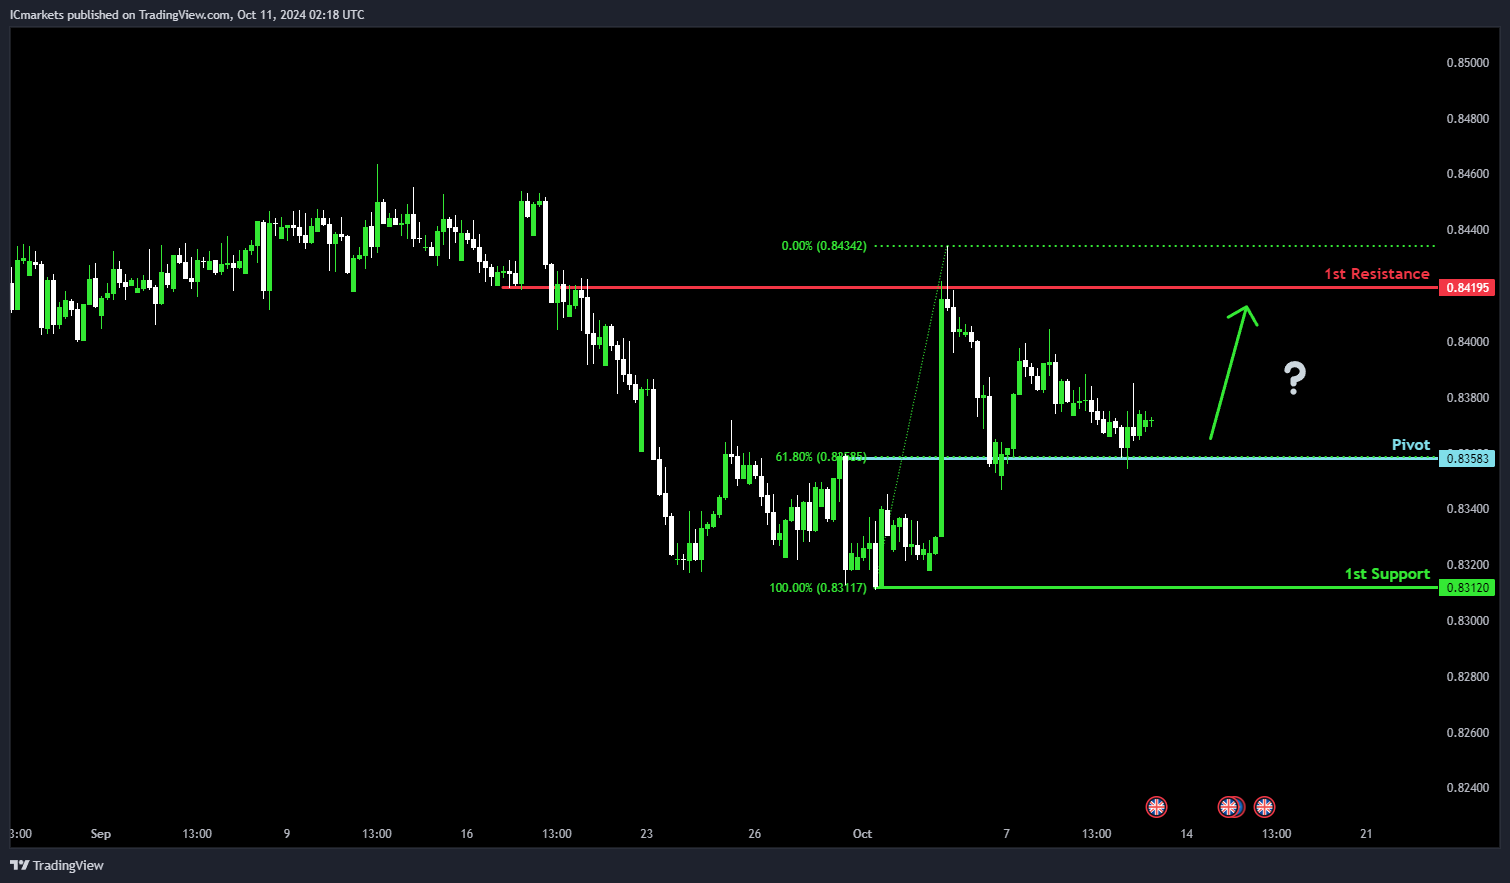
EUR/GBP:
Potential Direction: Bullish
Overall momentum of the chart: Bullish
Price could potentially make a: Bullish continuation towards 1st resistance.
Pivot: 0.8358
Supporting reasons: An overlap support with 61.80% Fibonacci Retracement, indicating this level may act as a significant support point.
1st support: 0.8312
Supporting reasons: Swing low support, suggesting this level could provide strong support if the price declines.
1st resistance: 0.8419
Supporting reasons: An overlap resistance, marking a level where the price might encounter selling pressure if it attempts to rise.
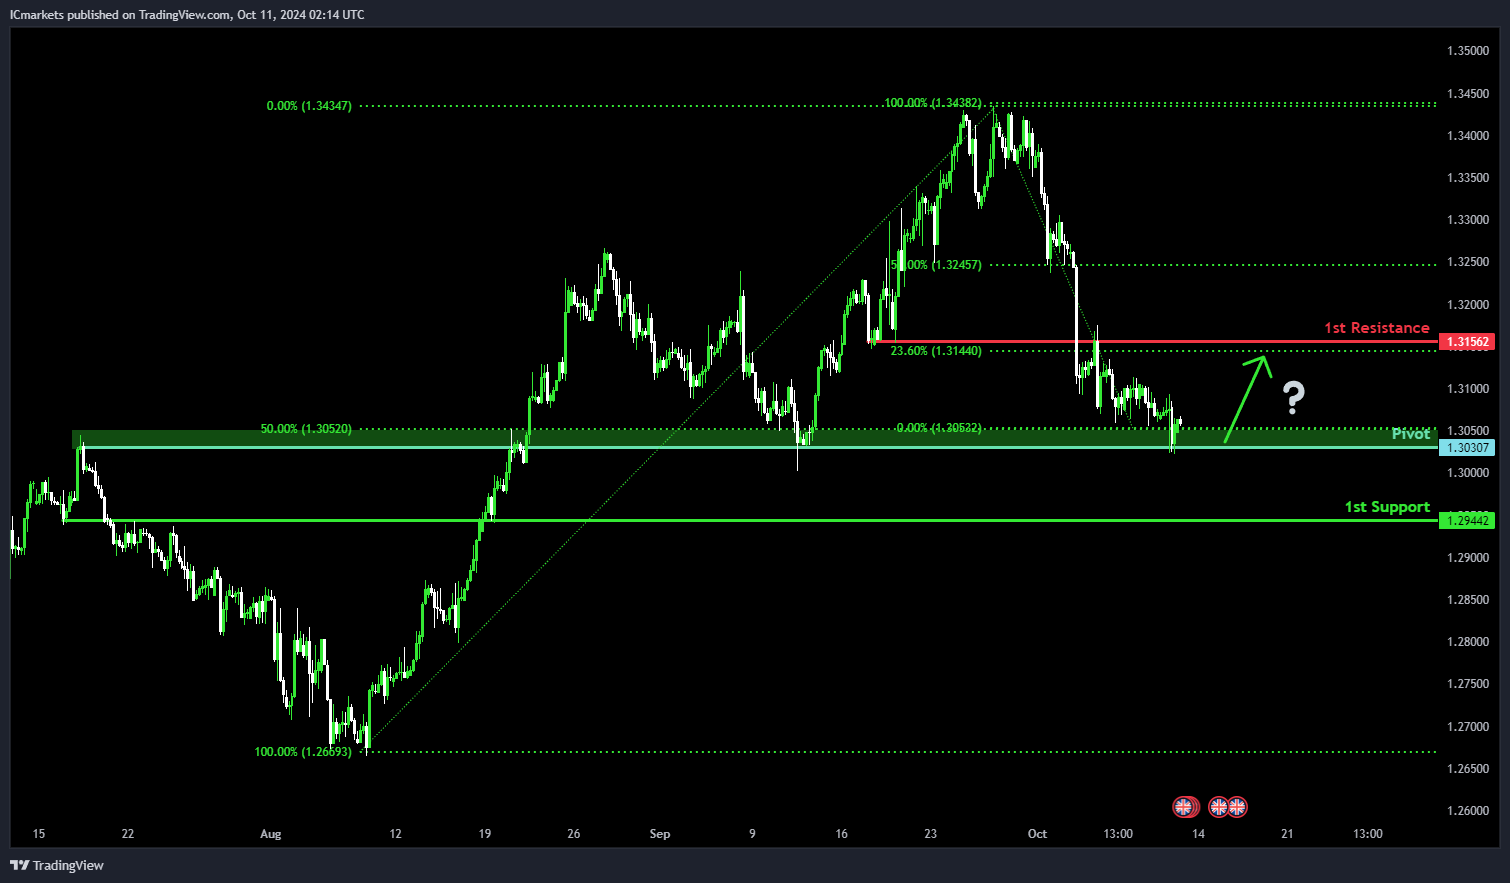
GBP/USD:
Potential Direction: Bullish
Overall momentum of the chart: Bearish
Price could potentially make a: Bullish bounce off pivot and head towards 1st resistance.
Pivot: 1.3030
Supporting reasons: An overlap support with 50% Fibonacci Retracement, indicating this level may act as a significant support point.
1st support: 1.2944
Supporting reasons: An overlap support, suggesting this level could provide strong support if the price declines.
1st resistance: 1.3156
Supporting reasons: An overlap resistance with 23.60% Fibonacci Retracement, marking a level where the price might encounter selling pressure if it attempts to rise.
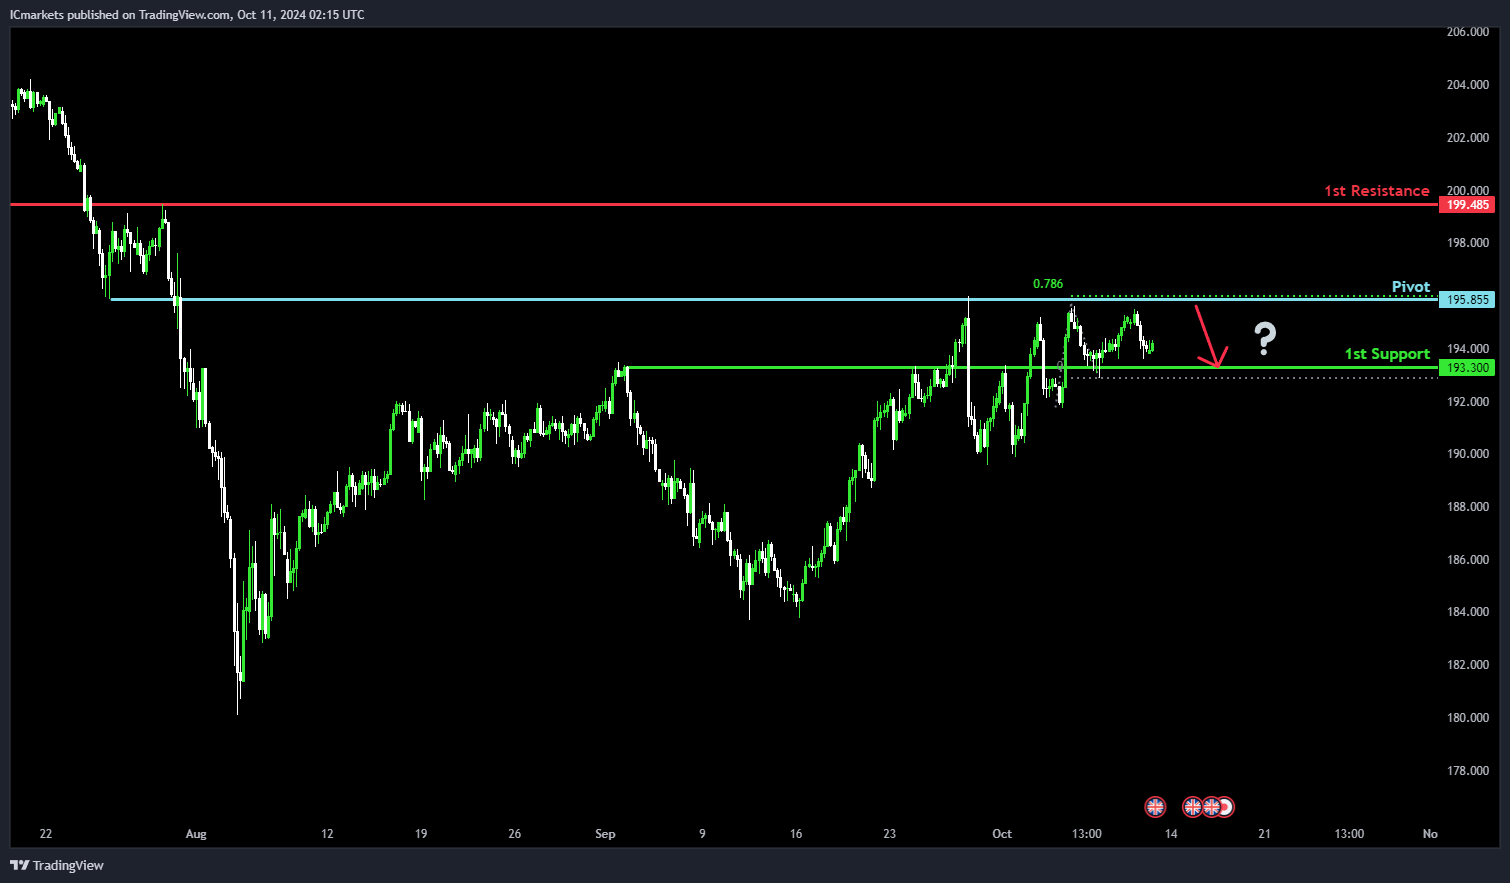
GBP/JPY:
Potential Direction: Bearish
Overall momentum of the chart: Bullish
Price could potentially make a: Bearish reaction off pivot and drop to 1st support.
Pivot: 195.85
Supporting reasons: An overlap resistance with 78.60% Fibonacci Projection, indicating this level may act as a significant resistance point.
1st support: 193.30
Supporting reasons: An overlap support, suggesting this level could provide strong support if the price declines.
1st resistance: 199.48
Supporting reasons: An overlap resistance, marking a level where the price might encounter selling pressure if it attempts to rise.
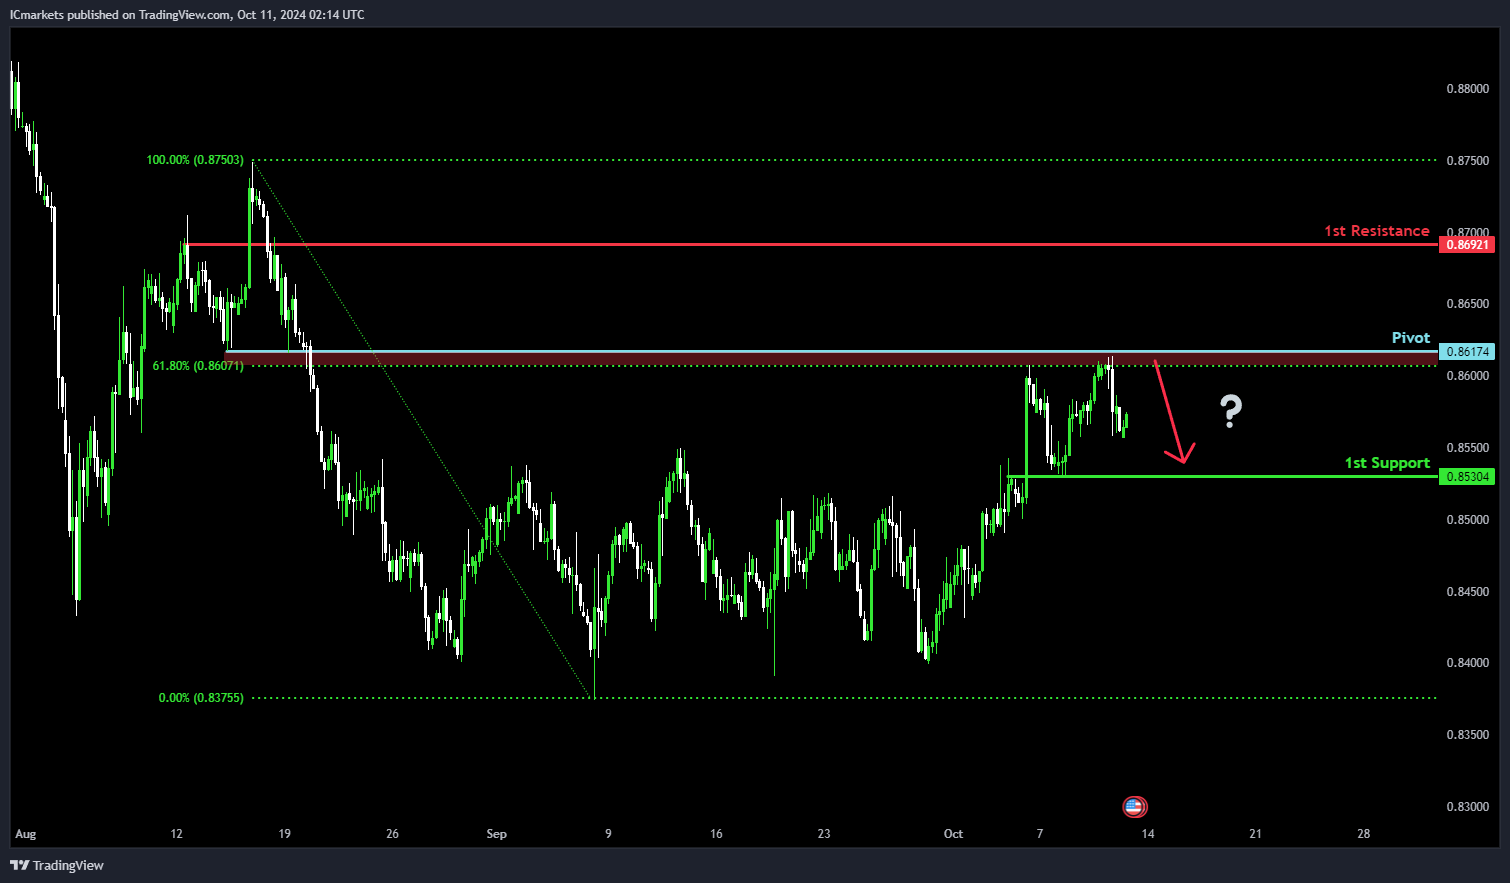
USD/CHF:
Potential Direction: Bearish
Overall momentum of the chart: Bullish
Price could potentially make a: Bearish continuation towards 1st support.
Pivot: 0.8617
Supporting reasons: An overlap resistance with 61.80% Fibonacci Retracement, indicating this level may act as a significant resistance point.
1st support: 0.8530
Supporting reasons: An overlap support, suggesting this level could provide strong support if the price declines.
1st resistance: 0.8692
Supporting reasons: An overlap resistance, marking a level where the price might encounter selling pressure if it attempts to rise.
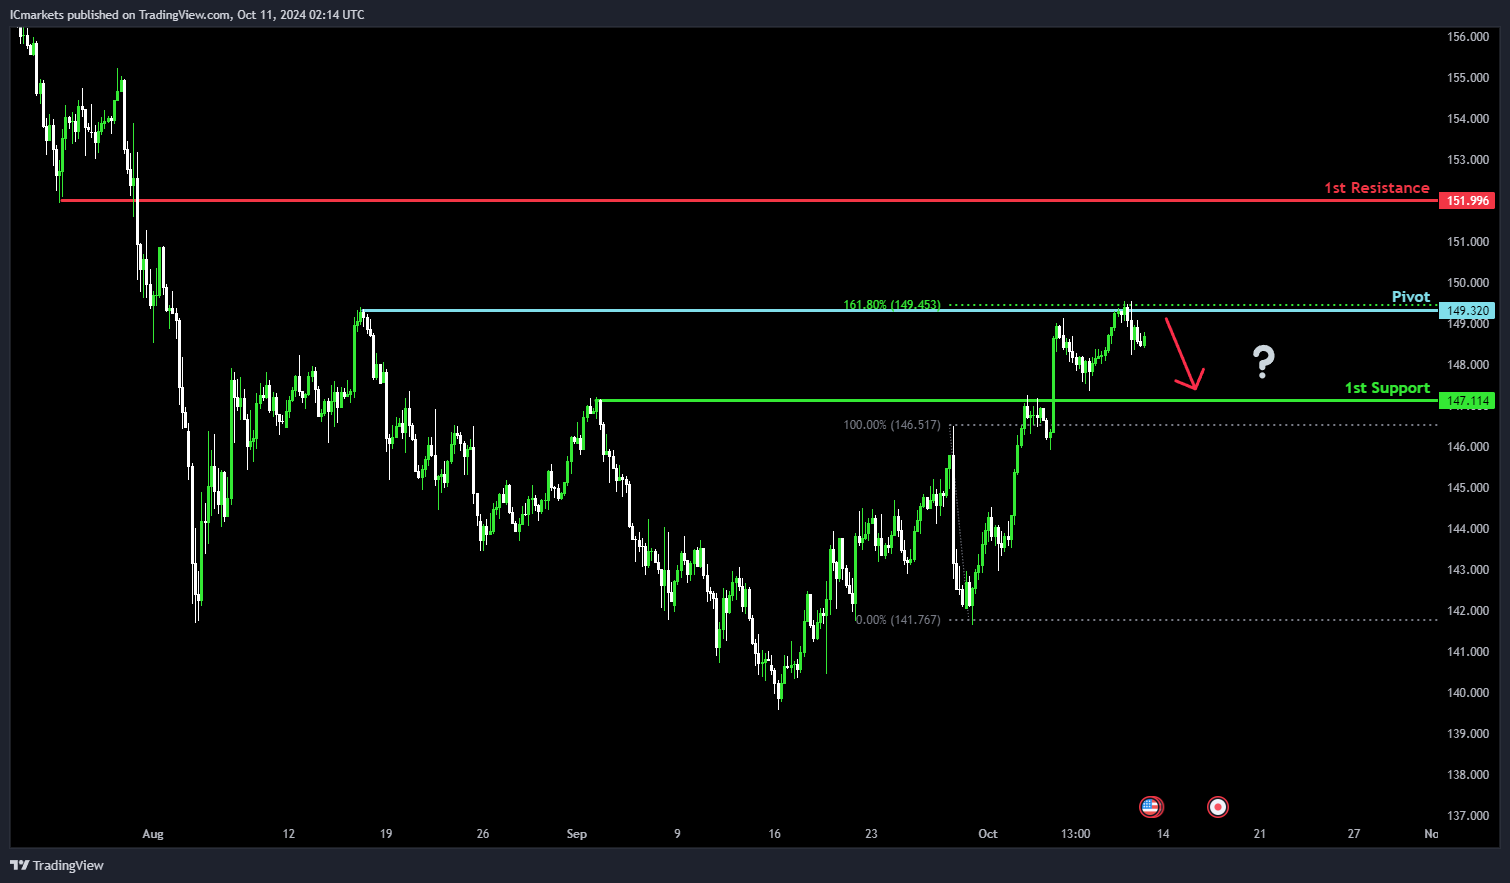
USD/JPY:
Potential Direction: Bearish
Overall momentum of the chart: Bullish
Price could potentially make a: Bearish continuation towards 1st support.
Pivot: 149.32
Supporting reasons: Multi-swing high resistance with 161.80% Fibonacci Extension, indicating this level may act as a significant resistance point.
1st support: 147.11
Supporting reasons: Pullback support, suggesting this level could provide strong support if the price declines.
1st resistance: 151.99
Supporting reasons: Pullback resistance, marking a level where the price might encounter selling pressure if it attempts to rise.
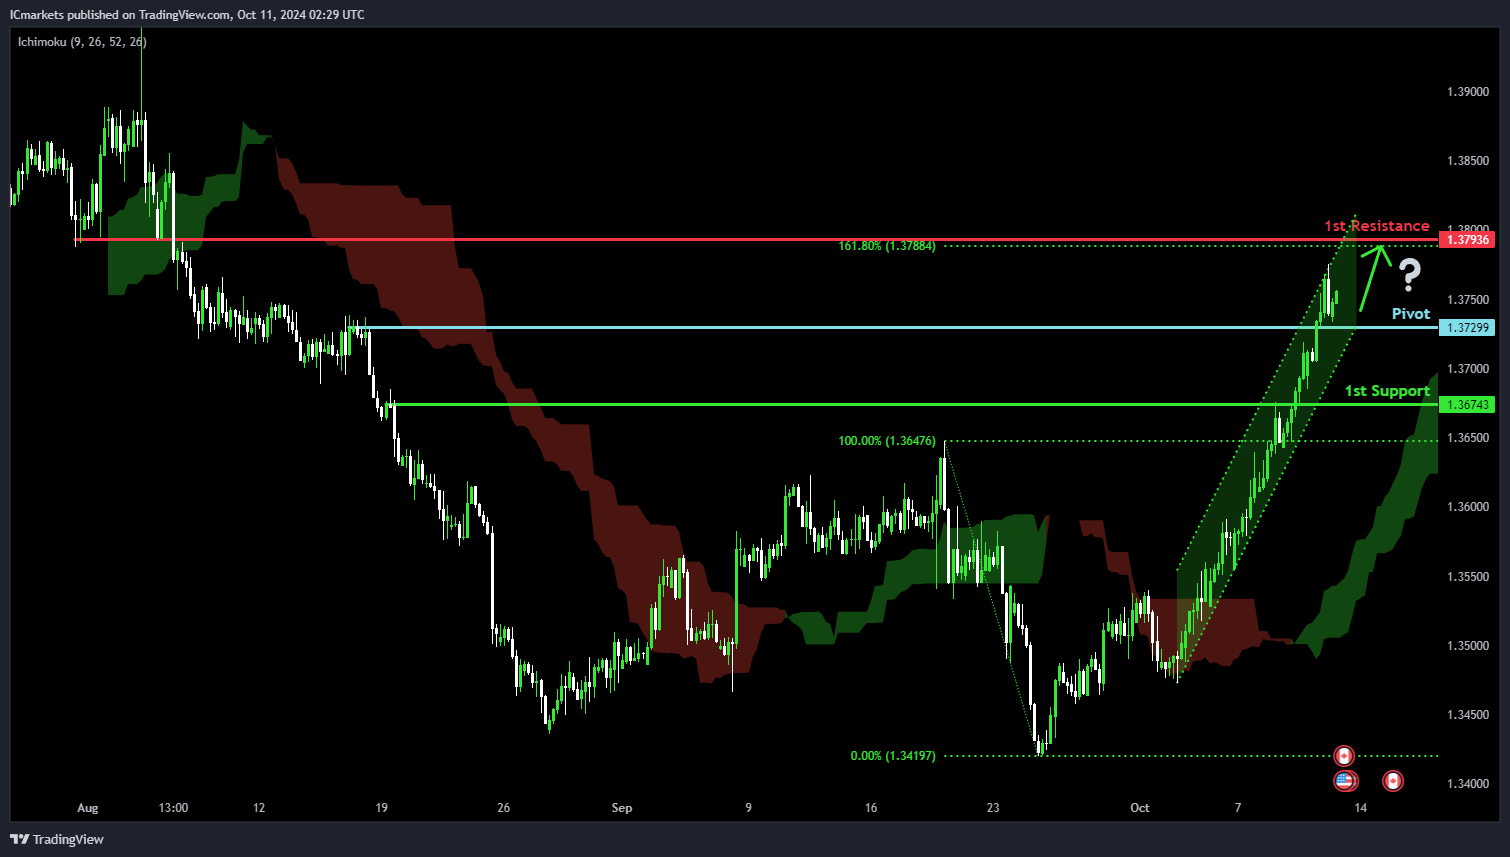
USD/CAD:
Potential Direction: Bullish
Overall momentum of the chart: Bullish
Price has made a bullish bounce off the pivot and could potentially rise towards the 1st resistance.
Pivot: 1.3729
Supporting reasons: Identified as a pullback support, indicating a potential level where buying interests could pick up to resume the uptrend.
1st support: 1.3674
Supporting reasons: Identified as a pullback support, indicating a key level where price could find support.
1st resistance: 1.3793
Supporting reasons: Identified as a pullback resistance that aligns close to a 161.8% Fibonacci extension, indicating a potential area that could halt any further upward movement.
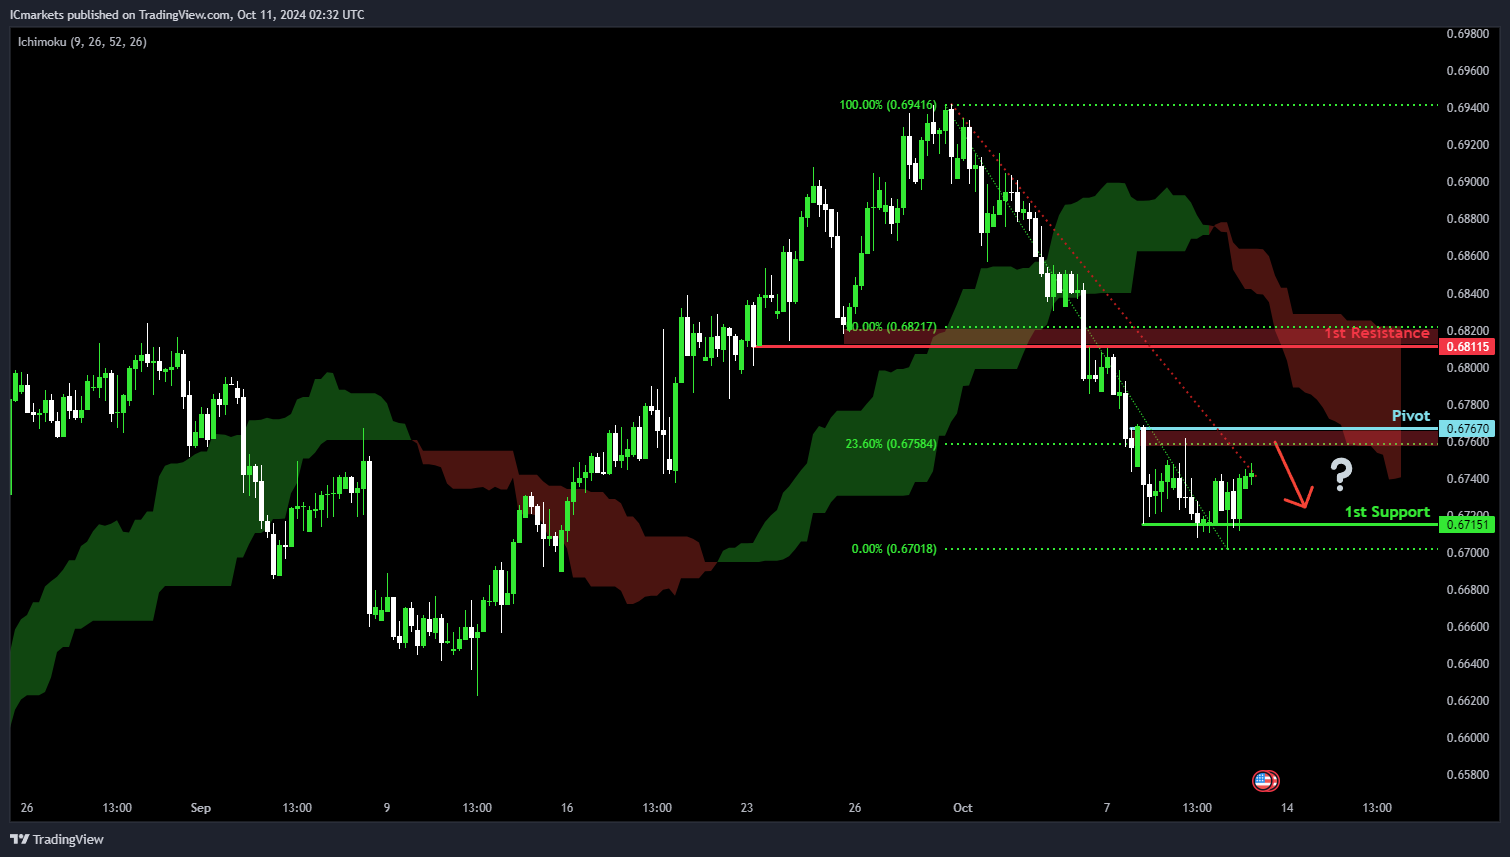
AUD/USD:
Potential Direction: Bearish
Overall momentum of the chart: Bearish
Price could rise towards the pivot and potentially make a bearish reversal off this level to fall towards the 1st support.
Pivot: 0.6767
Supporting reasons: Identified as pullback resistance that aligns close to a 23.6% Fibonacci retracement, indicating a potential level where selling pressures could intensify to resume the downtrend.
1st support: 0.6715
Supporting reasons: Identified as a multi-swing-low support, indicating a potential level where price could find support once more.
1st resistance: 0.6811
Supporting reasons: Identified as an overlap resistance that aligns close to a 50% Fibonacci retracement, indicating a potential area that could halt any further upward movement.
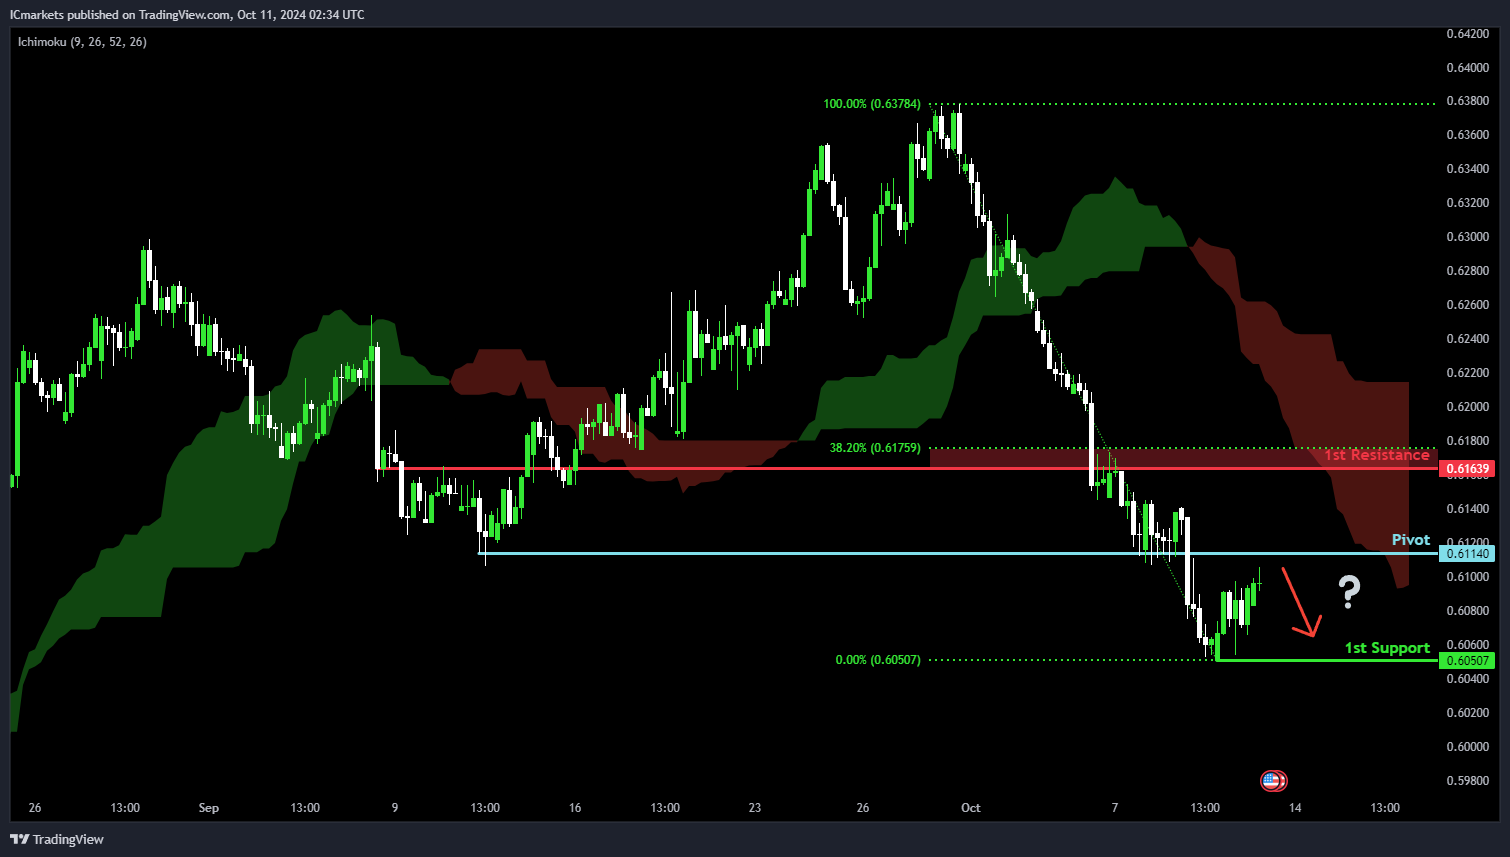
NZD/USD
Potential Direction: Bearish
Overall momentum of the chart: Bearish
Price could rise towards the pivot and potentially make a bearish reversal off this level to fall towards the 1st support.
Pivot: 0.6114
Supporting reasons: Identified as pullback resistance, indicating a potential level where selling pressures could intensify to resume the downtrend.
1st support: 0.6050
Supporting reasons: Identified as a swing-low support, indicating a potential level where price could find support once more.
1st resistance: 0.6163
Supporting reasons: Identified as an overlap resistance that aligns close to a 38.2% Fibonacci retracement, indicating a potential area that could halt any further upward movement.
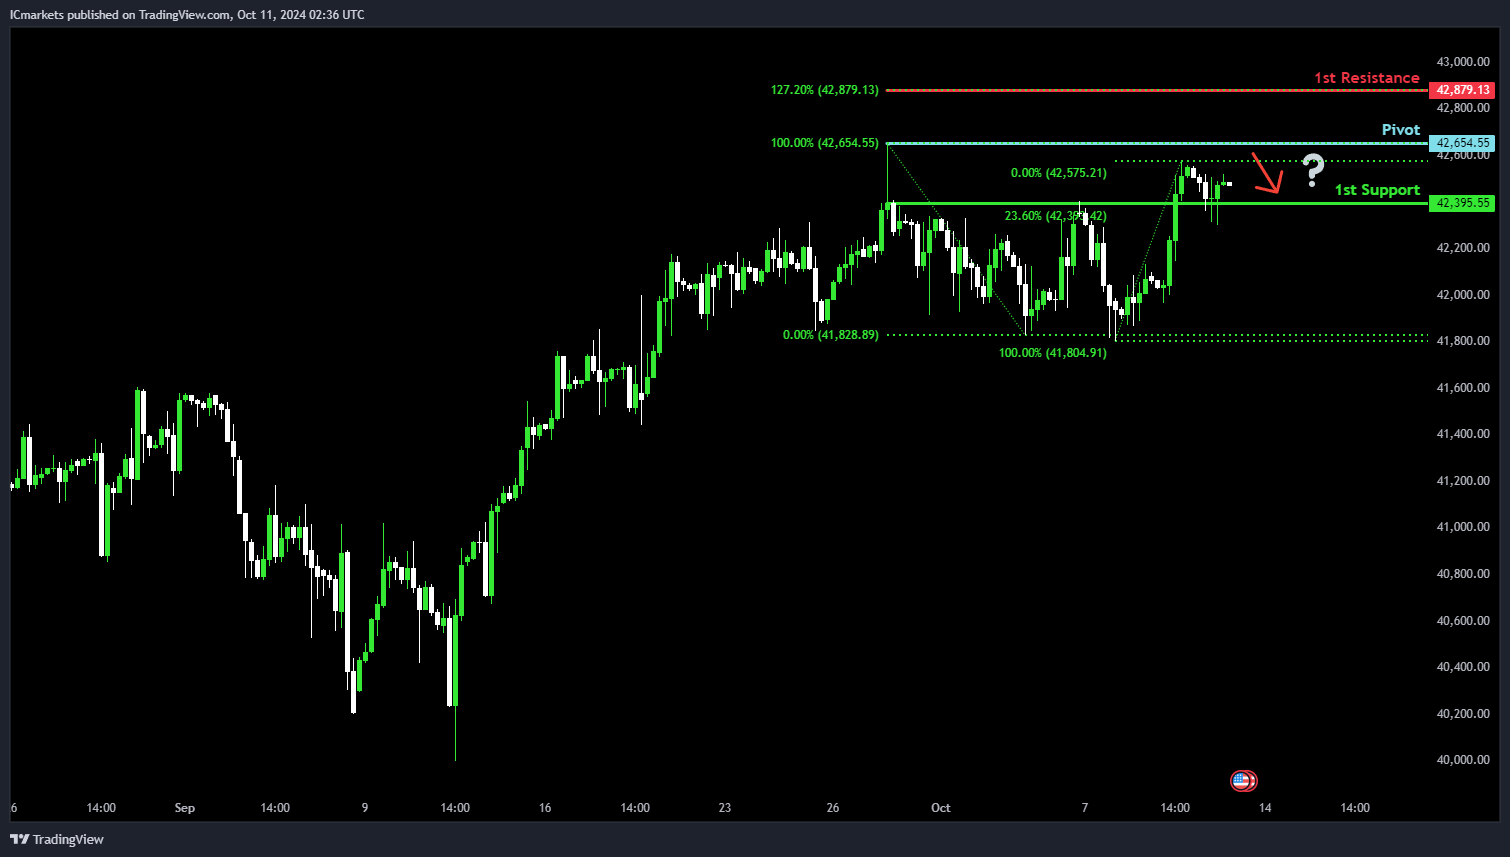
US30 (DJIA):
Potential Direction: Bearish
Overall momentum of the chart: Neutral
Price is rising towards the pivot and could potentially make a bearish reversal off this level to pull back towards the 1st support.
Pivot: 42,654.55
Supporting reasons: Identified as a swing-high resistance at the all-time high, suggesting a potential area where selling pressures could intensify.
1st support: 42,395.55
Supporting reasons: Identified as an overlap support that aligns with a 23.6% Fibonacci retracement,, indicating a potential level where price could find support once more.
1st resistance: 42,879.13
Supporting reasons: Identified as a resistance that aligns with a 127.2% Fibonacci extension, indicating a potential area that could halt any further upward movement.
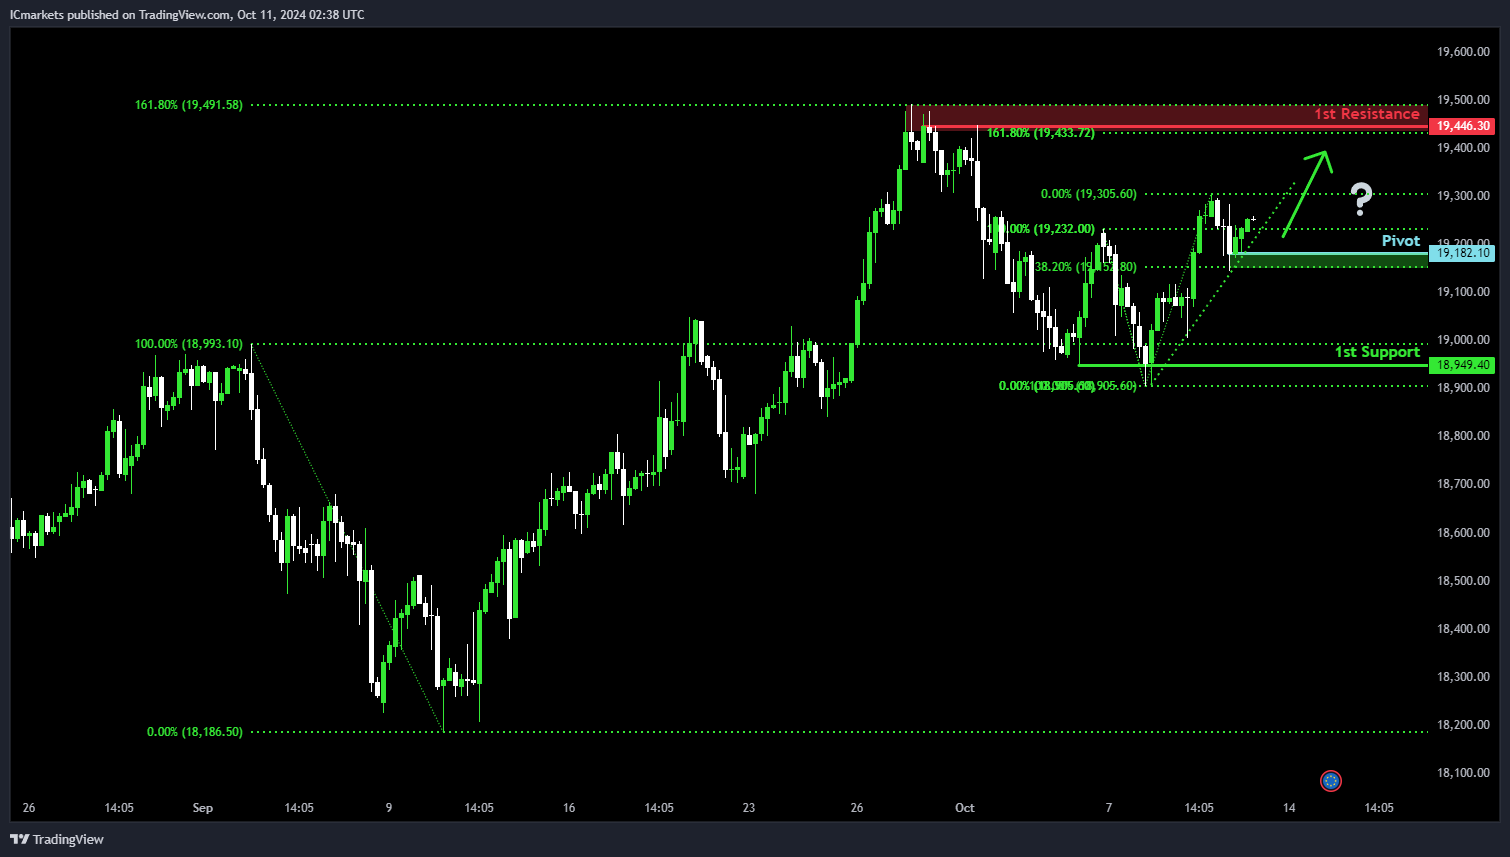
DE40 (DAX):
Potential Direction: Bullish
Overall momentum of the chart: Bullish
Price could fall towards the pivot and potentially make a bullish bounce off this level to rise towards the 1st resistance.
Pivot: 19,182.10
Supporting reasons: Identified as a pullback support that aligns close to a 38.2% Fibonacci retracement, suggesting a potential area where buying interests could pick up to resume the uptrend.
1st support: 18,949.40
Supporting reasons: Identified as a multi-swing-low support, indicating a key level where price could find support once again.
1st resistance: 19,446.30
Supporting reasons: Identified as a swing-high resistance that aligns with a confluence of Fibonacci levels i.e. two 161.8% Fibonacci extensions, indicating a potential area that could halt any further upward movement.
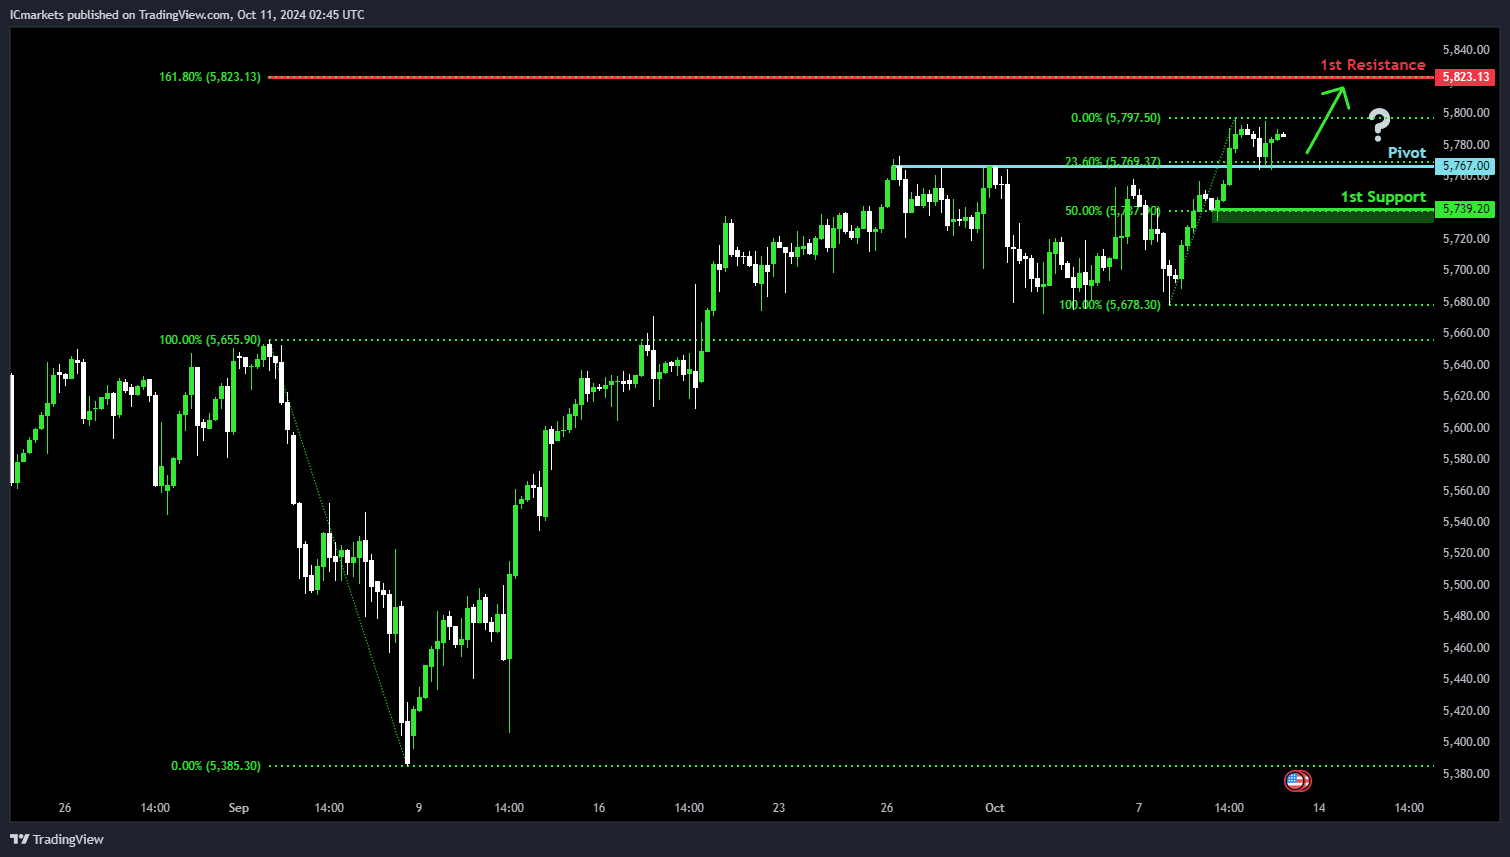
US500 (S&P 500):
Potential Direction: Bullish
Overall momentum of the chart: Neutral
Price is falling towards the pivot and could potentially make a bullish bounce off this level to rise towards the 1st resistance.
Pivot: 5,767.00
Supporting reasons: Identified as an overlap support that aligns with a 23.6% Fibonacci retracement, suggesting a potential area where buying interests could pick up to resume the uptrend.
1st support: 5,739.20
Supporting reasons: Identified as a pullback support that aligns with a 50.0% Fibonacci retracement, indicating a potential level where price could find support once more.
1st resistance: 5,823.13
Supporting reasons: Identified as a resistance that aligns with a 161.8% Fibonacci extension, indicating a potential area that could halt any further upward movement.
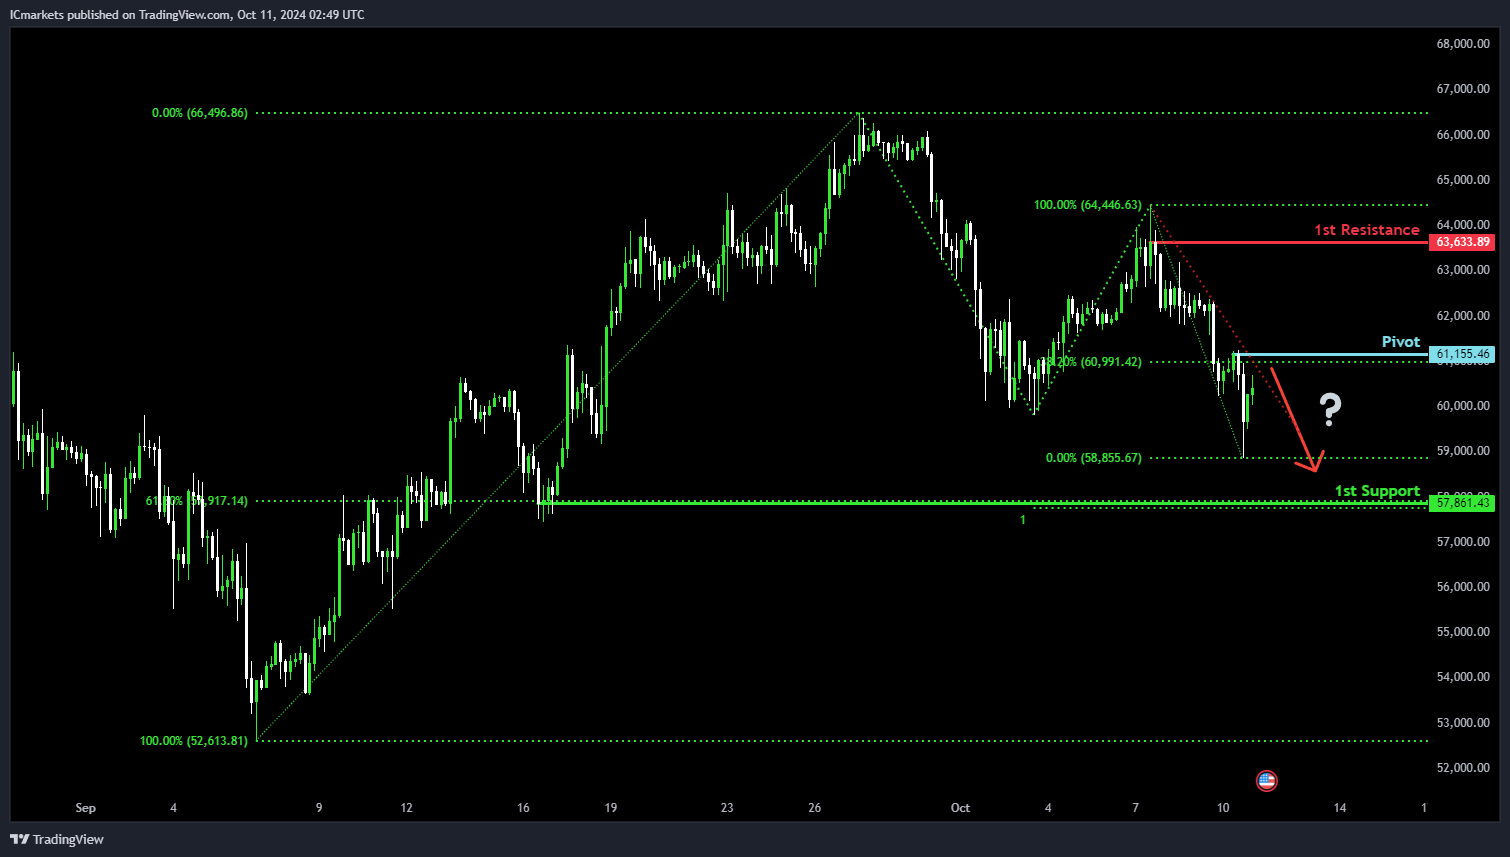
BTC/USD (Bitcoin):
Potential Direction: Bearish
Overall momentum of the chart: Bearish
Price could rise towards the pivot and potentially make a bearish reversal off this level to fall towards the 1st support.
Pivot: 61,155.46
Supporting reasons: Identified as a pullback resistance that aligns with a 38.2% Fibonacci retracement suggesting a potential area where selling pressures could intensify.
1st support: 57,861.43
Supporting reasons: Identified as a swing-low support that aligns with a 61.8% Fibonacci retracement, indicating a potential level where price could find support once more.
1st resistance: 63,633.89
Supporting reasons: Identified as a swing-high resistance, indicating a potential area that could halt any further upward movement.
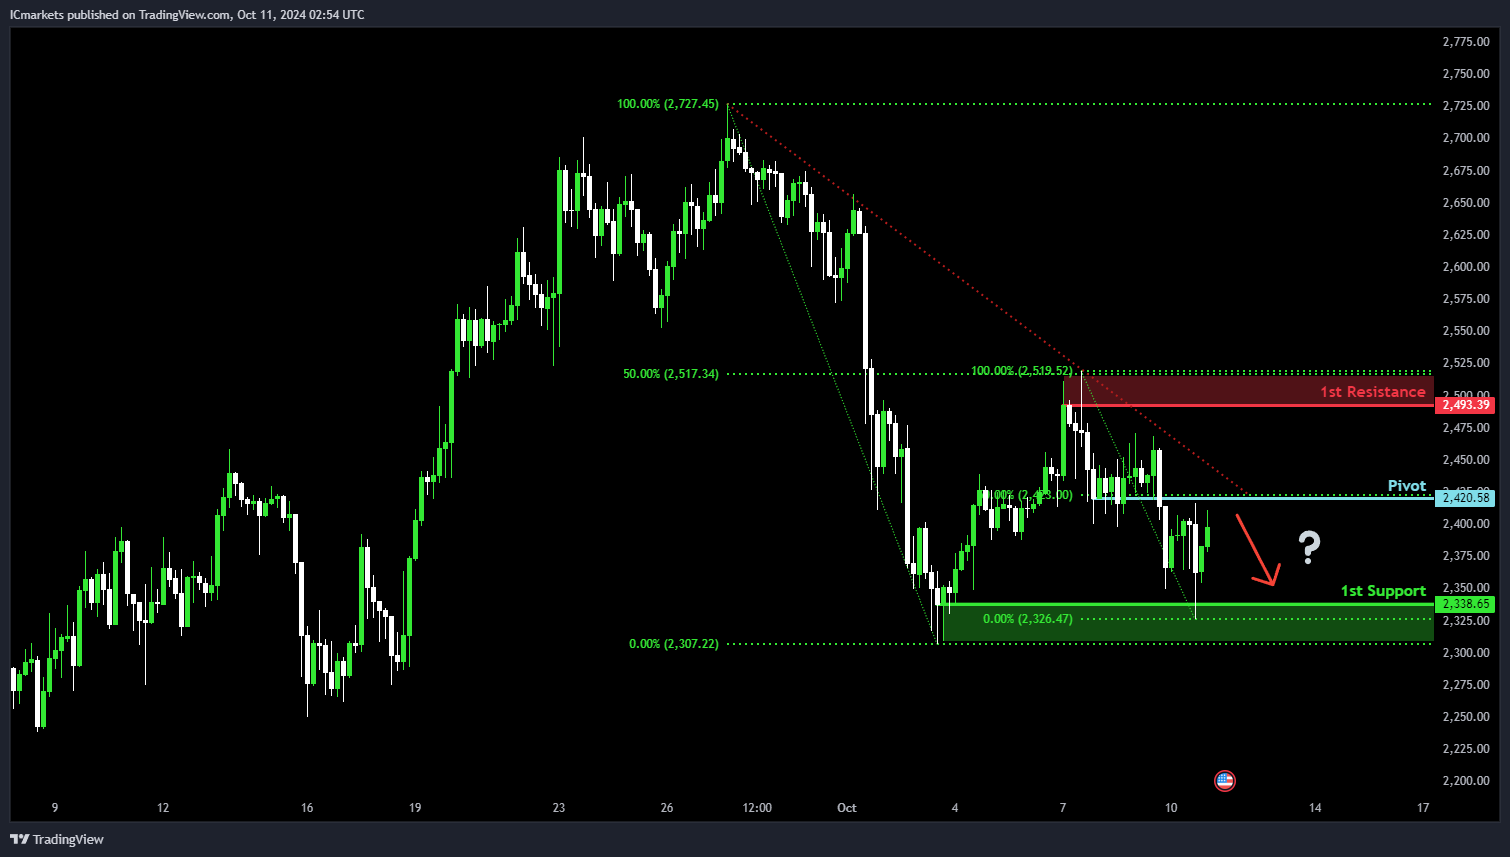
ETH/USD (Ethereum):
Potential Direction: Bearish
Overall momentum of the chart: Neutral
Price is rising towards the pivot and could potentially make a bearish reversal off this level to fall towards the 1st support.
Pivot: 2,420.58
Supporting reasons: Identified as an overlap resistance that aligns with a 50% Fibonacci retracement, suggesting a potential area where selling pressures could intensify.
1st support: 2,338.65
Supporting reasons: Identified as a swing-low support, indicating a potential level where price could find support once again.
1st resistance: 2,493.39
Supporting reasons: Identified as a pullback resistance that aligns close to a 50% Fibonacci retracement, indicating a potential area that could halt any further upward movement.
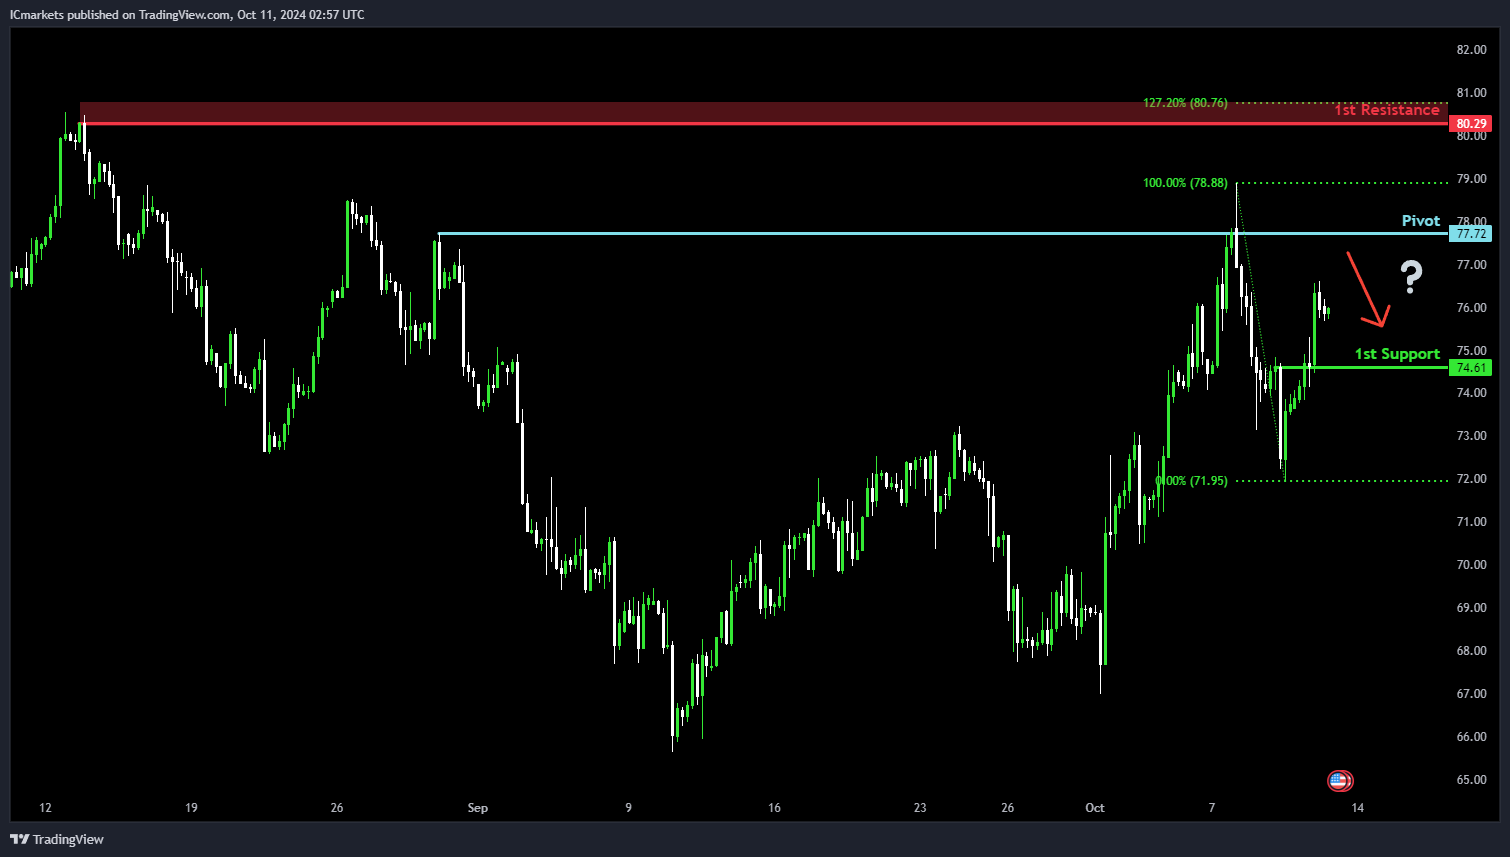
WTI/USD (Oil):
Potential Direction: Bearish
Overall momentum of the chart: Neutral
Price is rising towards the pivot and could potentially make a bearish reversal off this level to fall towards the 1st support.
Pivot: 77.72
Supporting reasons: Identified as a multi-swing-high resistance, suggesting a potential area where selling pressures could intensify.
1st support: 74.61
Supporting reasons: Identified as a pullback support, indicating a key level where price could find support.
1st resistance: 80.29
Supporting reasons: Identified as a swing-high resistance that aligns close to a 127.2% Fibonacci extension, indicating a potential area that could halt any further upward movement.
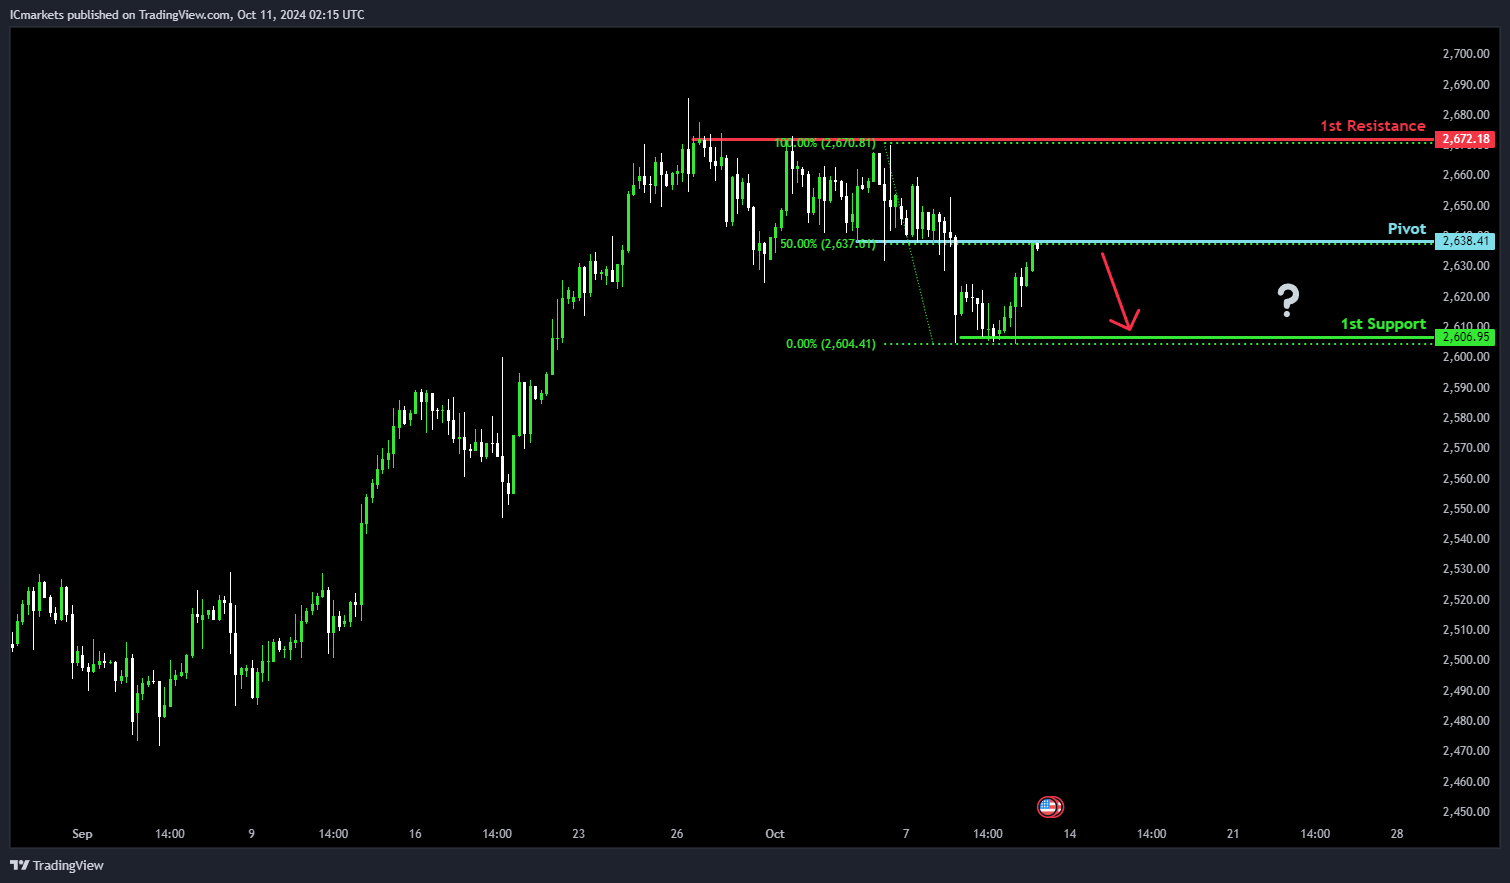
XAU/USD (GOLD):
Potential Direction: Bearish
Overall momentum of the chart: Bearish
Price could potentially make a: Bearish reaction off pivot and drop to 1st support.
Pivot: 2638.41
Supporting reasons: Pullback support with 50% Fibonacci Retracement, indicating this level may act as a significant support point.
1st support: 2606.95
Supporting reasons: Multi-swing low support, suggesting this level could provide strong support if the price declines.
1st resistance: 2672.18
Supporting reasons: Multi-swing high resistance, marking a level where the price might encounter selling pressure if it attempts to rise.
The accuracy, completeness and timeliness of the information contained on this site cannot be guaranteed. IC Markets does not warranty, guarantee or make any representations, or assume any liability regarding financial results based on the use of the information in the site.
News, views, opinions, recommendations and other information obtained from sources outside of www.icmarkets.com, used in this site are believed to be reliable, but we cannot guarantee their accuracy or completeness. All such information is subject to change at any time without notice. IC Markets assumes no responsibility for the content of any linked site.
The fact that such links may exist does not indicate approval or endorsement of any material contained on any linked site. IC Markets is not liable for any harm caused by the transmission, through accessing the services or information on this site, of a computer virus, or other computer code or programming device that might be used to access, delete, damage, disable, disrupt or otherwise impede in any manner, the operation of the site or of any user’s software, hardware, data or property.