Key risk events today:
(Cad) Gov Council Member Lane Speaks; US Retail Sales m/m and Core Retail Sales m/m; German Buba President Weidmann Speaks.
Market news brief (Thursday):
Australia unemployment ticked back up to 5.3% (expected: 5.2%). Headline employment contracted by -19.0k (expected: +16.2k).
(Destatis) In the third quarter of 2019, the price-adjusted gross domestic product in Germany increased by 0.1% on the second quarter of 2019, after adjustment for seasonal and calendar variations. Out of the UK, according to the Office for National Statistics, retail sales in October fell by -0.1% (market consensus: 0.2%).
The Producer Price Index for final demand increased 0.4% in October, seasonally adjusted, the US Bureau of Labour Statistics reported Thursday. Final demand prices fell 0.3% in September and edged up 0.1% in August.
Federal Reserve Chairman Powell’s remarks at his testimony to the House Budget committee echoed a similar vibe to the comments he gave to the Joint Economic Committee on Tuesday.
EUR/USD:
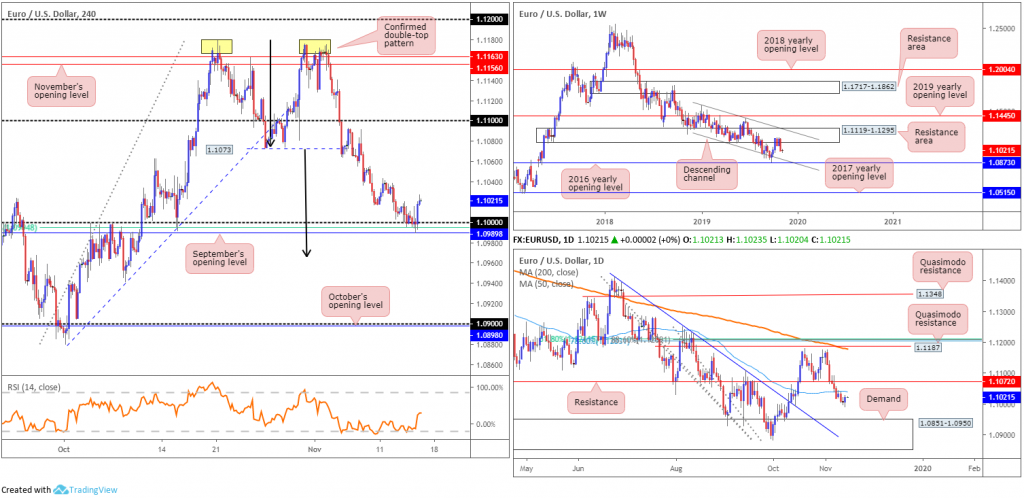
Shaped by way of a bullish outside day configuration, EUR/USD movement recovered in reasonably robust fashion Thursday. Data out of Germany came with an upbeat tone and markets largely shrugged off better-than-expected US PPI figures.
Support on the H4 timeframe, a combination of the key figure 1.10, September’s opening level at 1.0989 and a 61.8% Fibonacci retracement ratio at 1.0994, held price action higher yesterday. As a reminder, H4 action recently formed a distinct double-top pattern (peaks plotted at 1.1179/1.1175) after breaking the 1.1073 October 24 low (the confirmation point) on November 5. The double-top’s take-profit target falls in beneath 1.10 at 1.0965 (black arrows – measured by taking the value from the tallest peak and adding this to the breakout point).
On more of a broader perspective, daily price concluded Thursday by way of a bullish outside day candlestick formation, poised to potentially retest the underside of the 50-day SMA (blue – 1.1039), and perhaps shake hands with resistance set close by at 1.1072. On the weekly timeframe, although price remains unchanged on the week, the unit reflects a bearish tone out of a long-standing resistance area drawn from 1.1119-1.1295. Increased selling has the lower boundary of a descending channel to target (extended from the low 1.1109), set a few points north of the 2016 yearly opening level at 1.0873. Concerning trend direction, the primary downtrend has been in motion since topping in early 2018 at 1.2555.
Areas of consideration:
Recent buying off 1.10 is questionable. Although a valid support in its own right, higher-timeframe charts exhibit a downbeat tone which is likely to weigh on buyers. With the possibility of a move forming to daily demand plotted at 1.0950, which happens to converge closely with the H4 double-top’s take-profit target, it’s unlikely buyers will attempt to extend higher today, technically speaking.
GBP/USD:
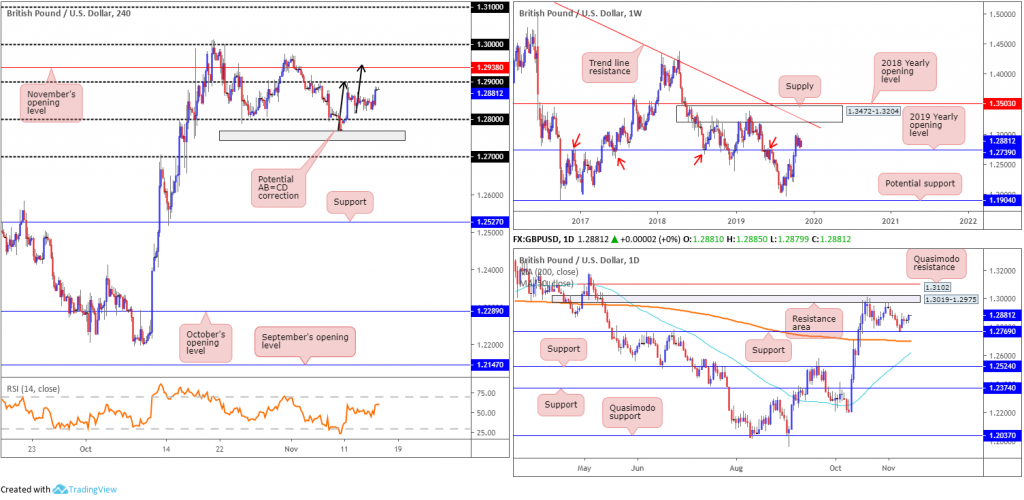
Largely benefitting from a decline in the US dollar, GBP/USD explored higher ground Thursday and topped a few points south of the 1.29 handle. November’s opening level resides at 1.2938 as potential resistance north of here, falling in closely with a possible AB=CD correction at 1.2950 (black arrows). Higher up on the curve, the key figure 1.30 is visible, which capped upside in October. Beneath 1.28, nonetheless, weekly support inhabits the 1.2739 region and daily support falls in at 1.2769 (grey zone on the H4 scale).
Upside on the daily timeframe, as mentioned in Thursday’s technical briefing, could rally as far north as a resistance area plotted at 1.3019-1.2975, followed closely by Quasimodo resistance at 1.3102, while a break of support mentioned above at 1.2769 has immediate support by way of the 200-day SMA (orange – 1.2699) in sight. It may also interest some traders to note the 50-day SMA (blue – 1.2618) has been advancing since early October, suggesting a possible cross above the 200-day SMA may be on the horizon (a Golden Cross).
Weekly price, as emphasised above, has support at 1.2739, with a run north from here targeting supply coming in at 1.3472-1.3204, as well as a long-term trend line resistance extended from the high 1.5930.
Areas of consideration:
An upside break of 1.29 today could draw in November’s opening level at 1.2938 and the AB=CD completion. This combination is likely to entice selling, though whether it’ll be sufficient to push back through 1.29 is questionable. A close back beneath 1.29 may, therefore, offer a sell signal.
Entering long above 1.29 is chancy, given nearby resistance. The case against longs is further strengthened seeing as we also have a daily resistance area set at 1.3019-1.2975 and the key figure 1.30.
Additional longs may also be a worthy contender should the market retest the 1.28 region, or the noted weekly and daily supports (grey area) sited a touch lower. However, it is unlikely this will come about today.
AUD/USD:
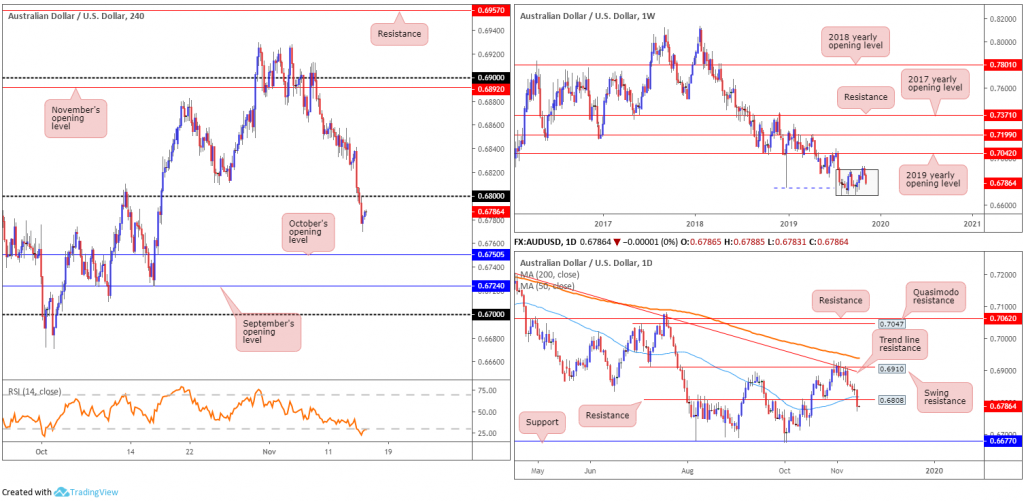
The Australian dollar subsided against the US dollar in early movement Thursday, weighed by less-than-stellar job’s data out of Australia. The day concluded with a decisive break of 0.68 to the downside, consequently nudging through sell stops and reaching lows as far south as 0.6769. Though a minor recovery was observed into the close, which could inspire a retest of 0.68 today, October’s opening level on the H4 scale is likely the next port of call in terms of support at 0.6750, followed by September’s opening level at 0.6724.
With reference to the bigger picture, the recent two-candle fakeout on the weekly timeframe at the top edge of a 3-month long consolidation zone between 0.6894/0.6677 (light grey) is seen forcing price back into its range. The primary downtrend in this market also remains bearish.
In conjunction with weekly flow, daily price dethroned its 50-day SMA (blue – 0.6815) and support at 0.6808 yesterday. Going forward, price may find support off 0.6758, though the more visible ‘floor’ on the daily timeframe falls in around 0.6677.
Areas of consideration:
Seeing weekly price descending back into its range and daily price conquering two layers of support, sellers clearly appear to have the upper hand right now. A retest at 0.68 today, therefore, might be an idea worthy of exploring for shorts. Conservative traders may opt to wait for a H4 bearish candlestick pattern to form before pulling the trigger. Round numbers tend to attract whipsaws; by waiting for additional candlestick confirmation, seller intent is identified and entry and risk levels are clearly defined.
USD/JPY:
USD/JPY movement extended its losing streak Thursday, erasing more than 0.38% and elbowing to lows at 108.24. The US dollar index, or DXY, continues to languish sub 98.50, poised to approach 98.00, and the 10-year US Treasury yield fell to 1.823%.
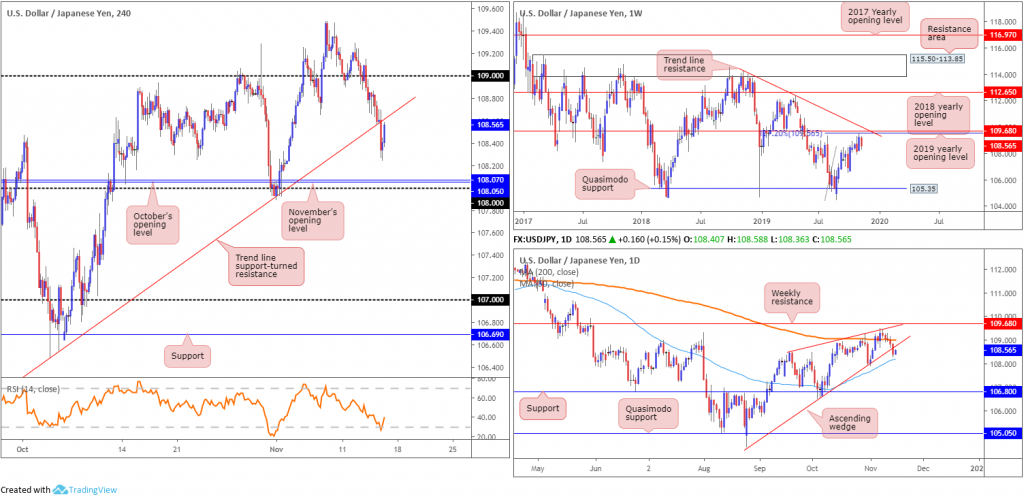
Kicking things off from the top this morning, the weekly timeframe reveals USD/JPY boasts clear resistance stationed at 109.68, as well as a 127.2% Fibonacci ext. at 109.56. Last week saw the unit come within 8 points of connecting with 109.56, which appears to have spurred a wave of selling this week.
Moving things down a notch, daily price recently tunnelled through the lower edge of an ascending wedge formation (104.44), which has been unfolding since early September. Support on the daily timeframe can be found close by at the 50-day SMA (blue – 108.20). A break of here and the 107.88 November 1 low could see a run back towards support at 106.80.
Essentially representing the lower edge of the ascending wedge on the daily timeframe, H4 action pushed through trend line support (104.44) yesterday and is on course to be retested as resistance in Asia. Given the break lower on the weekly and daily timeframes, a retest of this ascending line may offer a platform for sellers today, targeting the 108 handle and November and October’s opening levels at 108.05 and 108.07, respectively.
Areas of consideration:
A rejection off the said H4 trend line support-turned resistance in the form of a H4 bearish candlestick formation would likely be recognised as a strong cue to push lower. Entry and risk can be applied according to the selected candlestick pattern. This should offer ample room to reduce risk to breakeven before 108 enters the fold.
USD/CAD:
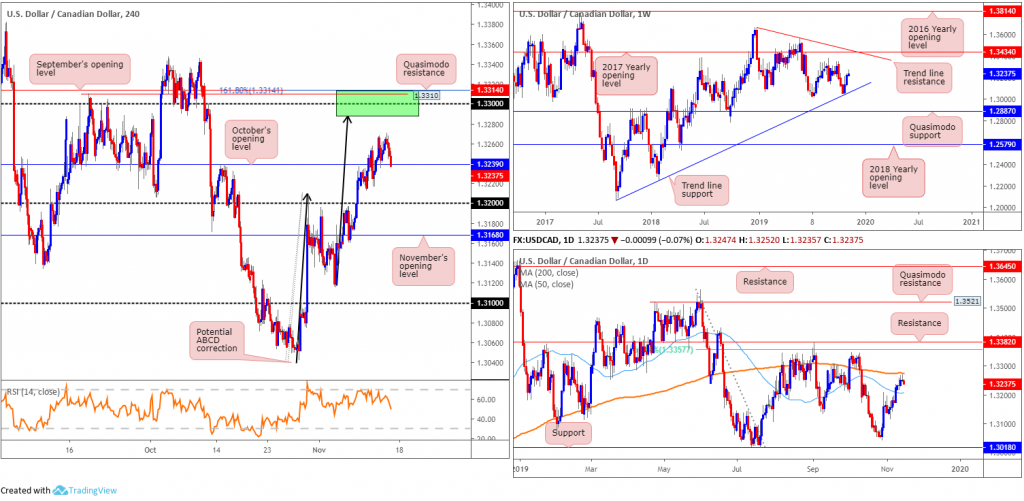
Energy inventory data, released on a weekly basis, showed a larger-than-expected 2.2mln build in headline crude stocks vs. +1.4mln expected, consequently sending oil prices marginally lower. USD/CAD action wrapped up Thursday mostly unchanged, though in recent hours sellers took over and are retesting October’s opening level at 1.3239 on the H4 timeframe.
As underlined in recent reports, limited resistance is visible until reaching 1.33 on the H4 scale. Supporting 1.33 as a resistance area, we have a potential ABCD correction (black arrows) terminating at 1.3287, a 161.8% Fibonacci ext. point at 1.3314, Quasimodo resistance at 1.3310 and September’s opening level at 1.3314 (green). In addition, the 200-day SMA (orange – 1.3275) is seen lurking just south of this zone. Note on the daily timeframe, Thursday concluded in the form of a shooting star candlestick pattern (considered a bearish signal).
Technical research on the weekly timeframe remains unchanged, exhibiting a bullish presence as buyers extend the recovery off trend line support (taken from the low 1.2061). Additional upside from this point has tops around 1.3342 in sight, closely followed by the 2017 yearly opening level at 1.3434 and trend line resistance taken from the peak at 1.3661. Overall, the immediate trend faces north since bottoming in September 2017, though this move could also be considered a deep pullback in a larger downtrend from the 1.4689 peak in early January 2016.
Areas of consideration:
Outlook unchanged.
Should 1.3239 hold ground as support, an intraday long from here is possible, targeting 1.3314/1.3287 on the H4 timeframe.
Not only is 1.3314/1.3287 a possible target zone for longs, it also forms an area of resistance for potential shorts. With weekly buyers threatening a move higher, though, traders may wish to wait and see how H4 action behaves before committing funds to a position. This could be something as simple as waiting for a bearish candlestick pattern to emerge, or a lower-timeframe trend line break, for example.
USD/CHF:
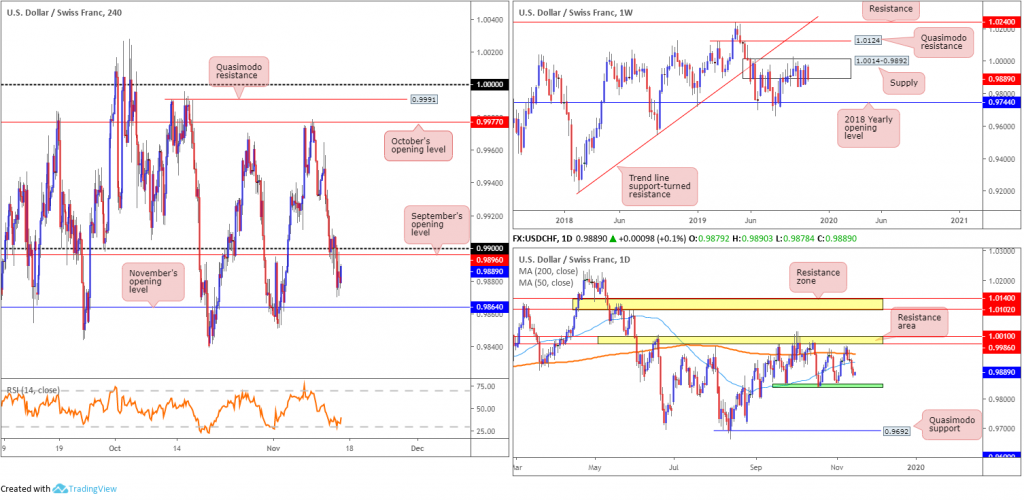
USD/CHF eased Thursday for a fourth successive close, broadening the gap beneath the 200-day SMA (blue – 0.9923). Selling also pulled H4 price sub 0.99 and below September’s opening level at 0.9896, which, as you can see, has been retested as resistance. November’s opening level at 0.9864 offers nearby support, followed by 0.9845ish on the daily timeframe marked in green.
Supply at 1.0014-0.9892 sited on the weekly timeframe remains in play. As mentioned in previous reports, the beginning of October witnessed a penetration to the outer edge of the supply area’s limit, possibly tripping a portion of buy stops and weakening sellers. An upside move out of the said supply may draw in Quasimodo resistance at 1.0124, while downside has the 2018 yearly opening level at 0.9744 in sight. According to the primary trend, price also reflects a slightly bullish tone; however, do remain aware we have been rangebound since the later part of 2015 (0.9444/1.0240).
Areas of consideration:
0.99 shines bright as a potential sell zone this morning, targeting November’s opening level at 0.9864 and 0.9845 on the daily scale. The fact daily price shows room to press lower and weekly price inhabits a supply base certainly adds weight to shorts.
Selling psychological figures, however, is not without risk. Round numbers tend to attract fakeouts – commonly referred to as stop runs. For that reason, some traders wait and see if price action delivers a sign of seller strength before committing; this could be as simple as a bearish candlestick configuration or basing an entry on lower-timeframe structure.
Dow Jones Industrial Average:
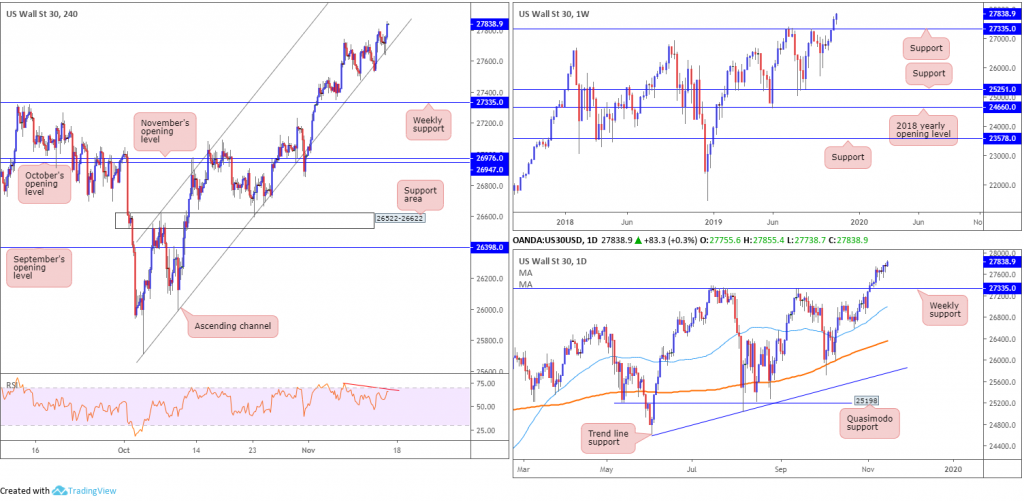
Major US benchmarks wrapped up mixed Thursday amid varied economic data and mounting concern over a partial trade deal between the US and China. The Dow Jones ended flat; the S&P 500 advanced 2.59 points, or 0.08% and the tech-heavy Nasdaq 100 declined 1.98 points, or 0.02%.
In recent hours, however, the Dow navigated higher ground, clocking fresh all-time highs of 27855. The move followed a clear-cut H4 hammer candlestick formation (considered a bullish signal at troughs) off channel support extended from the low 25710. Despite this, indicator-based traders may wish to note the relative strength index (RSI) is producing bearish divergence (red line).
Areas of consideration:
For traders who read Thursday’s technical briefing may recall the following piece:
Another retest of the H4 channel support today, preferably in the shape of a H4 bullish candlestick pattern, will be of interest to buyers, given the recent all-time high.
Well done to any readers who managed to jump onboard the recent pop higher. Waiting for H4 price to form a fresh trough before reducing risk to breakeven might be an idea going forward. Following this, trailing the position behind subsequent troughs is an option.
XAU/USD (GOLD):
Bullion added a third successive close higher Thursday vs. the US dollar, though gold’s days in the sun may soon come to an end, according to chart studies.
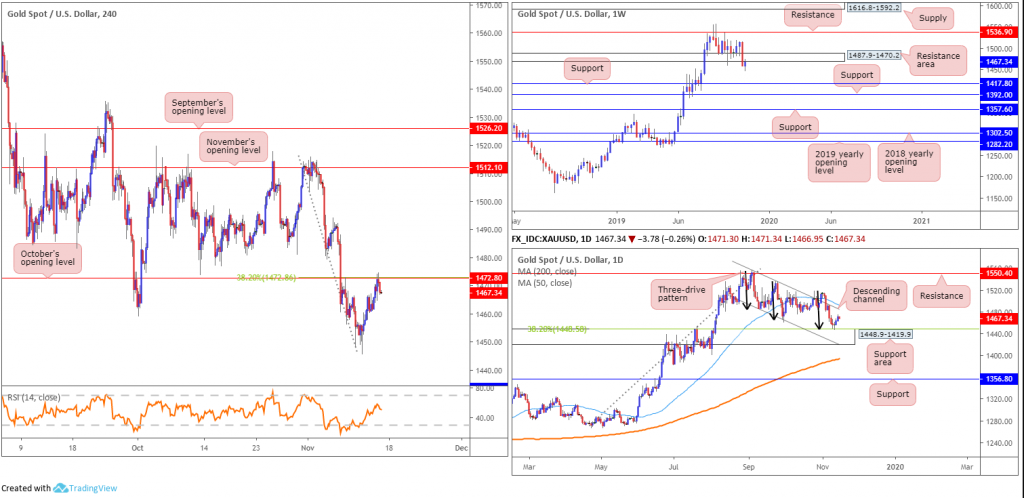
Weekly price is seen crossing paths with the underside of a significant resistance area at 1487.9-1470.2, suggesting a continuation lower may be on the cards, targeting supports coming in at 1392.0 and 1417.8. The problem arises when considering the daily timeframe. The beginning of the week saw daily price cross swords with the top edge of a support area coming in at 1448.9-1419.9 (aligns closely with a 38.2% Fibonacci retracement ratio at 1448.5). What’s also interesting here is the completion of a three-drive pattern around the top edge of the said support zone (black arrows).
Across the page on the H4 timeframe, as expected, the candles retested October’s opening level at 1472.8, which aligns with a 38.2% Fibonacci retracement ratio. The recent H4 candle close lower from here is significant and likely enough to draw in further selling today for a possible revisit of the daily support area mentioned above at 1448.9-1419.9.
Areas of consideration:
Keeping things simple this morning, a short at current price is certainly an idea, with the option of positioning protective stop-loss orders above the current weekly resistance area at 1487.9. The top edge of the daily support area at 1448.9-1419.9 can be considered the initial downside target.
The accuracy, completeness and timeliness of the information contained on this site cannot be guaranteed. IC Markets does not warranty, guarantee or make any representations, or assume any liability regarding financial results based on the use of the information in the site.
News, views, opinions, recommendations and other information obtained from sources outside of www.icmarkets.com.au, used in this site are believed to be reliable, but we cannot guarantee their accuracy or completeness. All such information is subject to change at any time without notice. IC Markets assumes no responsibility for the content of any linked site.
The fact that such links may exist does not indicate approval or endorsement of any material contained on any linked site. IC Markets is not liable for any harm caused by the transmission, through accessing the services or information on this site, of a computer virus, or other computer code or programming device that might be used to access, delete, damage, disable, disrupt or otherwise impede in any manner, the operation of the site or of any user’s software, hardware, data or property.

