Key risk events:
MPC Member Saunders Speaks; US Core Durable Goods Orders m/m; US Personal Spending m/m; US Core PCE Price Index m/m; US Durable Goods Orders m/m; FOMC Member Quarles Speaks.
EUR/USD:
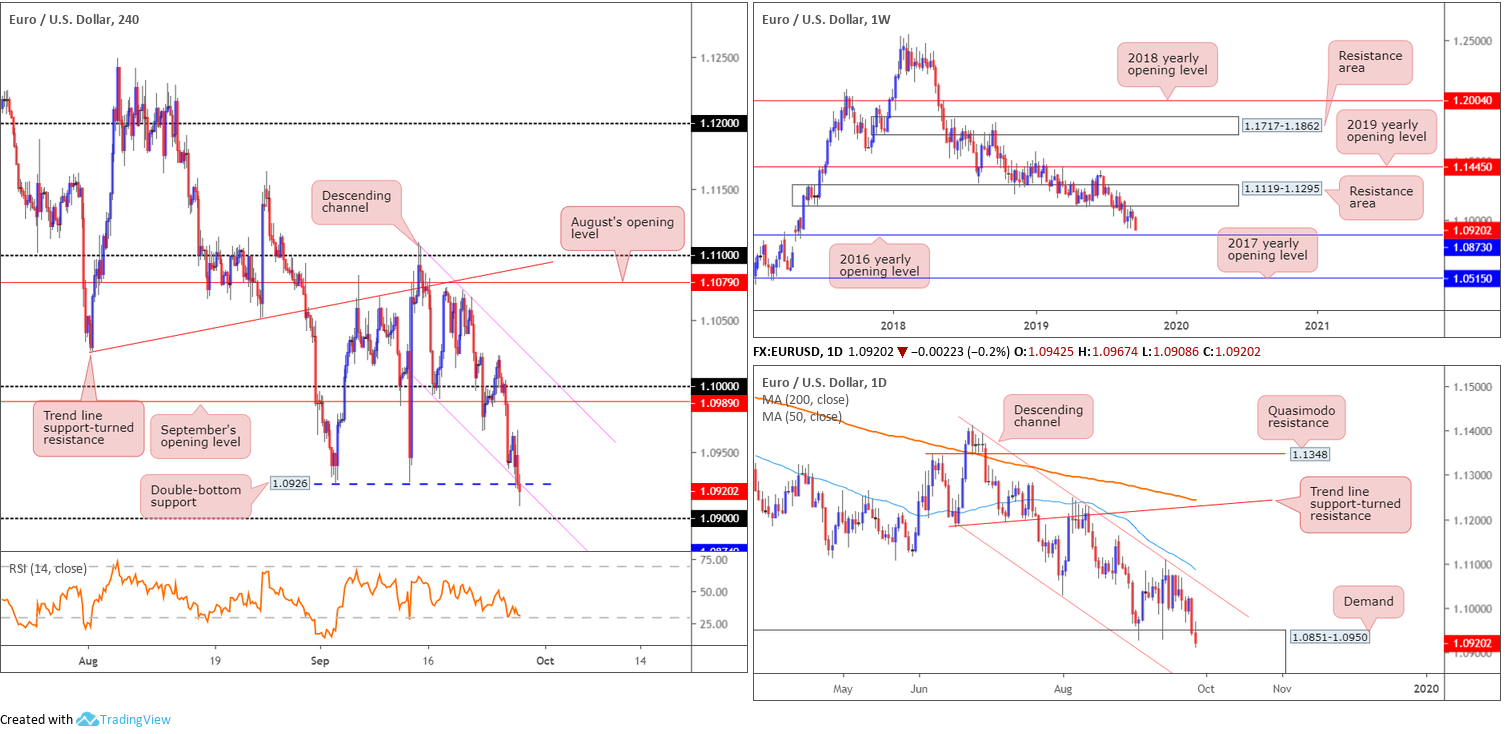
Despite encouraging Eurozone data – German GFK survey printed 9.9, better than the expected 9.7 – the euro clocked fresh multi-year lows at 1.0908 Thursday, amid tenacious dollar bidding. The US dollar index, calculated by factoring in the exchange rates of six major world currencies, toppled its 99.00 mark and is now poised to approach weekly resistance priced in at 99.62.
Medium-term technical research has H4 movement eyeing a test of its 1.09 handle, following a break of channel support etched from the low 1.0993 and a double-bottom support formation at 1.0926. Thursday’s technical briefing highlighted this combination as a potential buy zone – area offered a 40-point move to highs of 1.0967. Beneath 1.09, Quasimodo support resides close by at 1.0874 (not visible on the screen).
Against the backdrop of medium-term flow, higher-timeframe structure reveals weekly support priced in the form of the 2016 yearly opening level at 1.0873 is now within reach. Note this level carries strong historical significance. The story on the daily timeframe, however, has price action burrowing through demand at 1.0851-1.0950, which happens to house the said 2016 yearly opening level within its lower limits. Also worthy of note is the daily candles have remained compressing within a descending channel formation since late June (1.1412/1.1026).
Areas of consideration:
With well-placed weekly support at 1.0873 in sight, together with daily action testing demand, the H4 Quasimodo support level highlighted above at 1.0874 is likely of interest for longs today/possibly early next week.
The key observation here, aside from clear-cut higher-timeframe confluence, is the psychological number 1.09. This figure naturally entices stop-loss orders, which, in this situation, are asking to be filled. The break of 1.09 will fill sell stops, both from traders with long orders at 1.09 and those attempting to sell the breakout, therefore providing liquidity for traders long out of 1.0874. Traders likely eye 1.0874 as an entry point, with protective stop-loss placement eyed beneath the low of the Quasimodo formation at 1.0839 (see May 2017).
GBP/USD:
The British pound ceded further ground to the buck Thursday, extending Wednesday’s precipitous 1.14% decline amid ongoing Brexit uncertainties and USD strength.
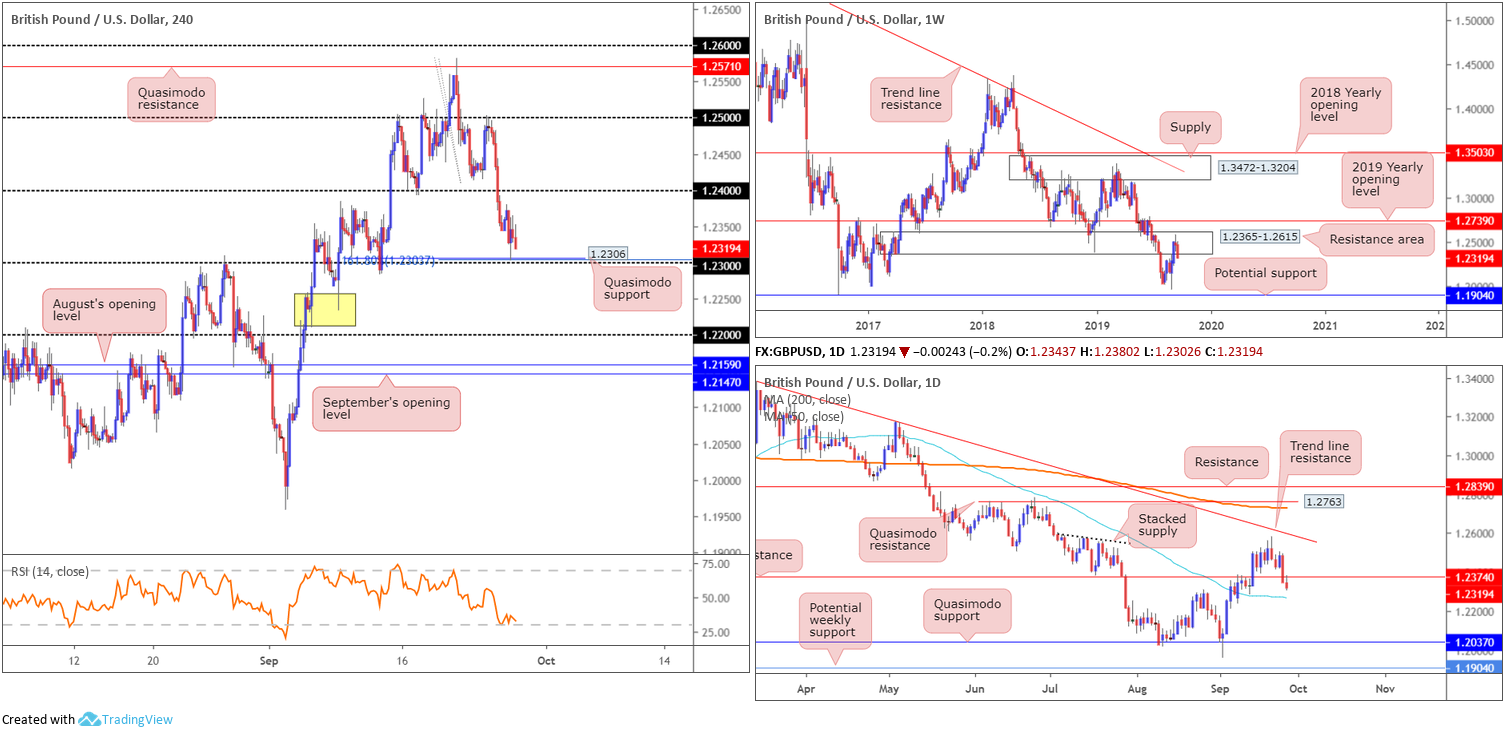
Following on from Thursday’s technical briefing we can see combined H4 support, comprised of the round number 1.23, a Quasimodo support at 1.2306 and a 161.8% Fibonacci ext. point at 1.2303, capped downside and produced a 60-point plus swing to the upside. The problem with entering long here is we have daily support-turned resistance at 1.2374 and we’re exiting a major weekly resistance area found at 1.2365-1.2615.
With buyers appearing to dwindle off the 1.23 region, a break of this figure could be on the cards today. This potentially sets the stage for a run to the 50-day SMA (blue – 1.2266) on the daily timeframe, followed perhaps by the 1.22 angle. The H4 demand marked in yellow at 1.2230/1.2256 is in a vulnerable position, according to our chart studies, given 1.22 will likely act as a magnet to price.
Areas of consideration:
Having both weekly and daily timeframes suggest further downside, traders may find use in a break of 1.23. A close beneath this number followed up with a retest, preferably by way of a H4 bearish candlestick signal (entry and risk can then be determined according to this pattern), will potentially appeal to sellers, targeting the 50-day SMA, with a break of this region likely clearing the pathway to 1.22.
AUD/USD:
The Australian dollar recognised a firm bid Thursday, climbing higher against the US dollar amid a risk-on environment during London’s session. Ahead of US trade, momentum paused (common viewing) and price turned lower in US hours, consequently reclaiming gains and wrapping up the session in mildly negative territory.
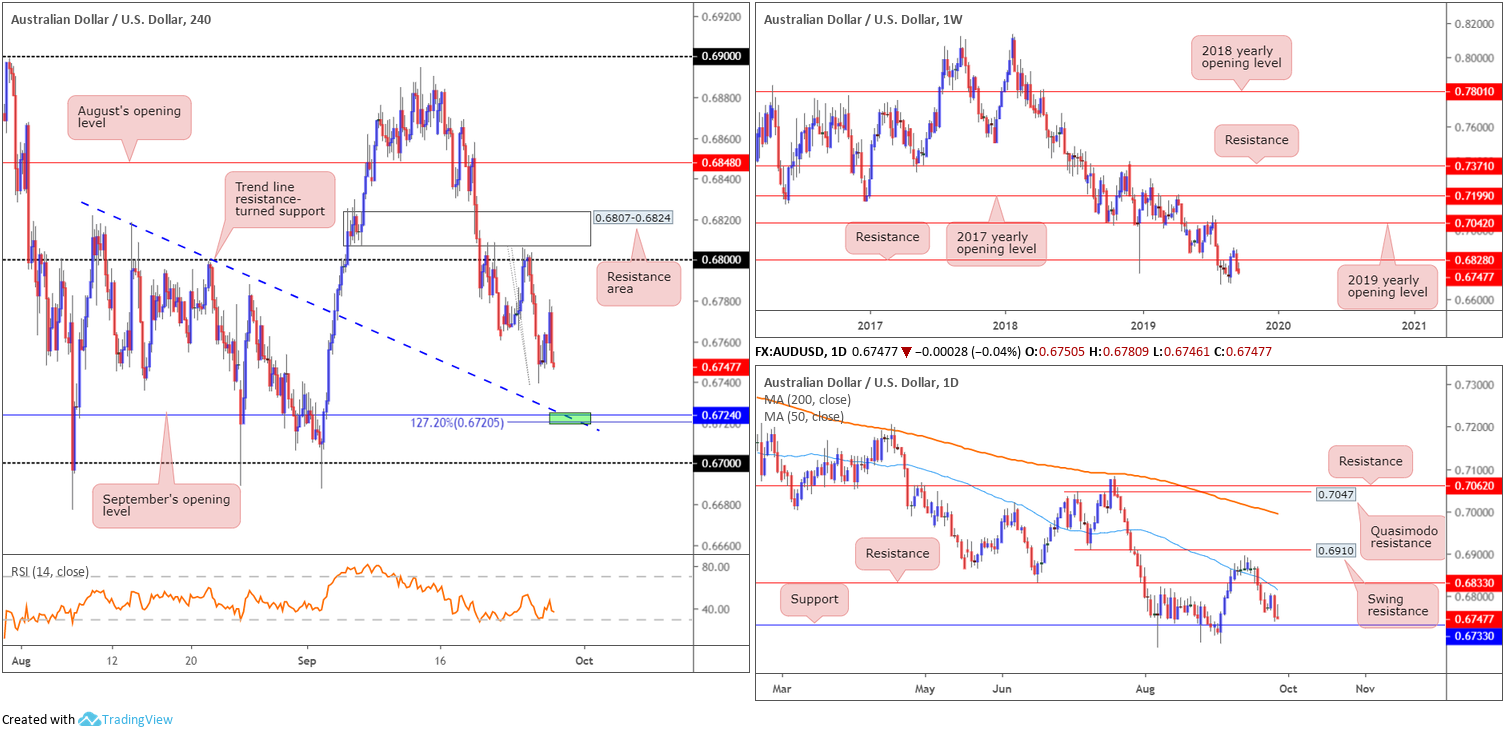
Technical research on the H4 timeframe has September’s opening level at 0.6724 on the radar today as potential support. Intersecting closely with a trend line resistance-turned support (taken from the high 0.6818) and a 127.2% Fibonacci extension point at 0.6720, the chances of a reaction forming off here is high. In addition to H4 confluence, daily support resides just north of the 0.6724 region at 0.6733.
Areas of consideration:
Traders who remain short this market from the 0.68 region (a noted resistance in previous reports) likely have their radar fixed on 0.6733 as the initial downside target: daily support, closely followed by September’s opening level at 0.6724.
Should the H4 candles test 0.6724, not only will this likely be considered a take-profit zone, active buyers may potentially look to long this market from here. For that reason, keep eyes on this area today for signs of buying, preferably in the form of a bullish candlestick formation (traders then have the option of calculating entry and risk based on this structure).
USD/JPY:
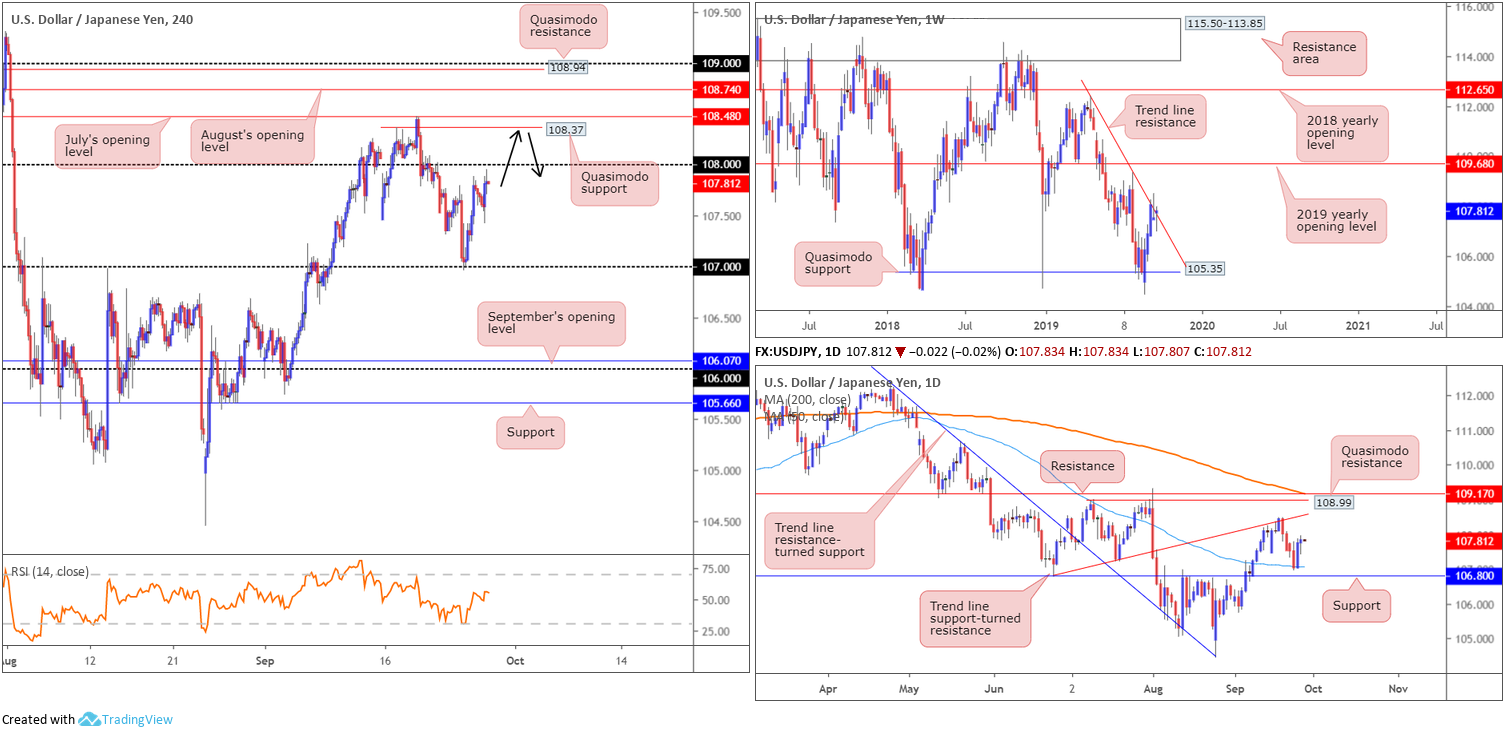
The US dollar concluded Thursday a shade higher against the Japanese yen, delivering the H4 candles just south of the 108 handle. Beyond 108, traders’ crosshairs are likely fixed on the Quasimodo resistance level coming in at 108.37. Technical structure in this market remains unchanged as we head into Asia Pac hours, therefore much of the following analysis will resemble thoughts put forward in Thursday’s briefing.
Higher-timeframe flow shows support recently entered in the form of the 50-day SMA (blue – 107.04), which, on the daily scale, may call for a run back up to trend line support-turned resistance (taken from the low 106.78). The interesting thing is weekly price remains trading around trend line resistance extended from the high 112.40, though is struggling to chalk up anything fresh to the downside.
Areas of consideration:
Buy stops above 108, both from traders attempting to short the figure and those attempting to long any breakout, are likely of interest this morning for a possible short off H4 Quasimodo resistance at 108.37. This is also based on the fact the market remains toying with trend line resistance on the weekly timeframe.
Entry at 108.37 is an option, with a protective stop-loss order positioned either above July or August’s opening levels at 108.48 and 108.74, respectively, dependent on risk appetite. Downside expectation falls on a break back beneath 108: a cue to think about reducing risk to breakeven and liquidating a portion of the position.
USD/CAD:
USD/CAD prices head into Asia Pac hours unmoved. With that being the case, the following report will air points highlighted in Thursday’s technical briefing.
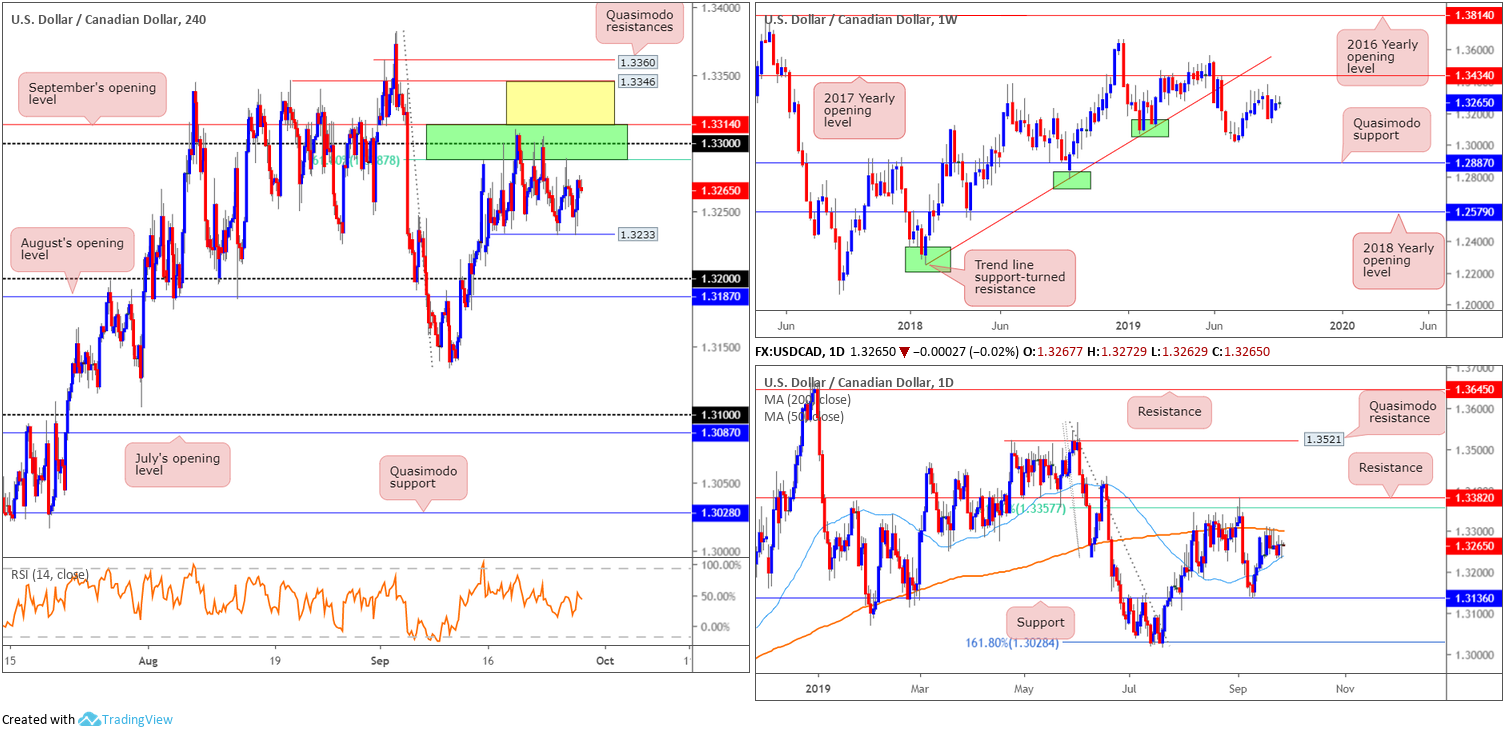
Kicking things off from the top this morning, technical research has weekly price languishing south of resistance priced in at 1.3434: the 2017 yearly opening level. Daily action, on the other hand, is tightly confined between the 200-day SMA (orange – 1.3301) and the 50-day SMA (blue – 1.3236). Outside of this range, traders likely have eyes fixed on support coming in at 1.3136 and resistance drawn from 1.3382, sited just north of a 61.8% Fibonacci ratio at 1.3357.
Across the page on the H4 timeframe, the pair remains engrained within a consolidation formed from a resistance area comprised of September’s opening level at 1.3314, the round number 1.33 and the 61.8% Fibonacci ratio at 1.3287 (1.3314/1.3287) – supported further by the 200-day SMA highlighted on the daily timeframe – and local support at 1.3233.
Areas of consideration:
Seeing both weekly and daily timeframes trade directionless casts a difficult line over medium-term direction, even more so when H4 price is also entrenched within a consolidation.
Despite the above, the area marked yellow on the H4 timeframe between Quasimodo resistance at 1.3346 and September’s opening level at 1.3314 is considered a ‘fakeout zone’. A run through 1.3314 will likely fill a huge number of buy stops and provide liquidity for a potential reaction off either 1.3346, or another layer of Quasimodo resistance at 1.3360 (merges with the 61.8% Fibonacci ratio on the daily timeframe at 1.3357). Conservative stop-loss placement is likely eyed above the high set at 1.3382.
USD/CHF:
Refreshing weekly peaks, the US dollar firmed vs. the Swiss franc for a second consecutive day Thursday, notching gains of 0.19%.
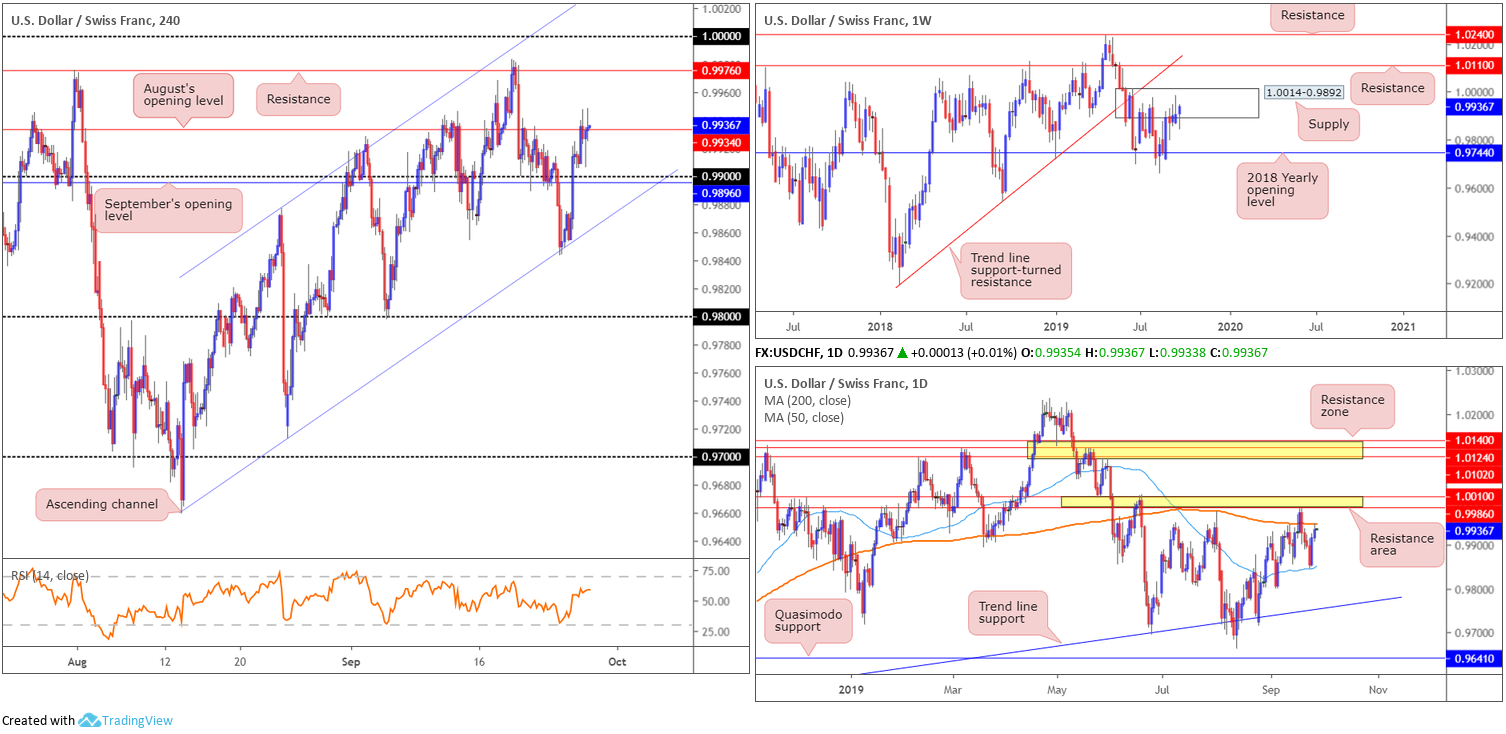
The higher-timeframe outlook reveals weekly movement to be ascending within the parapets of supply coming in at 1.0014-0.9892. This is the second time back to the area, meaning sell orders may be limited. A violation of the zone has resistance at 1.0110/trend line support-turned resistance (etched from the low 0.9187) to target. A closer reading of price action on the daily timeframe positions the unit at the underside of its 200-day SMA (orange – 0.9948), following a two-day run off the 50-day SMA (blue – 0.9850). Above the 200-day SMA, a familiar area of resistance resides close by between 1.0010/0.9986.
As for the H4 candles, buy stops above 0.99 are well and truly filled. Traders short August’s opening level at 0.9934 are also likely stopped out thanks to yesterday’s push to highs of 0.9948. While this structure suggests further upside may be in store towards resistance at 0.9976, buyers must contend with daily sellers from the 200-day SMA highlighted above, and any residing weekly sellers from supply at 1.0014-0.9892.
Areas of consideration:
According to the technical status of this market, neither a long nor short seems attractive at this time. Buyers must contend with daily and weekly sellers, while selling offers limited resistance on the H4 scale and support resides close by at the 0.99 handle/channel support (taken from the low 0.9659).
Dow Jones Industrial Average:
US equity indexes explored lower ground Thursday, as traders weighed the implications of the impeachment inquiry into US President Donald Trump. The Dow Jones Industrial Average fell 79.59 points, or 0.30%; the S&P 500 also fell 7.25 points, or 0.24% and the tech-heavy Nasdaq 100 erased 31.55 points, or 0.40%.
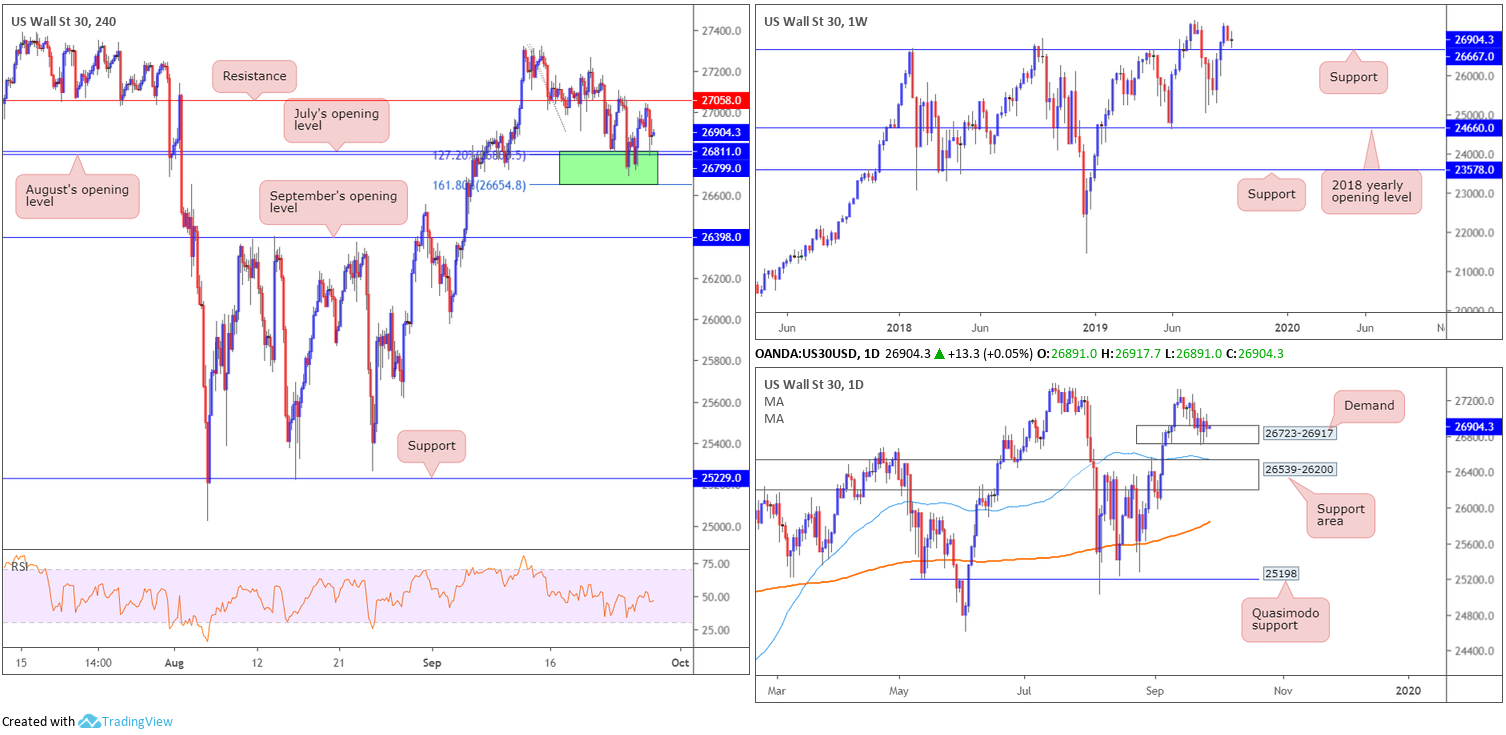
Concerning technical research, movement on the weekly timeframe trades unmoved on the week, currently chalking up a Doji candlestick formation (considered an indecisive signal). Support remains set at 26667, while all-time highs can be seen at 27388.
Daily demand at 26723-26917 remains in the fold, capping downside, though a lack of bullish enthusiasm is present. This could lead to a run towards the 50-day SMA (blue – 26544), which happens to be hugging the top edge of a daily support area at 26539-26200.
The H4 support zone marked in green at 26654/26811, comprised of August and July’s opening levels at 26799 and 26811, respectively, the 127.2% Fibonacci extension value at 26800 and the 161.8% Fibonacci extension at 26654, remains intact. As you can see, resistance at 27058 maintains a strong defence and is proving troublesome for H4 buyers. In the event the resistance eventually gives way, all-time highs mentioned above at 27388 are in the offing as the next upside target.
Areas of consideration:
Although all three timeframes lack concrete direction at this time, bias remains pointing in a northerly direction all the time we trade north of weekly support at 26667. A break above the H4 resistance at 27058, therefore, might be interpreted as a bullish indicator. Above this barrier, traders could simply enter long at the close of the breakout candle. Conservative traders wishing to add a little more confirmation to the mix, nonetheless, may look for a retest to form off 27058 before pulling the trigger. Not only does this help identify buyer intent, it provides entry and risk levels to work with. As highlighted above, the next upside target from this point is 27388.
XAU/USD (GOLD):
Renewed US/China trade optimism and a robust US dollar capped gains Thursday, as bullion established mild support ahead of 1500.0. In view of yesterday’s lacklustre performance, the technical bias going forward remains unchanged from Thursday’s outlook.
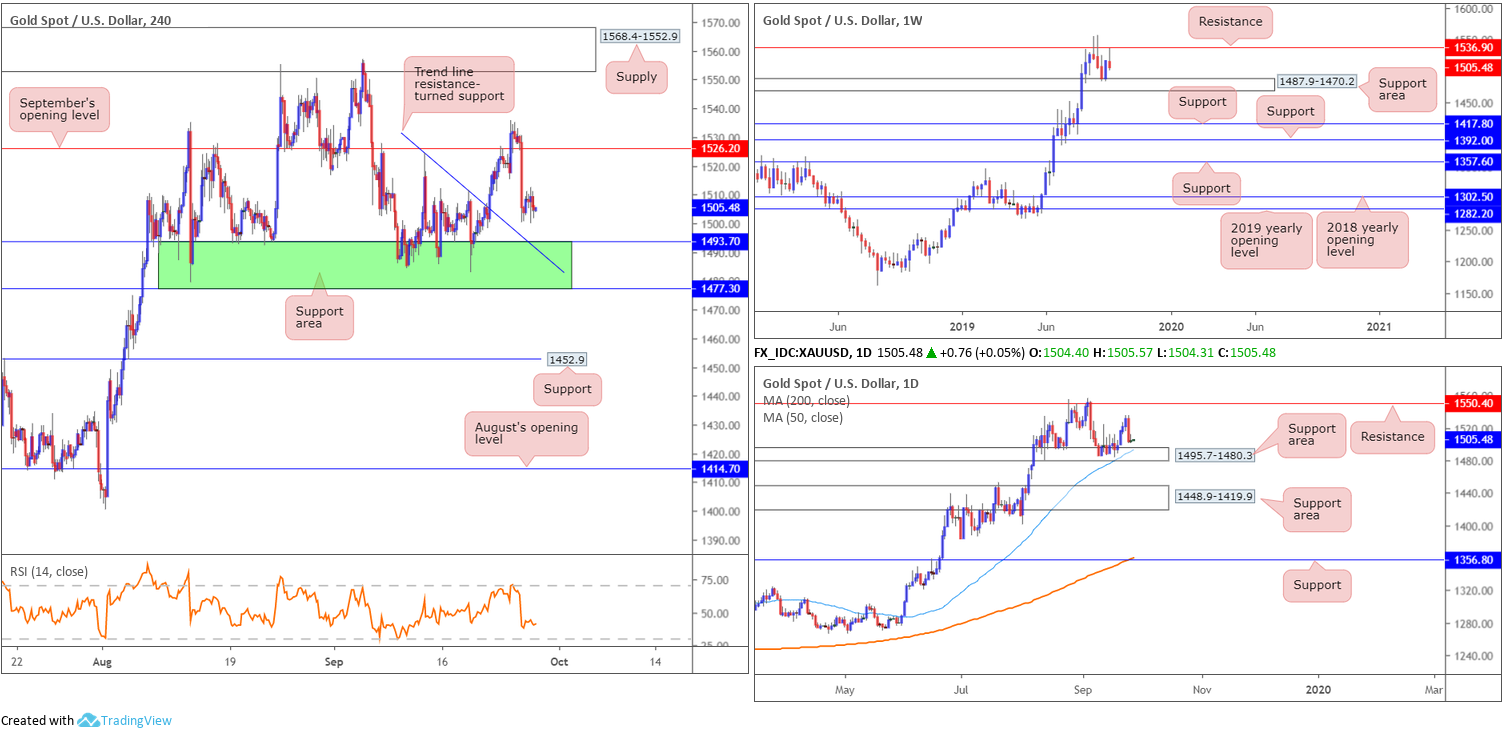
H4 action reclaimed September’s opening level at 1526.2 in robust fashion in recent trade, consequently positioning the unit within touching distance of a familiar support area (green) at 1477.3/1493.7, and local trend line resistance-turned support (pencilled from the high 1524.2).
Recent selling came about a few points south of weekly resistance at 1536.9, guiding price action towards another possible test of a support area coming in at 1487.9-1470.2. By the same token, daily price is seen nearing the top edge of a support area at 1495.7-1480.3 (glued to the upper limit of the said weekly support zone), which happens to intersect with a 50-day SMA (blue –1493.4).
Areas of consideration:
With everything taken into account, another retest of the H4 support zone mentioned above at 1477.3/1493.7 is likely on the cards today. The confluence visible not only from the H4 trend line support, but also the higher-timeframe support areas, really underpins the H4 base.
Entry and risk parameters are, of course, trader dependent. Some will simply enter long at 1493.7 and position stops below the H4 support zone accordingly, while others may prefer to wait and see how the H4 candles behave before pulling the trigger. A strong bullish candlestick configuration formed, or an entry based on lower-timeframe structure – a trend line break for instance – are just some of the options available to conservative traders.
The accuracy, completeness and timeliness of the information contained on this site cannot be guaranteed. IC Markets does not warranty, guarantee or make any representations, or assume any liability regarding financial results based on the use of the information in the site.
News, views, opinions, recommendations and other information obtained from sources outside of www.icmarkets.com.au, used in this site are believed to be reliable, but we cannot guarantee their accuracy or completeness. All such information is subject to change at any time without notice. IC Markets assumes no responsibility for the content of any linked site.
The fact that such links may exist does not indicate approval or endorsement of any material contained on any linked site. IC Markets is not liable for any harm caused by the transmission, through accessing the services or information on this site, of a computer virus, or other computer code or programming device that might be used to access, delete, damage, disable, disrupt or otherwise impede in any manner, the operation of the site or of any user’s software, hardware, data or property.


