A note on lower timeframe confirming price action…
Waiting for lower timeframe confirmation is our main tool to confirm strength within higher timeframe zones, and has really been the key to our trading success. It takes a little time to understand the subtle nuances, however, as each trade is never the same, but once you master the rhythm so to speak, you will be saved from countless unnecessary losing trades. The following is a list of what we look for:
- A break/retest of supply or demand dependent on which way you’re trading.
- A trendline break/retest.
- Buying/selling tails/wicks – essentially we look for a cluster of very obvious spikes off of lower timeframe support and resistance levels within the higher timeframe zone.
- Candlestick patterns. We tend to only stick with pin bars and engulfing bars as these have proven to be the most effective.
We search for lower timeframe confirmation between the M15 and H1 timeframes, since most of our higher-timeframe areas begin with the H4. Stops are usually placed 5-10 pips beyond confirming structures.
EUR/USD:
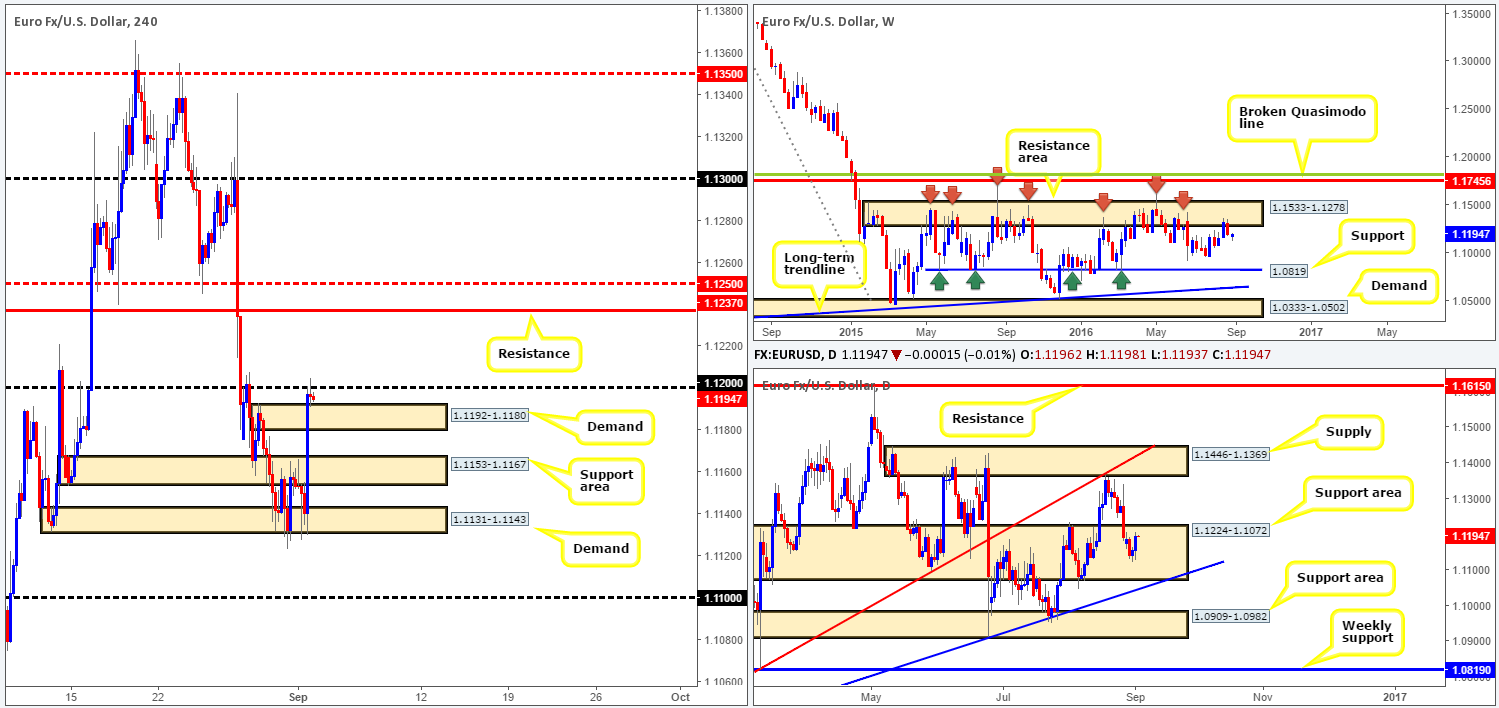
US manufacturing data reported a worse than expected month yesterday, consequently forcing the EUR to cross swords with the 1.12 handle into the close. As of now, we can see that price is locked between this number and the recently broken H4 supply-turned demand at 1.1192-1.1180.
Should the single currency close above the 1.12 band today, this would further confirm bullish strength from the current daily support area seen at 1.1224-1.1072, and likely open the gates for a challenge of the H4 resistance 1.1237/H4 mid-way resistance 1.1250. Technically, however, weekly action is seen trading from a major resistance area at 1.1533-1.1278, which could put pressure on the buyers. In the event that the bears remain dominant from here, the next weekly downside targets to have an eye on fall in around the 1.0970 region, followed closely by a major support seen at 1.0819.
Our suggestions: Beyond the H4 demand at 1.1192-1.1180, H4 downside seems cramped given the nearby H4 support area at 1.1153-1.1167 and H4 demand seen at 1.1131-1.1143. Therefore, we will likely steer clear of shorts today. To the upside, a close above 1.12 followed by a retest and a lower timeframe buy signal (see the top of this report) is enough to justify an intraday long (in our opinion), targeting the aforementioned 1.1250/1.1237 area. Be that as it may, traders will want to tread carefully today, as the mighty NFP report is set to take the limelight later on. We would strongly advise caution trading around this time since technicals usually take a back seat!
Levels to watch/live orders:
- Buys: Watch for price to close above the 1.12 handle and then look to trade any retest seen thereafter (lower timeframe confirmation required).
- Sells: Flat (Stop loss: N/A).
GBP/USD:
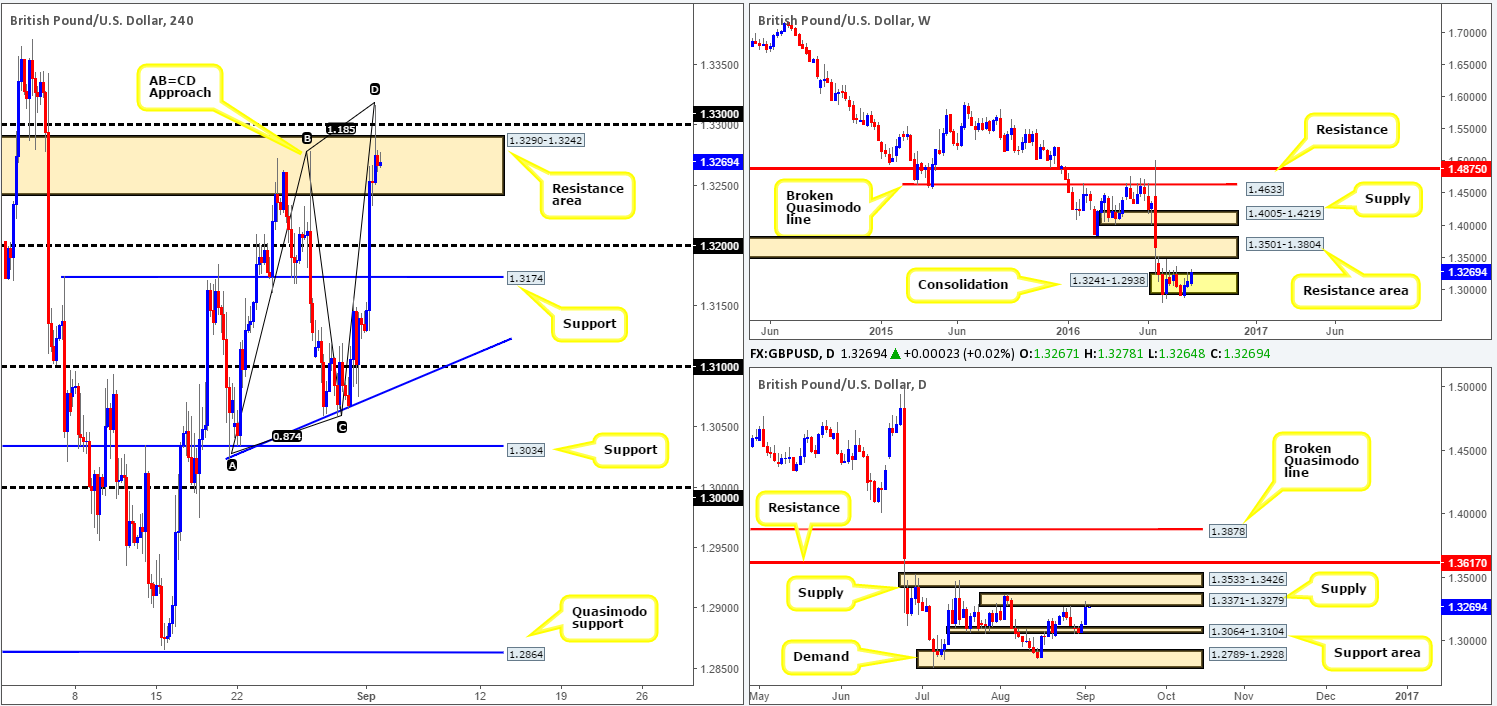
Going into the early hours of yesterday’s US session, cable saw an increase in value on the back of lower than expected US manufacturing data. As you can see, price ended the day whipsawing through a H4 resistance area at 1.3290-1.3242, which tagged not only the 1.33 handle, but also the completion point of a H4 AB=CD bearish pattern around the 1.3316ish range.
What this bullish move also did was bring prices down to a H4 demand seen on the US dollar index at 95.52-95.61, and also force sterling back up to the underside of a daily supply zone coming in at 1.3371-1.3279. This – coupled with the above H4 structures and the fact that weekly price is touching gloves with the top edge of a minor range seen at 1.3241, we feel a downside move is likely on the cards today. Nevertheless, traders will want to exercise caution due to today being the first Friday of a new month: NFP day!
Our suggestions: From a technical standpoint, this pair is overbought and potentially ready for a sell off. With that in mind, should one manage to pin down a lower timeframe setup to sell (see the top of this report for a list of lower timeframe entry techniques) within the current H4 resistance area, the unit will likely reach at least the 1.32 base.
Levels to watch/live orders:
- Buys: Flat (Stop loss: N/A).
- Sells: 1.3290-1.3242 [Tentative – confirmation required] (Stop loss: dependent on where one confirms this area).
AUD/USD:
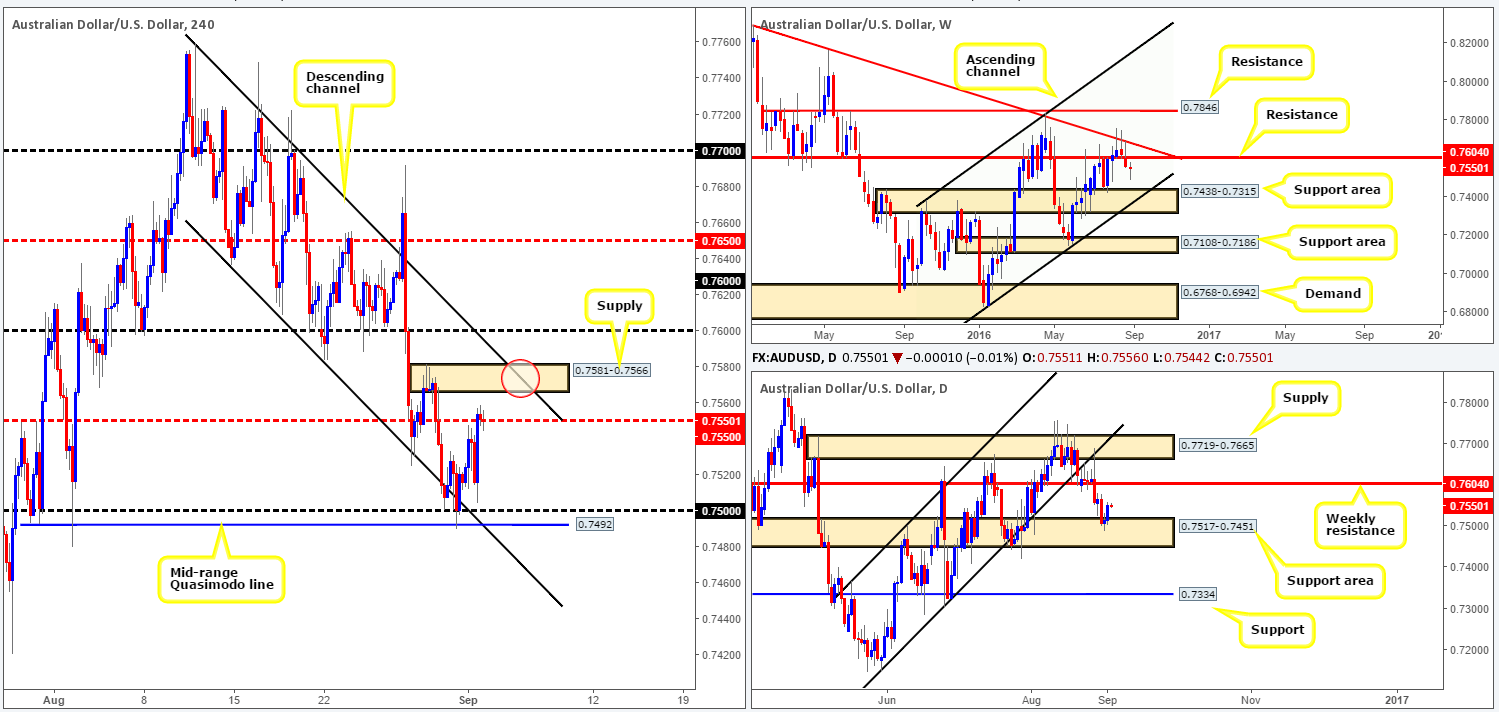
Boosted by a lower than expected US manufacturing reading yesterday the commodity currency was bid against its US counterpart, bringing price up to the H4 mid-way resistance area 0.7550 by the day’s end. Technically, this move was supported by a daily area coming in at 0.7517-0.7451, which shows room for further upside to a weekly resistance line drawn from 0.7604.
Directly above the 0.7550 zone, as you can probably see, sits a fresh H4 supply area at 0.7581-0.7566 that merges beautifully with a H4 channel resistance extended from the high 0.7759 (red circle). A reaction will likely be seen here but could be overshadowed by the 0.76 handle above it, since this number represents the above said weekly resistance at 0.7604.
Our suggestions: Expect a fakeout through the current H4 supply area guys. A weekly level above a H4 zone is a clear indication that a fakeout is highly likely to take place. Should one look to try and take advantage of this move, we’d advise letting the fakeout take place first and then look to enter short on the close of the trigger candle (we’ll be watching the M30 for this). Furthermore, keep in mind that today is NFP day and this will cause ripples through the markets! Therefore, remain vigilant during this time!
Levels to watch/live orders:
- Buys: Flat (Stop loss: N/A).
- Sells: 0.76 range – essentially looking for price to fakeout above the H4 supply at 0.7581-0.7566 into 0.76 (Stop loss: would be best placed above the trigger candle i.e. the fakeout candle).
USD/JPY:
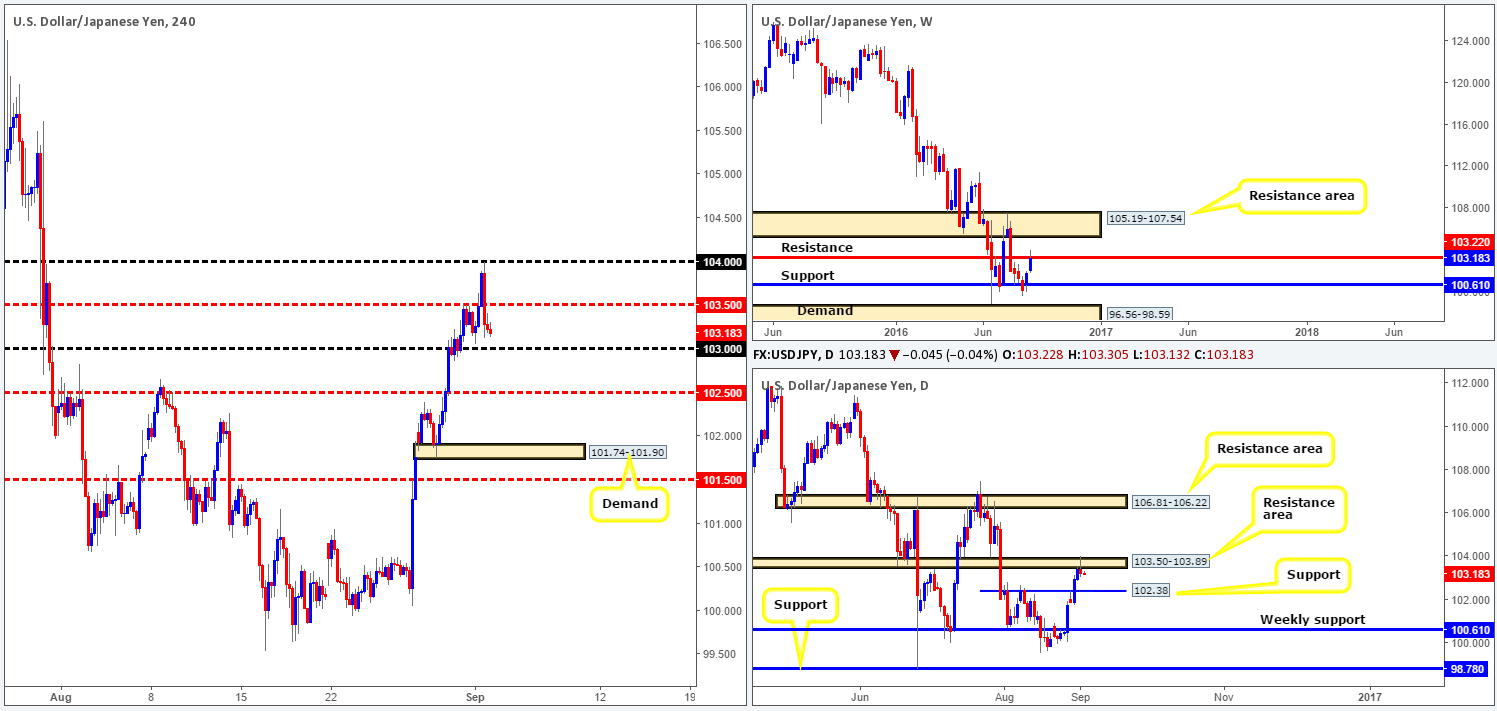
Prompted by yesterday’s poor US manufacturing data, the USD/JPY printed an aggressive two-candle whipsaw through the H4 mid-way resistance 103.50, which hit the 104 handle to-the-pip, before collapsing to lows of 103.12 on the day. In that price is now trading just ahead of the 103 handle, where does one go from here? Well, the reaction seen from the daily resistance area at 103.50-103.89, along with weekly price recently connecting with a resistance level coming in at 103.22, further downside is expected.
Our suggestions: Watch for a close below the 103 handle. Should this come into view followed by a convincing retest of 103, our team would enter short targeting the mid-way support 102.50 as our initial take-profit zone. Although this setup is high probability, one must take into account that today is NFP day which means aggressive moves are expected around this time! Therefore, trade with caution guys!
Levels to watch/live orders:
- Buys: Flat (Stop loss: N/A).
- Sells: Watch for price to close below the 103 handle and then look to trade any retest seen thereafter.
USD/CAD:
Based on recent action, we can see that the USD/CAD is currently carving out a consolidation zone fixed between a H4 Quasimodo resistance level at 1.3147 and a H4 demand base drawn from 1.3079-1.3065. Any sustained move above 1.3147 would likely place the H4 resistance at 1.3184 in the limelight. Conversely, a break below the current H4 demand area could potentially place the key figure 1.30 on the hit list. However, we do not see price breaching this range ahead of today’s employment report.
Higher-timeframe technicals, however, show weekly action is still planted within a supply zone coming in at 1.3295-1.3017. This, along with daily price printing two back-to-back selling wicks off the underside of a resistance level at 1.3135, we feel a break to the downside it the more likely route.
Our suggestions: Watch for a break below the current H4 demand base followed by a retest to the underside of the area as supply. By and of itself, this is a high-probability move which should reach 1.30 (also represents a minor daily support level). However, do remain vigilant around 1.30pm GMT today as the US employment report is a big hitter in the markets!
Levels to watch/live orders
- Buys: Flat (Stop loss: N/A).
- Sells: Watch for price to close below the H4 demand base at 1.3079-1.3065 and then look to trade any retest seen thereafter.
USD/CHF:
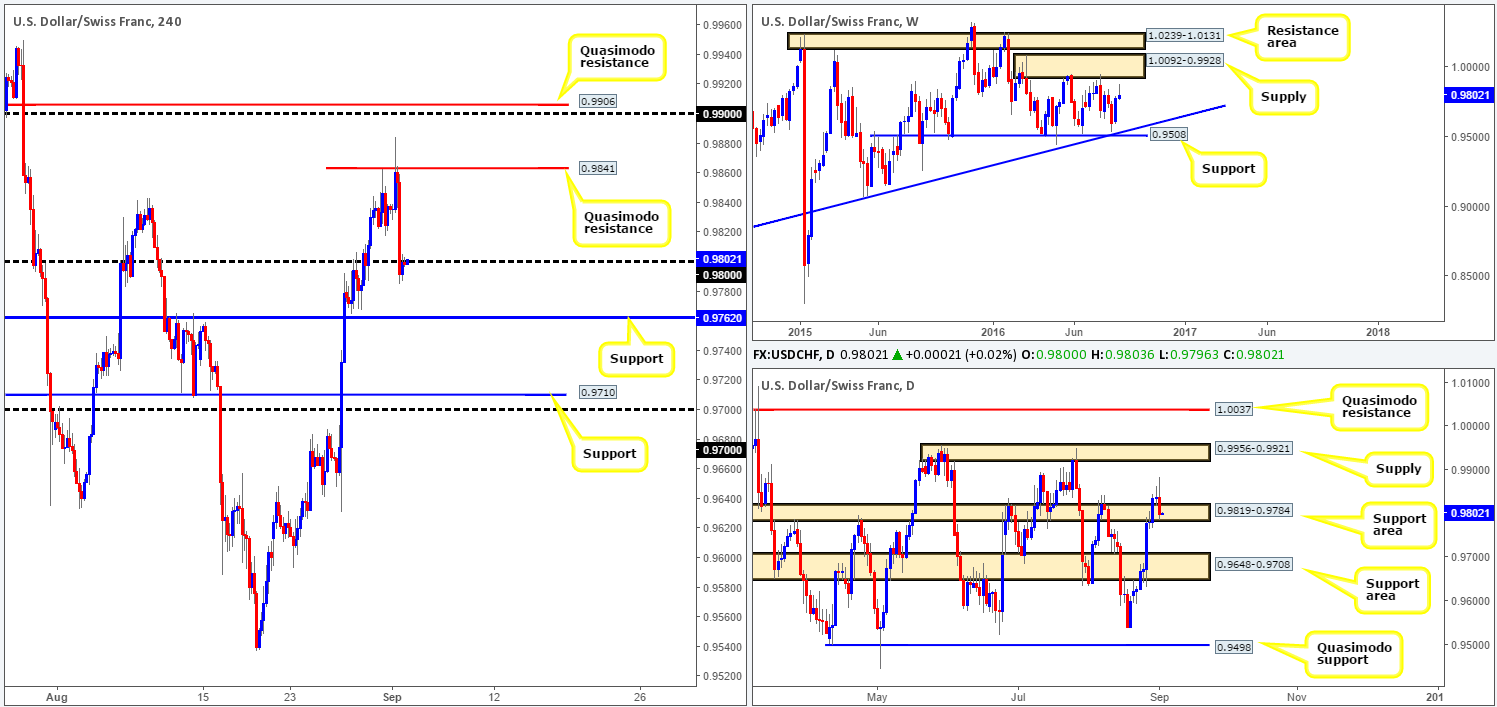
The USD/CHF pair, as you can see, aggressively sold off going into yesterday’s US session, off the back of poor US manufacturing data. The 0.98 handle was taken out and is currently being retested as resistance. Forty pips below this number sits a H4 support level coming in at 0.9762.
Higher up on the curve, nevertheless, we can see that weekly movement sold off ahead of a supply zone at 1.0092-0.9928. Meanwhile, down on the daily chart, the Swissy is currently being supported by the 0.9819-0.9784 area. Until this daily area breaks, our team has noted they’re not interested in becoming sellers in this market, despite price now kissing the underside of 0.98.
Our suggestions: Personally, we do not feel that this market will chalk up any noteworthy movement ahead of today’s US employment report. That being the case, we’ve opted to remain flat for the time being and will look at reassessing market structure following the NFP release.
Levels to watch/live orders:
- Buys: Flat (Stop loss: N/A).
- Sells: Flat (Stop loss: N/A).
DOW 30:
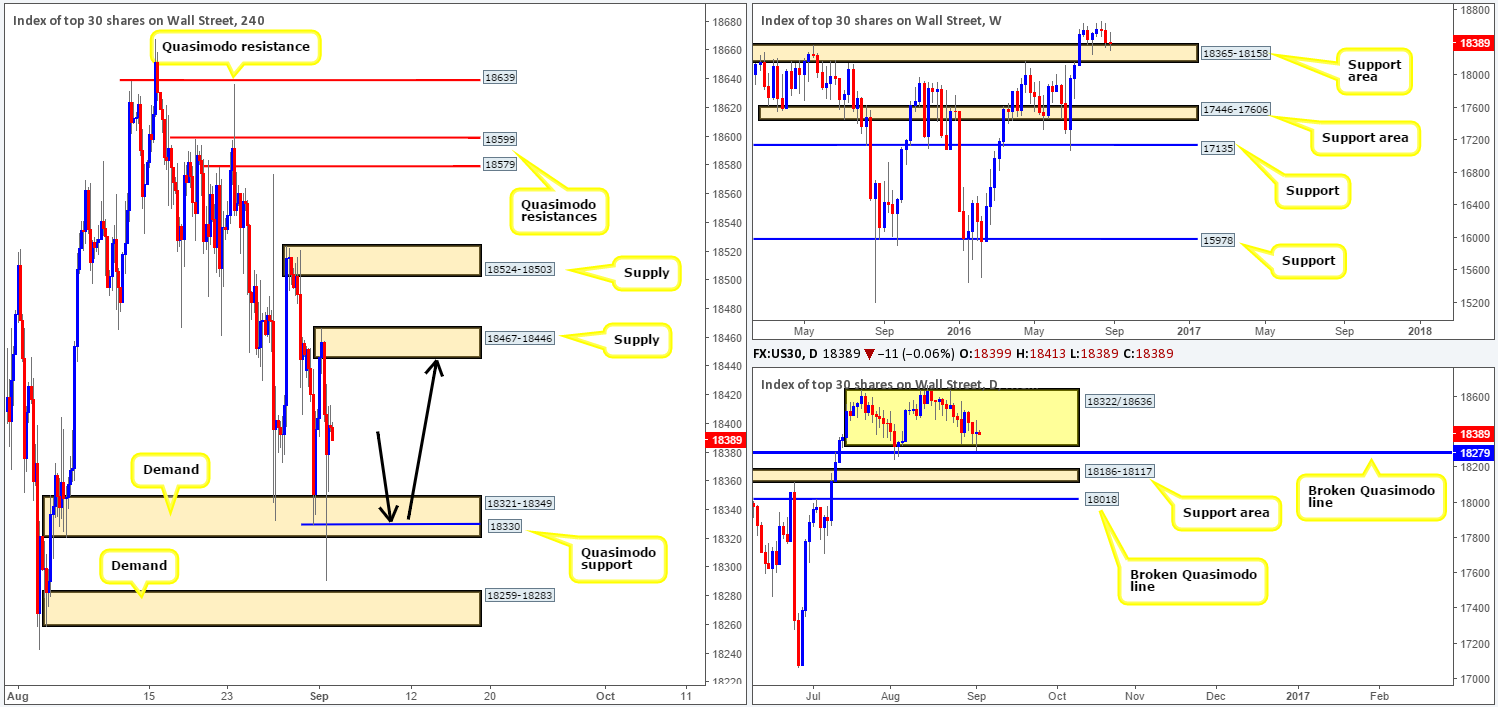
Kicking off this morning’s report with a look at the weekly chart, it can be seen that the buyers and sellers remain battling for position around the top edge of a support base coming in at 18365-18158. Overall, we expect this area to hold firm and propel prices to all-time highs. Turning our attention to the daily chart, the DOW whipsawed through the lower edge of the current daily range between 18322/18636 (yellow box), leaving the broken Quasimodo support level at 18279 unchallenged.
Poor US manufacturing data sparked a sell off in equities yesterday, forcing price to whipsaw through the H4 demand area at 18321-18349. Given the technical picture so far, higher prices are likely in store. Nevertheless, from a fundamental standpoint, the US NFP report is due to be released later on today which will cause a stir in this market. Generally, a better than expected number bodes well for US stocks. The more Americans earn, the more they spend thus fattening corporate profits! A lower than expected number, however, could see the current H4 demand base taken out today and the lower area of H4 demand brought into the action at 18259-18283 (surrounds the above mentioned daily broken Quasimodo support).
Our suggestions: Technically, we’re looking for price test the H4 Quasimodo support line seen housed within the current H4 demand base at 18330 (see black arrows). Should this come to fruition followed by a lower timeframe buy signal (see the top of this report), we would look to buy, targeting the H4 supply above at 18467-18446 as our first take-profit target.
In the event that this level is hit during today’s NFP report, we would advise sitting on your hands until the dust settles. Technicals usually take a back seat during heavy-hitting market events.
Levels to watch/live orders:
- Buys: 183330 [Tentative – confirmation preferred] (Stop loss: dependent on where one confirms this area). 18259-18283 [Tentative – confirmation preferred] (Stop loss: dependent on where one confirms this area).
- Sells: Flat (Stop loss: N/A).
GOLD:
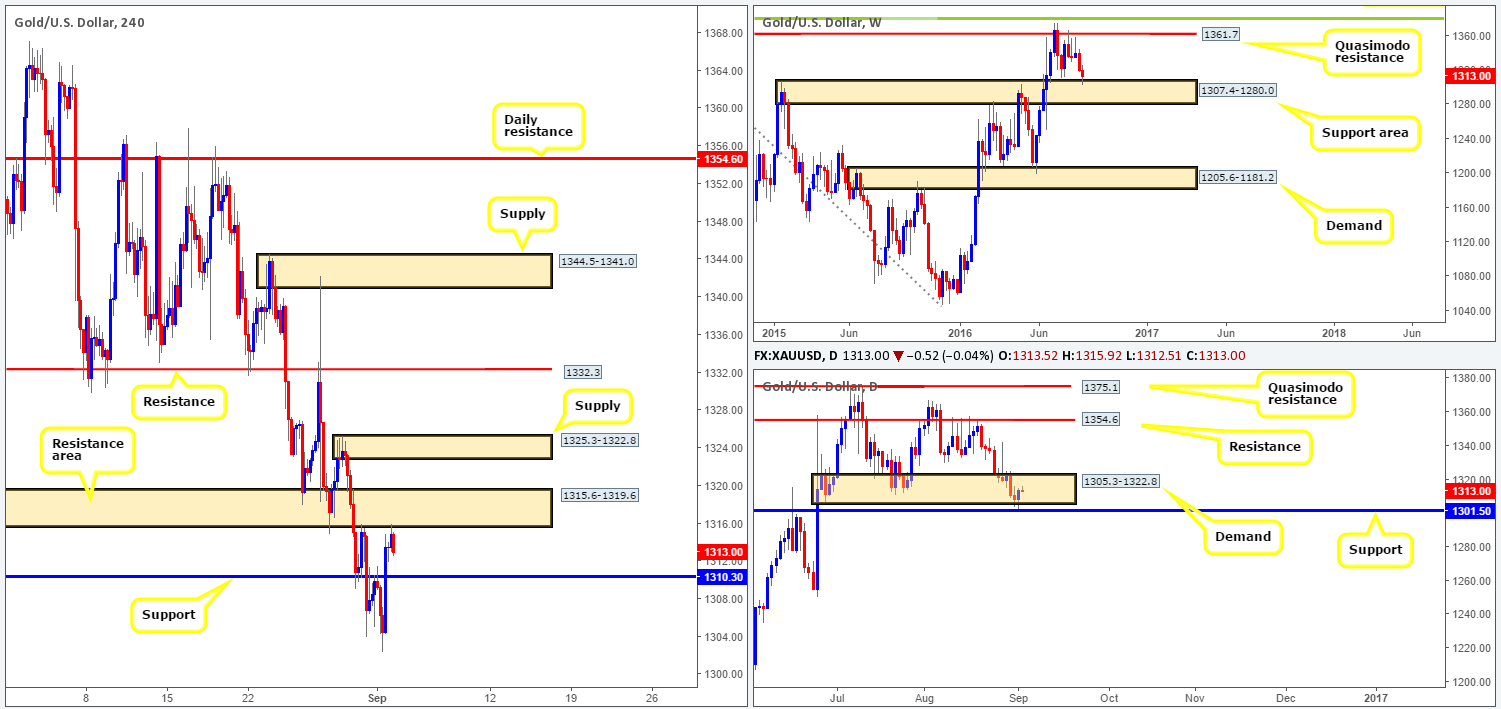
The US dollar came under pressure yesterday due to a poor US manufacturing print, consequently propelling the yellow metal above H4 resistance at 1310.3 (now acting support) into the underside of a H4 resistance area coming in at 1315.6-1319.6. From a H4 perspective, it’s reasonable to expect further downside in this market given the current trend and reaction from the H4 resistance area. Be that as it may, weekly action recently bounced off the top edge of a support area at 1307.4-1280.0, and daily price whipsawed through a daily demand base at 1305.3-1322.8, printing a rather nice-looking bullish engulfing candle.
Our suggestions: In that the higher-timeframe structures indicate higher prices may be seen, we would love nothing more than to buy gold right now. However, with the current H4 resistance area standing in the way at 1315.6-1319.6, along with a nearby H4 supply zone seen above it at 1325.3-1322.8, buying this market, despite the bigger picture, is just too risky.
With the above points in mind, we feel the best course of action is to remain flat until the NFP report has had its way with the market. Once the dust settles, we’ll look at reassessing structure.
Levels to watch/live orders:
- Buys: Flat (Stop loss: N/A).
- Sells: Flat (Stop loss: N/A).
