A note on lower timeframe confirming price action…
Waiting for lower timeframe confirmation is our main tool to confirm strength within higher timeframe zones, and has really been the key to our trading success. It takes a little time to understand the subtle nuances, however, as each trade is never the same, but once you master the rhythm so to speak, you will be saved from countless unnecessary losing trades. The following is a list of what we look for:
- A break/retest of supply or demand dependent on which way you’re trading.
- A trendline break/retest.
- Buying/selling tails – essentially we look for a cluster of very obvious spikes within the higher timeframe zone.
- Candlestick patterns. We tend to only stick with pin bars and engulfing bars as these have proven to be the most effective.
EUR/USD:
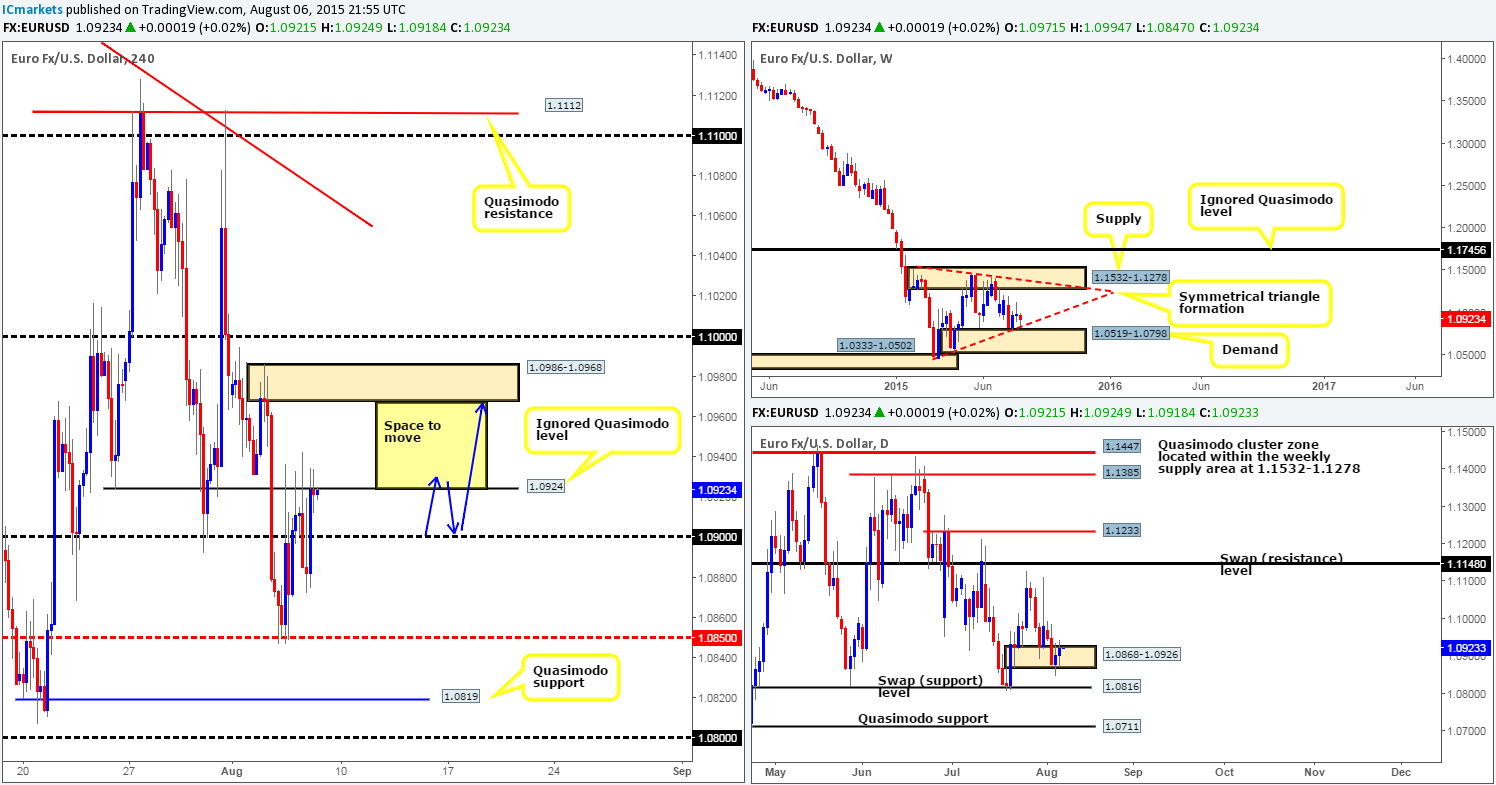
To kick-off this morning’s analysis, we’re going to begin with the weekly chart, which, as you can see, appears to be showing relatively strong buying interest off of the weekly ascending trendline extended from the low 1.0461. By the same token, the daily chart also shows positive buying following the fakeout below a minor daily demand area on Wednesday seen at 1.0868-1.0926.
The viewpoint from the 4hr timeframe, however, reveals that the EUR currency pair spent much of its time trying to get above the 4hr ignored Quasimodo level coming in at 1.0924. Just look at how many times price has spiked above this barrier now, it is clearly proving a very tough nut to crack!
Given that the market is trading close to yesterday’s prices right now, we’re still confident that if the aforementioned 4hr ignored Quasimodo level is engulfed north today (offers consumed), price will likely make a run for the 4hr supply area at 1.0986-1.0968 (target for any longs taken today). To take advantage of this potential move, we’d need to see price retest either 1.0924, or failing that 1.0900 with corresponding lower timeframe confirmation before considering a long trade. The reason for only targeting the next 4hr supply zone is simply because today’s NFP will likely cause volatile swings. Therefore, if this trade has not played out before the NFP hits the line, the setup will more than likely be invalidated.
Levels to watch/live orders:
- Buys: Watch for 1.0924 to be consumed and then look to enter on any retracement seen back towards 1.0924/1.0900 (confirmation required).
- Sells: Flat (Stop loss: N/A).
GBP/USD:
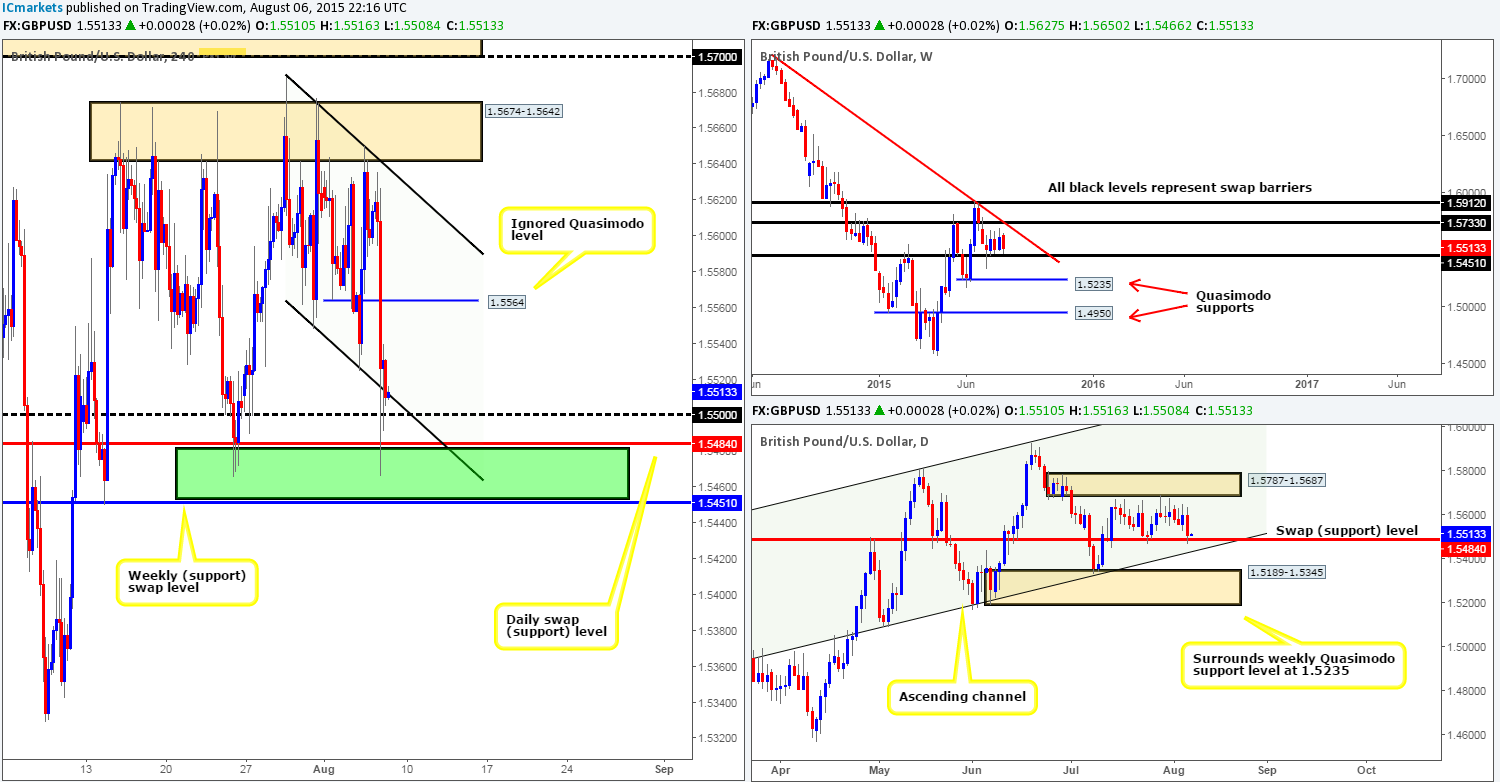
The GBP/USD pair, as you can see, took a turn for the worst yesterday as the Bank of England kept interest rates low. This spiral south punched through several 4hr technical levels before finally showing some stabilization at the daily swap (support) level at 1.5484, consequently forcing prices to close back within the current bull flag taken from the high 1.5688 and low 1.5548.
For those who read our previous report (http://www.icmarkets.com/blog/thursday-6th-august-multiple-high-impacting-news-events-on-cable-today-remain-vigilant/), you may recall us mentioning to keep an eye on the daily swap (support)/weekly swap (support) area at 1.5484/1.5451 (green area), for potential long opportunities. Unfortunately, we missed this move entirely, well done to any of our readers who managed to lock in some green pips here!
If, like us, you missed this move, all may not be lost! Although price has tested the aforementioned daily swap (support) barrier, it has yet to test the weekly swap (support) level lurking just below it at 1.5451, which converges with the daily ascending channel support taken from the low 1.5087. If this does occur, price will once again; be in a fantastic buy zone to look for lower timeframe confirmation. It will be interesting to see what today’s NFP release brings to the table.
Levels to watch/ live orders:
- Buys: 1.5451 region [Tentative – confirmation required] (Stop loss: Dependent on where one confirms this number)
- Sells: Flat (Stop loss: N/A).
AUD/USD:
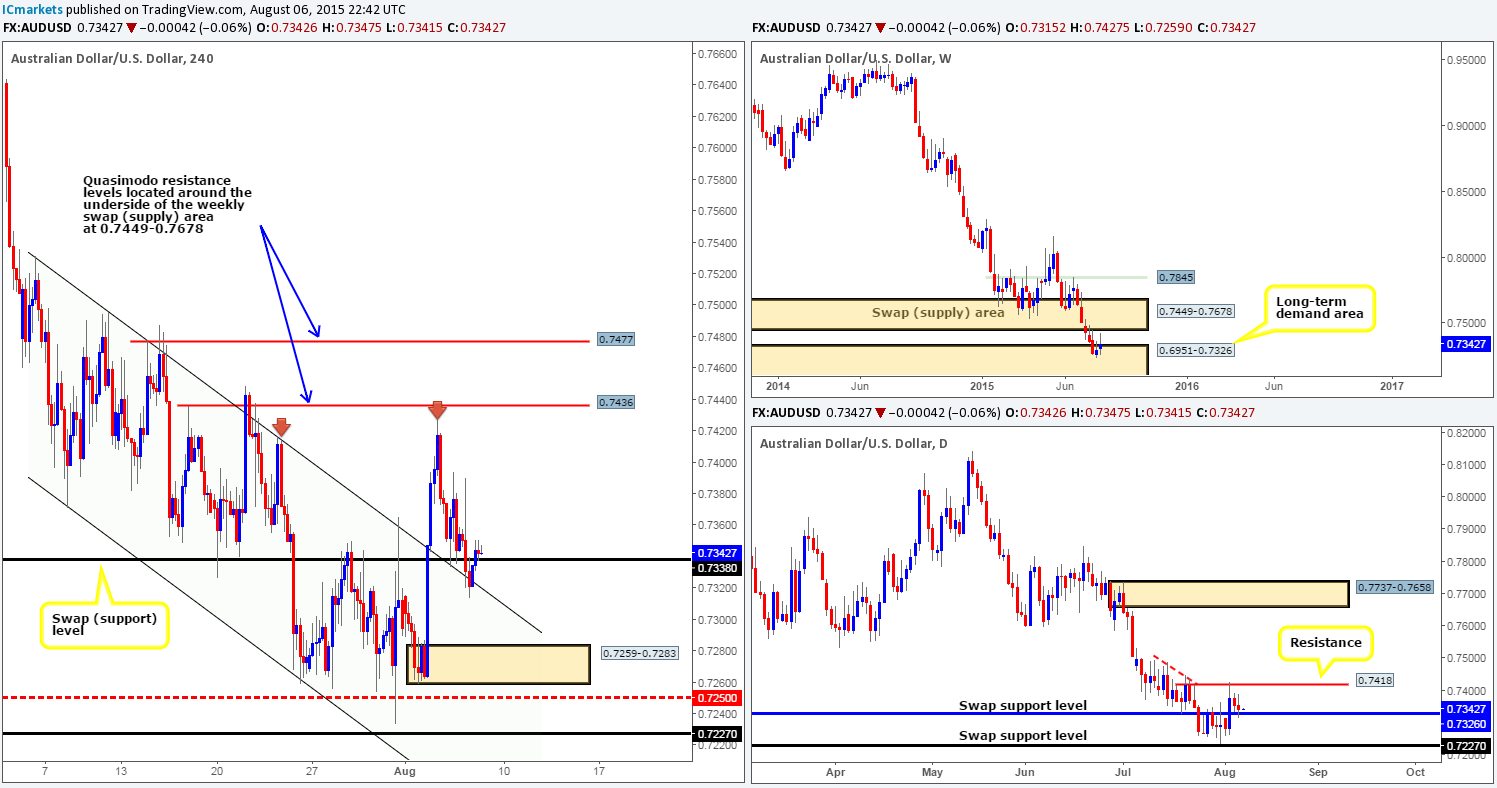
Going into the early hours of yesterday’s trade, price aggressively cut through bids sitting around the 4hr swap (support) level at 0.7338, and connected with support being drawn from the upper limit of the recently broken 4hr descending channel (0.7531/0.7371). This move, as you can see, reached lows of 0.7314 before a counter-attack was seen pushing prices back above the aforementioned 0.7338 level, which, at the time of writing, is holding firm.
Given the above, the question we’d all like an answer to is, is this 4hr support barrier steady enough to warrant a buy? Well, with price trading within a long-term weekly demand at 0.6951-0.7326, and also at the top-side of a daily swap (support) level also at 0.7326, we believe it is, but only for a small bounce due to the following (as mentioned yesterday):
- Clear downside risk to this pair due to price being entrenched in a humongous weekly downtrend.
- Price trading below resistance on the weekly timeframe in the form of a swap (supply) area at 0.7449-0.7678.
- Minor daily timeframe resistance seen at 0.7418.
Should all go to plan today, and we manage to find a confirmed setup on the lower timeframes around 0.7338, we would obviously target just below the aforementioned daily swap (resistance) level at 0.7415. However, depending on price action around this hurdle, we may, dependent on the time of day of course, look to take full profits above at the 4hr Quasimodo resistance coming in at 0.7436 since the highs 0.7416/0.7427 are just begging to be faked!
Levels to watch/ live orders:
- Buys: 0.7338 [Tentative – confirmation required] (Stop loss: Dependent on where one confirms this level).
- Sells: Flat (Stop loss: N/A).
USD/JPY:
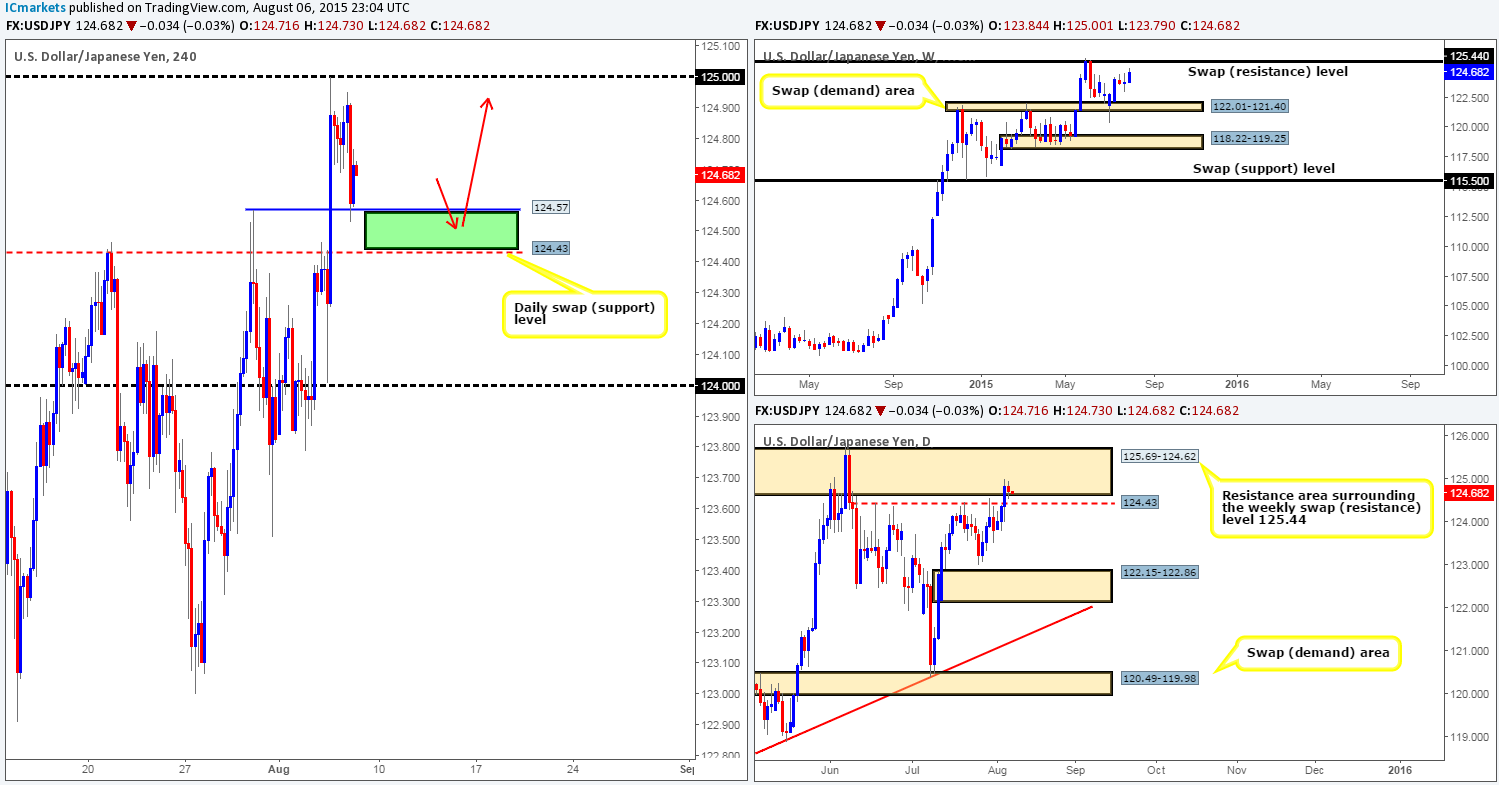
Following the rebound from the 125.00 handle yesterday, price action was seen hesitant on its next move. It was only when the U.S. trading session was thrown into the mix did we see the USD sell-off thirty pips down to support taken from last Thursday’s high 124.57, which, has so far been able to hold the market higher.
It is very difficult to tell whether the rebound from 124.57 is legit, or simply traders covering shorts. As such, we might see price continue to sell-off early on in the Asian session today and break below 124.57. This will stop out any lower timeframe traders who joined in on the short-covering ascent, and place price firmly within a buy zone (the green area) between 124.57 and the daily swap (support) barrier at 124.43.
Now, some may be thinking we’re crazy even considering a buy from here when price is currently lodged within a daily resistance area at 125.69-124.62 and you could very well be right! However, there is room currently being seen for a further push north on the weekly timeframe up to a weekly swap (resistance) level at 125.44, which is located deep within the above said daily resistance area. So, we’re going to try and take advantage of this.
Lower timeframe confirmation will be needed to be seen within our 4hr buy zone before we’d risk capital on this idea. With regards to targets, ideally, we’re looking towards 125.00, and maybe even 125.50, where at which point we’d be at the weekly swap (resistance) level (a fantastic area to short from). Of course, this trade will be invalidated if a setup occurs just before the NFP data is released, as we do not trade the news.
Levels to watch/ live orders:
- Buys: 124.43/124.57 region [Tentative – confirmation required] (Stop loss: dependent on where one confirms this area).
- Sells: Flat (Stop loss: N/A).
USD/CAD:
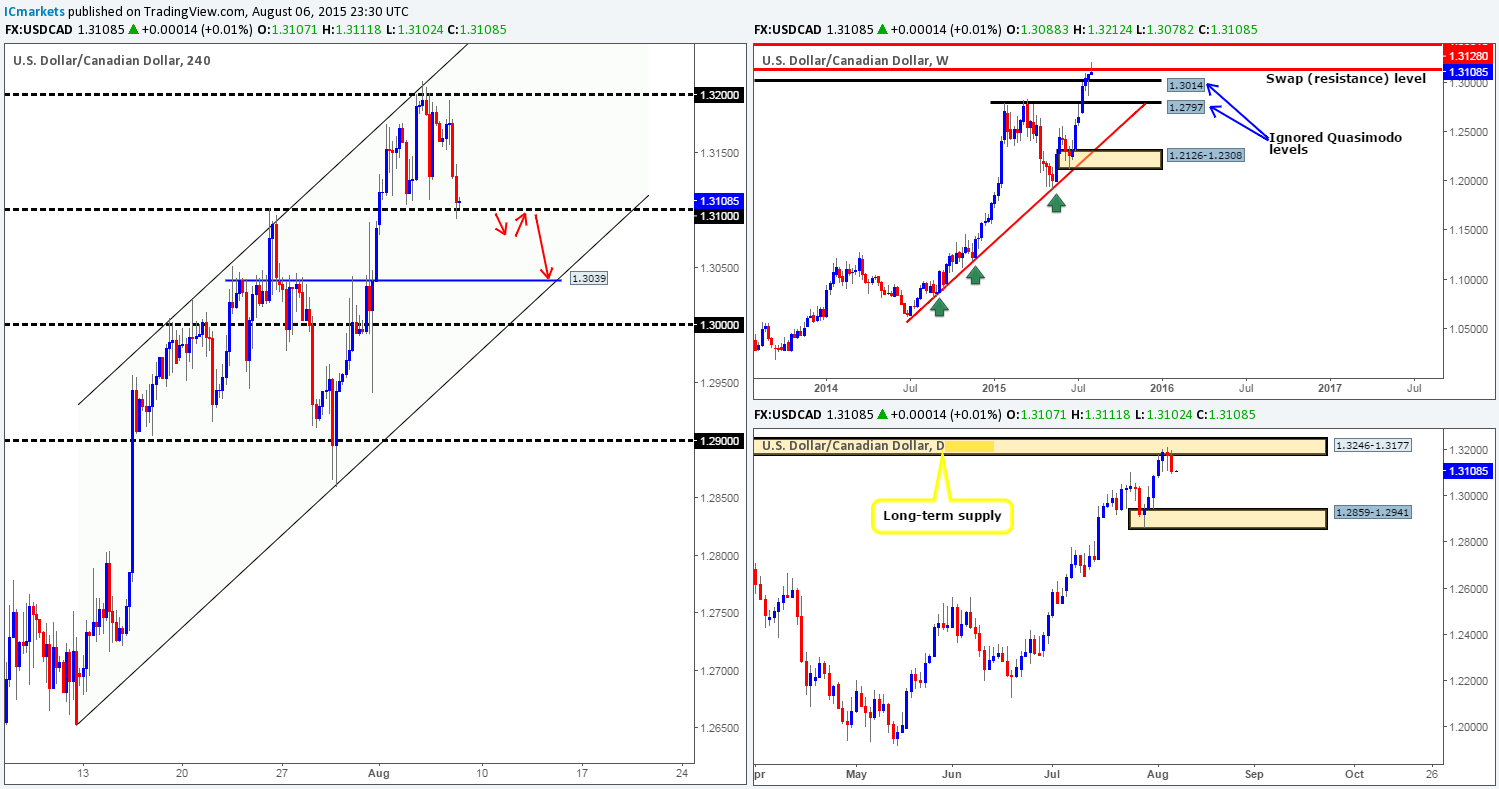
The USD/CAD pair ran into a strong ceiling of offers four pips below the 1.3200 handle during yesterday’s trade, pulling prices down to 1.3100 into the close 1.3107.
In view of price trading at a potential buy level right now (1.3100), where do we stand in the bigger picture? Well, the recent sell-off has now placed prices back below the weekly swap (resistance) level at 1.3128, and a near full-bodied bearish candle was printed from the underside of a daily supply area coming in at 1.3246-1.3177 yesterday. Therefore, buying from the 1.3100 hurdle may be good only for a small scalp trade. Other than this, we feel it is going to give way today due to higher timeframe selling pressure, which, as a result, will likely clear the path down to a 4hr swap (support) barrier at 1.3039.
To trade this potential short-term move south, we’d need to see two things happen. Firstly, a retest of 1.3100 as resistance (as per the red arrows), and secondly, a lower timeframe sell signal following the break lower.
Levels to watch/ live orders:
- Buys: Flat (Stop loss: N/A).
- Sells: Watch for 1.3100 to be consumed and then look to enter on a confirmed retest seen from this number.
USD/CHF:
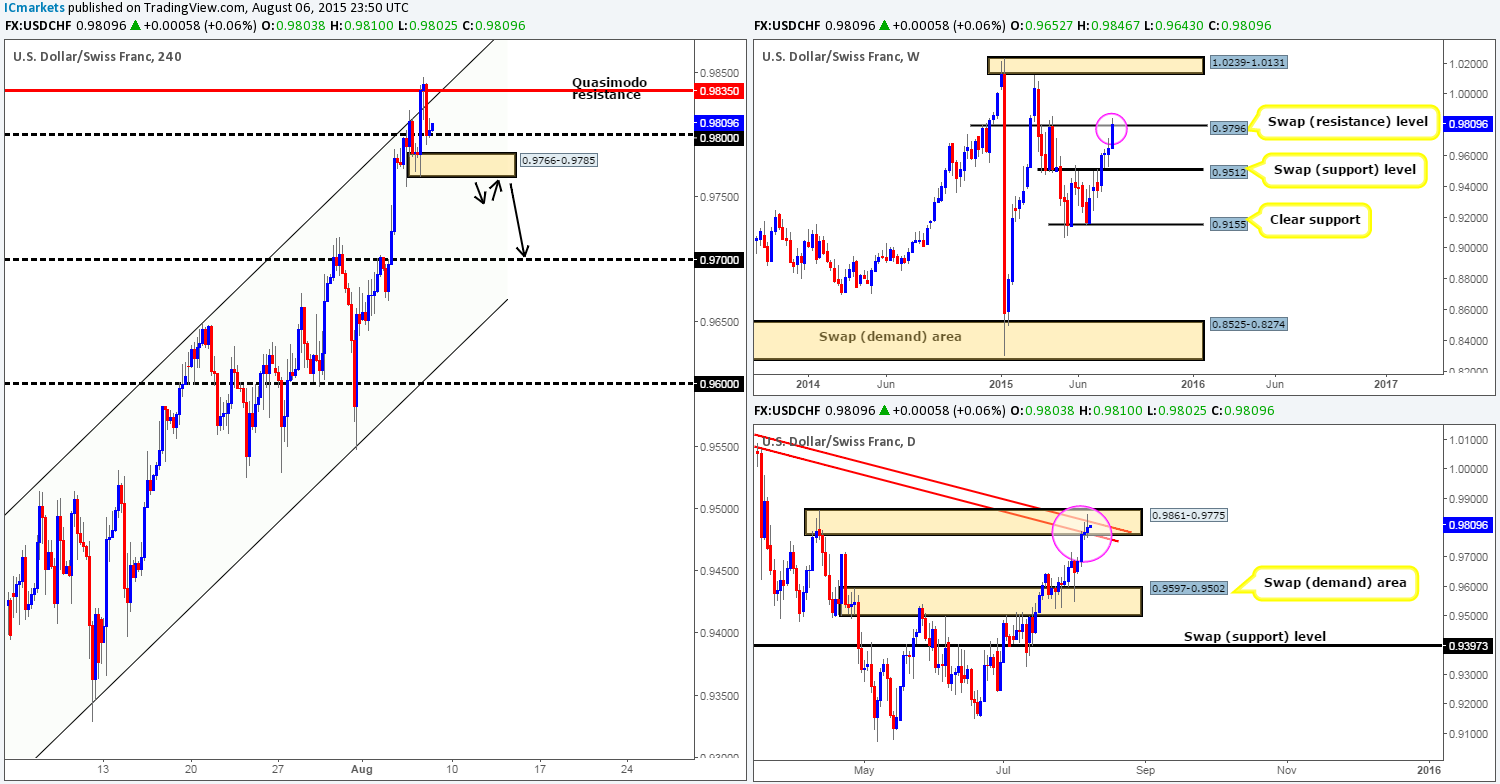
For those who read our previous report on this pair, you may recall that we planned to enter short at market if prices were to cross swords with the 4hr Quasimodo resistance level coming in at 0.9835. As you can see, price did as we expected, and as a result, we’re now short from 0.98378, with our stop sitting at 0.98650.
We are ‘hoping’ (not a great word to use when describing a trade) to see price take out both the round number 0.9800 and the 4hr demand area at 0.9766-0.9785 today, as this will open up a clean void down to around the round number 0.9700 (a beautiful take-profit zone for us). Dependent on the NFP data today of course, we believe this pair will likely sell-off due to price nibbling at the underside of both a weekly swap (resistance) level at 0.9796, and also a daily supply area at 0.9861-0.9775, which, as you can see, also boasts trendline confluence extended from the high 1.0239.
For anyone who missed the short at 0.9835, you could, if price moves in our favor, look to enter on a confirmed retest of the 4hr demand area at 0.9766-0.9785 as supply (black arrows), targeting 0.9700.
Levels to watch/ live orders:
- Buys: Flat (Stop loss: N/A).
- Sells: 0.98378 [LIVE] (Stop loss: 0.98650).
DOW 30:
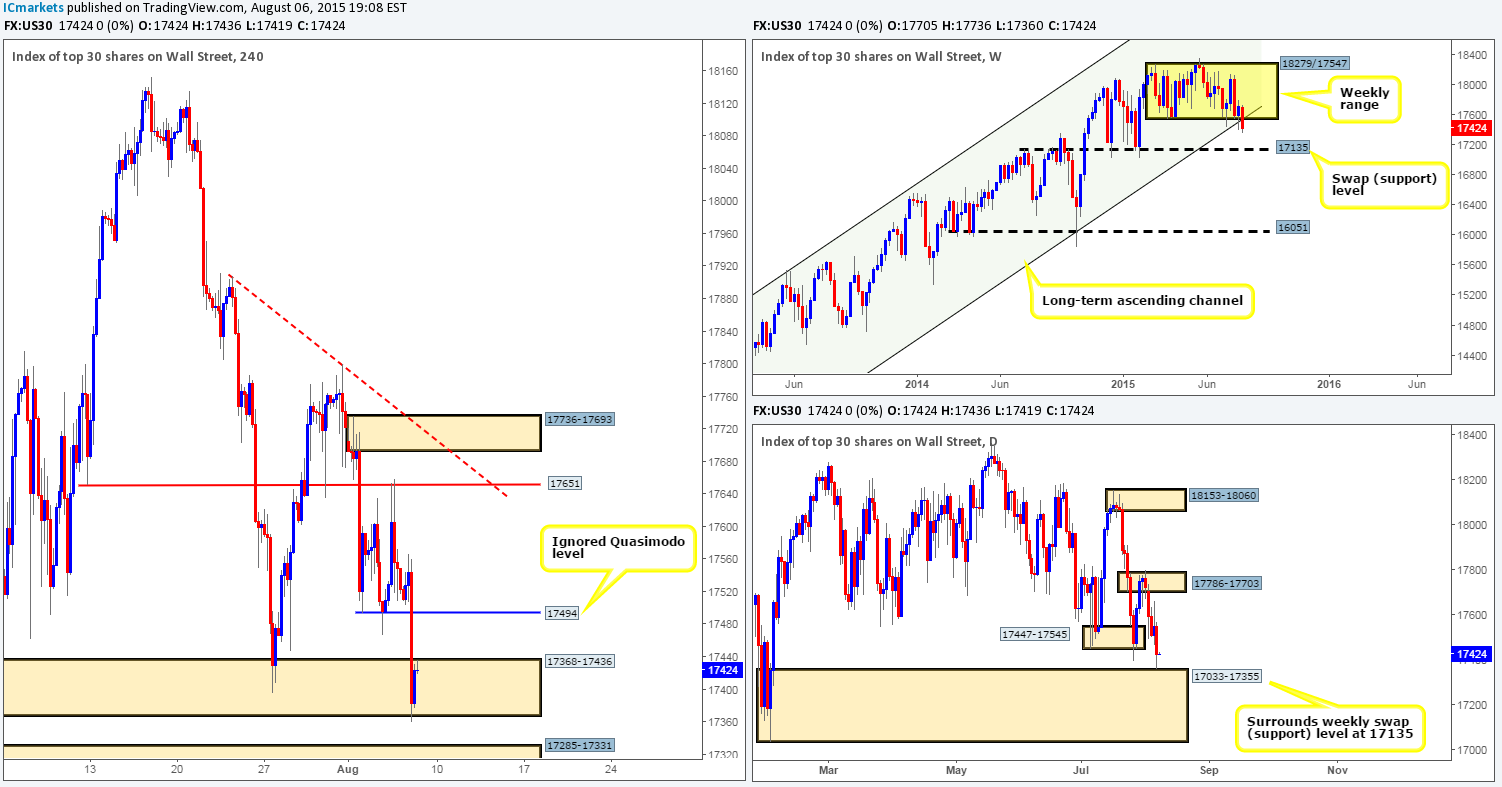
Using a top-down approach this morning, one can see that the weekly range ‘floor’ at 17547 is not doing too well at the moment, which could encourage further selling down to the weekly swap (support) level at 17135. Moving down to the daily scale, price has, as we reported may happen, drove further south beyond the weak-looking daily demand area at 17447-17545, and connected with the upper limits of a larger daily demand zone coming in at 17033-17355 (surrounds the aforementioned weekly swap (support) level).
Consequent to the recent sell-off, 4hr timeframe action shows price cleanly took out the 4hr Quasimodo support level at 17494, and stabbed into and extended slightly beyond a 4hr demand area coming in at 17368-17436. Buying from this area is possible in our opinion if we see corresponding lower timeframe action, with the ignored 4hr Quasimodo barrier at 17494 in mind for a take-profit zone. We would not feel comfortable holding on to a long position higher than this number, nonetheless, simply because the weekly timeframe looks set to continue falling (see above).
Levels to watch/ live orders:
- Buys: 17368-17436 [Tentative – confirmation required] (Stop loss: Dependent on where one confirms this area).
- Sells: Flat (Stop loss: N/A).
XAU/USD: (Gold)
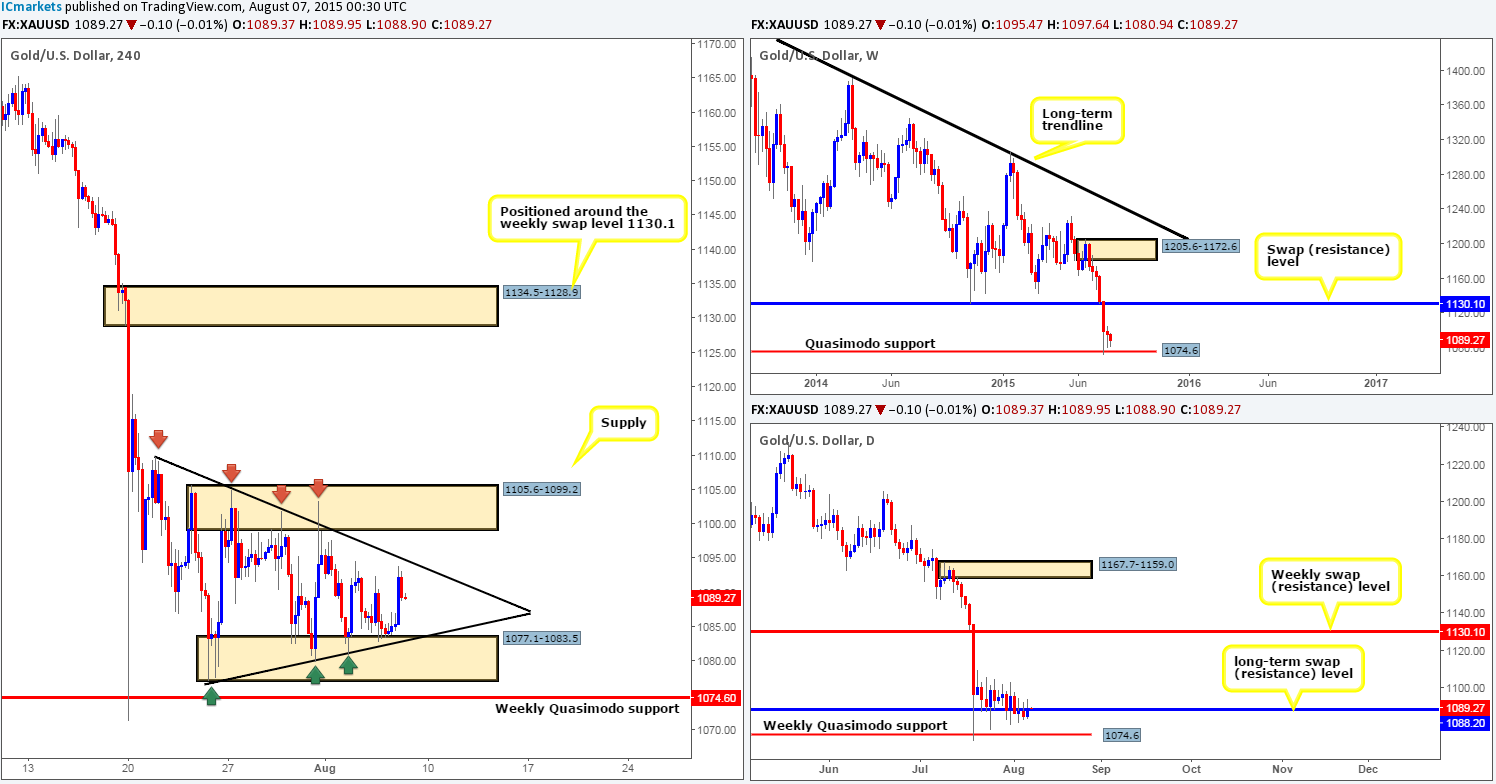
Gold has really been quite a frustrating market to trade this week. Price action has remained compressed within a 4hr symmetrical triangle (high: 1109.8 low: 1071.2) for the past two weeks, which, as you can see, also boasts extra support from 4hr demand at 1077.1-1083.5 and 4hr supply at 1105.6-1099.2.
Given the above, where do we stand in the bigger picture? Well, weekly action remains hovering above the weekly Quasimodo support level at 1074.6 with very little buying interest being seen at the moment, and price on the daily timeframe is still effectively hugging the long-term daily swap (resistance) level at 1088.2. Therefore, with the higher timeframes not showing much in the way of clear direction at the moment, we’re going to only look to trade small intraday bounces off of the limits of the aforementioned 4hr symmetrical triangle today.
However, with the NFP release set to take center stage later on, we may see price action finally gain consciousness and move its ass. Be prepared for the possibility that price may breakout of the 4hr symmetrical triangle formation. Therefore, no trades will be taken (at least for us anyway) 30 minutes before/after the NFP release. Be careful out there today traders!
Levels to watch/ live orders:
- Buys: Watch for buying opportunities at the ascending trendline taken from the low 1071.2 (confirmation required).
- Sells: Watch for selling opportunities at the descending trendline taken from the high 1109.8 (confirmation required).

