A note on lower timeframe confirming price action…
Waiting for lower timeframe confirmation is our main tool to confirm strength within higher timeframe zones, andhas really been the key to our trading success. It takes a little time to understand the subtle nuances, however, as each trade is never the same, but once you master the rhythm so to speak, you will be saved from countless unnecessary losing trades. The following is a list of what we look for:
- A break/retest of supply or demand dependent on which way you’re trading.
- A trendline break/retest.
- Buying/selling tails – essentially we look for a cluster of very obvious spikes within the higher timeframe zone.
- Candlestick patterns. We tend to only stick with pin bars and engulfing bars as these have proven to be the most effective.
EUR/USD:
Weekly recap:
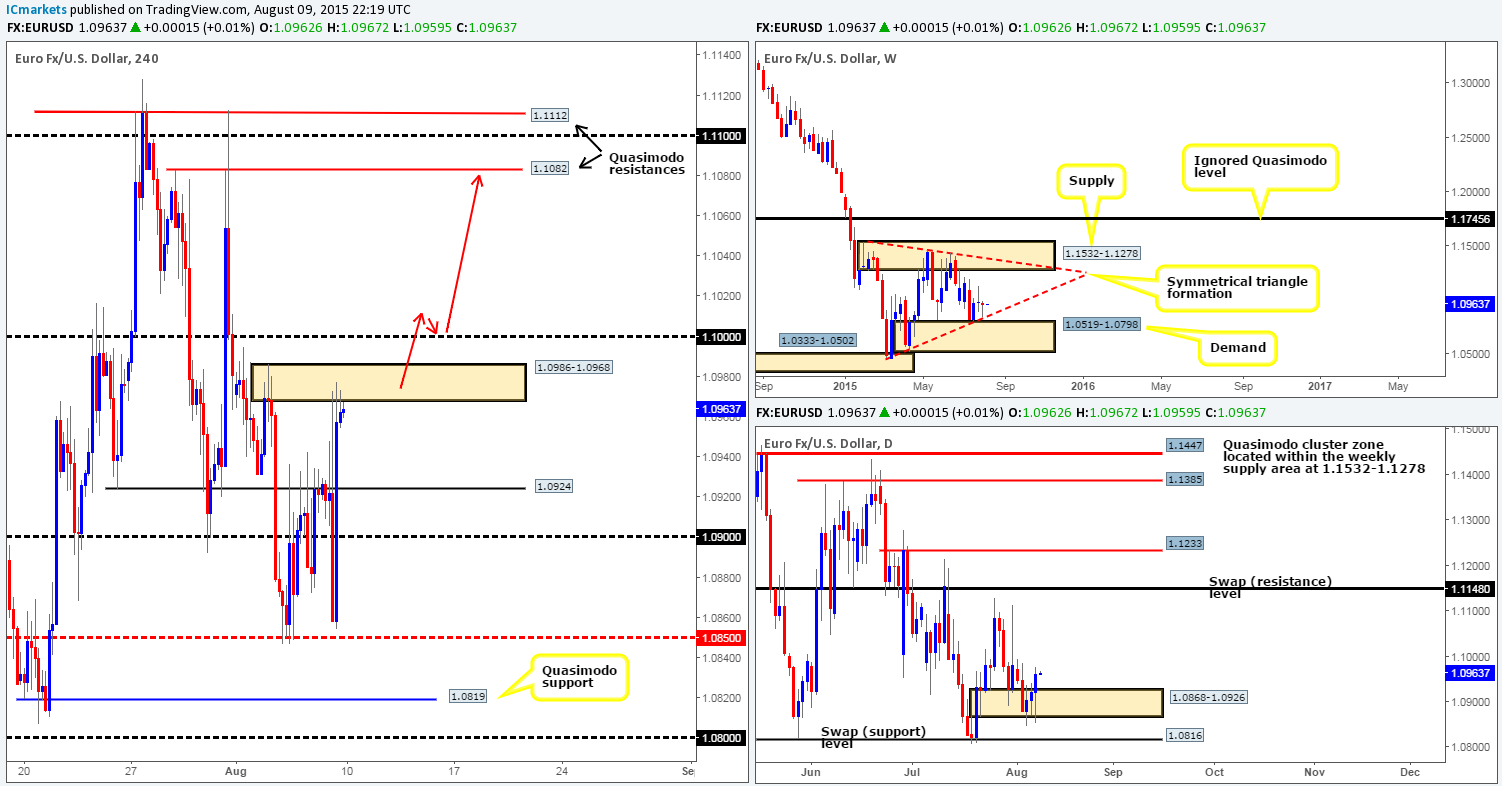
Last week’s trading action shows price painted a nice-looking weekly bullish pin-bar candle off the upper limits of a weekly ascending trendline extended from the low 1.0461. As a consequence the week ended relatively neutral, losing only 18 pips into the close 1.0962. Turning our attention to the daily chart, we can see that from Wednesday onwards, candle action printed consecutive higher highs as well as producing a beautiful array of buying tails, which, as you can see, stabbed below the minor daily demand area at1.0868-1.0926 on two out of the three tradingdays (bids likely consumed here now).
Friday’s non-farm payrolls data added 215k Jobs in the month of July, only slightly missing expectations of 222k. Despite this, a quick surge of USD buyers came into the market, reaching lows of 1.0854. Following this, however, price quickly bounced back taking out the ignored 4hr Quasimodo level at 1.0924, and all in all driving close to 120 pips north into 4hr supply coming in at 1.0986-1.0968 to end the week. While NFP data fell short of expectations, the employment number is likely to be considered strong enough to imply a Fed rate hike in September.
As we enter into a fresh week of trade, it’s clear to see that price remained unaffected during the weekend as the market opened at Friday’s closing number, 1.0962. In that price is still lurking just below the aforementioned 4hr supply, selling from this barrier may not be the best path to take considering what we saw last week from the 4hr timeframe’s bigger brothers (see above in bold). In addition to this,as far as we can see, both the weekly and daily timeframesstill showroom to move further north this week until at least the daily swap (resistance) level at 1.1148. Once, or indeed if price manages to get above this daily hurdle, then we’ll be eyeing the weekly supply area given at 1.1532-1.1278.
With everything taken into consideration, selling this market is not something we are likely going to be participating in today/this week. Buying, however, is certainly a possibility, but will only be permitted once/if a clean close above the large psychological barrier 1.1000(and preferably a retest of this number as well) is seen as per the red arrows. The space above this number provides a clear 80-pip target up to at least 1.1082 – a defined 4hr Quasimodo resistance level.
Levels to watch/live orders:
- Buys:Watch for both1.0986-1.0968 and 1.1000 to be consumed and then look to enter on a confirmed retest seen at the 1.1000 region.
- Sells: Flat (Stop loss: N/A).
GBP/USD:
Weekly recap:
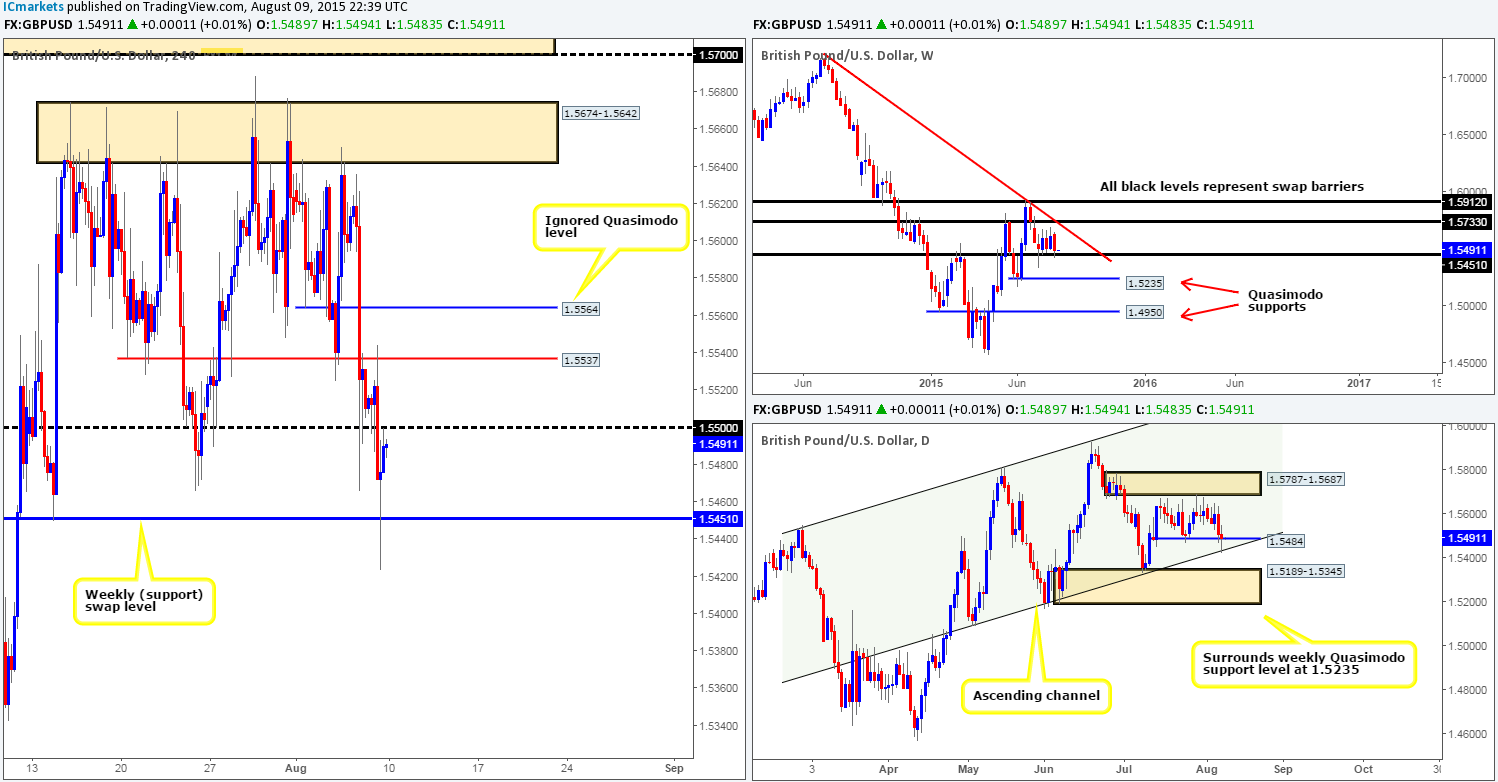
The U.S. dollar gained a little over 120 pips against Pound Sterling last week, consequently driving prices back down to a weekly swap (support) level at 1.5451, which saw a slight rebound into the close 1.5490. A bearish engulfing candle was also printed on the back of this recent drop, but considering it was into weekly support, we’re not too concerned with this bearish signal for the time being.Rolling a page lower to the daily timeframe, the GBP/USD’s recent sell off appears to have forced price into both daily support drawn from 1.5484, as well as the daily ascending channel support taken from the low 1.5087.
Looking at the 4hr scale, we can see that price sold off on Friday following slightly weaker than expected NFP data. Price aggressively drove below 1.5500 and faked below the weekly swap (support) level mentioned above, which ended with a short burst of buying back up to the underside of 1.5500 to end the week.
Little change was seen over the weekend as trade opened just below Friday’s closing number, 1.5489. On that note, here is what our team has jotted down for today/this week’s sessions…
Selling from 1.5500 today could be a possible trade avenue to consider, but not really one that we’d label high probability since by selling this market here, you’d likely be going up against higher timeframe buyers (see above in bold). From a technical perspective, we’re expecting the Pound to be bought this week at least until back up to daily supply drawn from 1.5787-1.5687. Therefore, what we’re looking for price to essentially do today is take out any offers sitting at 1.5500 and successfully retest this barrier as support as this would, in our opinion, do the following:
- Confirm bullish strength from the aforementioned higher timeframe support barriers.
- Provide a potential opportunity to trade long if lower timeframe price action is agreeable on the retest of 1.5500.
In the event that the above comes to fruition, partial profits would be taken at 1.5537 and also at 1.5564. Our final take-profit target would likely be at 1.5674-1.5642 – a 4hr resistance base which has clearly stood the test of time and is located just below the aforementioned daily supply area.
Levels to watch/ live orders:
- Buys: Watch for 1.5500 to be consumed and then look to enter on a confirmed retest at this number.
- Sells: Flat (Stop loss: N/A).
AUD/USD:
Weekly recap:
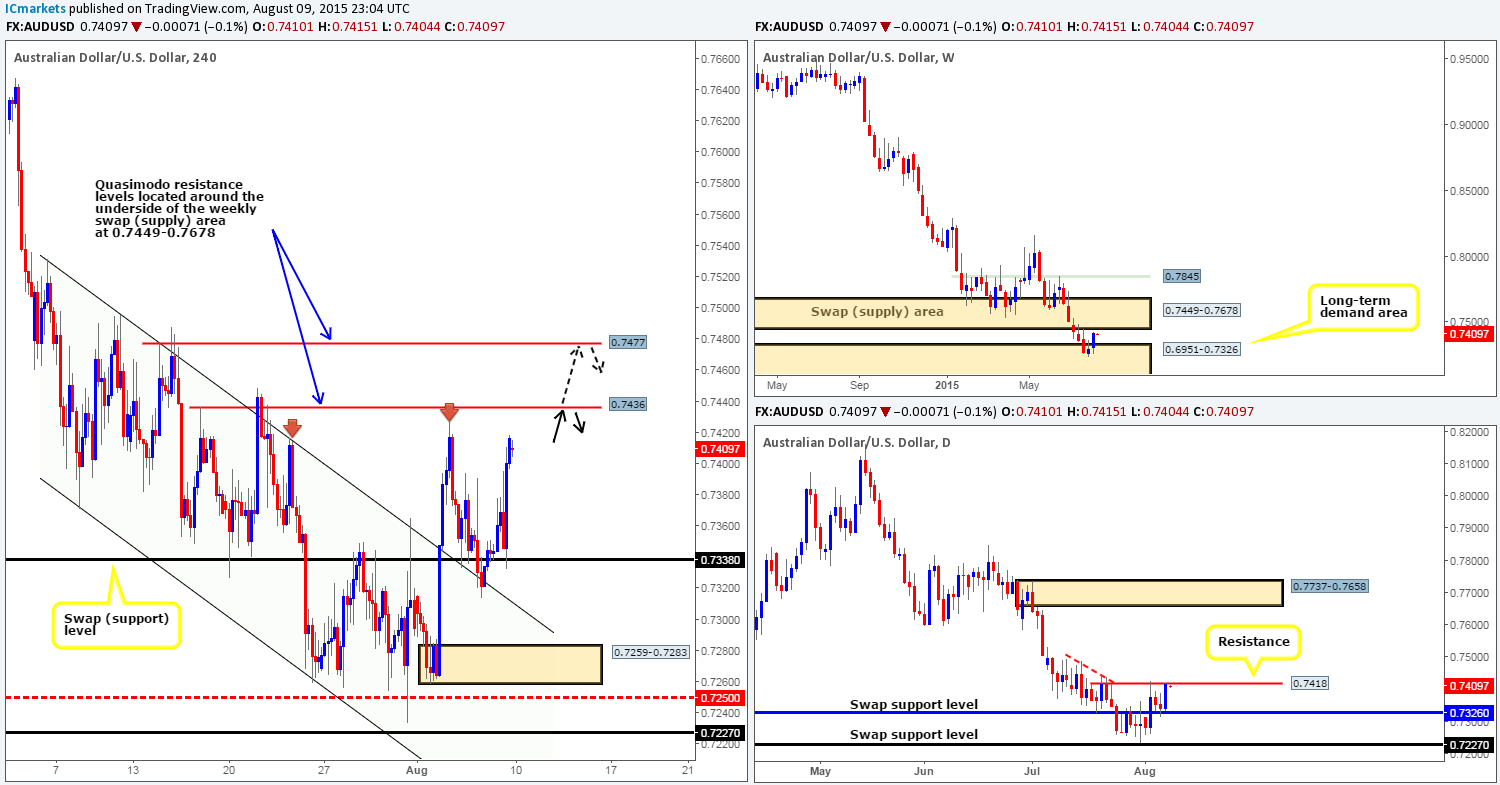
Following the weekly inverted pin-bar candle printed within the long-term weekly demand at 0.6951-0.7326, price rallied a little over 120 pips last week, closing at 0.7416 just below the weekly swap (supply) area at 0.7449-0.7678. Daily timeframe action on the other hand, shows that price bounced north following a successful retest of the daily swap (support) level at 0.7326, consequently pushing prices up to a minor daily resistance level coming in at 0.7418 to end the week.
The viewpoint from the 4hr timeframe reveals that NFP data did initially send this pair south into a 4hr swap (support) level at 0.7338, which, as you can see, was clearly strong enough to support a counter-attack on the day of around eighty pips reaching highs of 0.7421 into the close.
Transferring into a new week, we can see that price gapped six pips lower at the open 0.7410. Consequent to this, our analysis is relatively straight forward today.
In view of price trading at not only a minor daily resistance level, but also just below a long-term weekly swap (supply) area (see above), we feel that this market will likely struggle to trade higher this week. We are currently eyeing 0.7436 and 0.7477 for potential shorts today/this week, which are both 4hr Quasimodo resistance levels located around the underside of the aforementioned weekly swap (supply) zone. We would strongly advise against placing pending orders at the above said 4hr levels simply because for one, price can fake higher and take you out, and two, it is difficult to know which level will react, if any! Waiting for lower timeframe confirmation here may help avoid unnecessary losses here.
Levels to watch/ live orders:
- Buys: Flat (Stop loss: N/A).
- Sells: 0.7436/0.7477 [Tentative – confirmation required] (Stop loss: Dependent on where one confirms these levels).
USD/JPY:
Weekly recap:
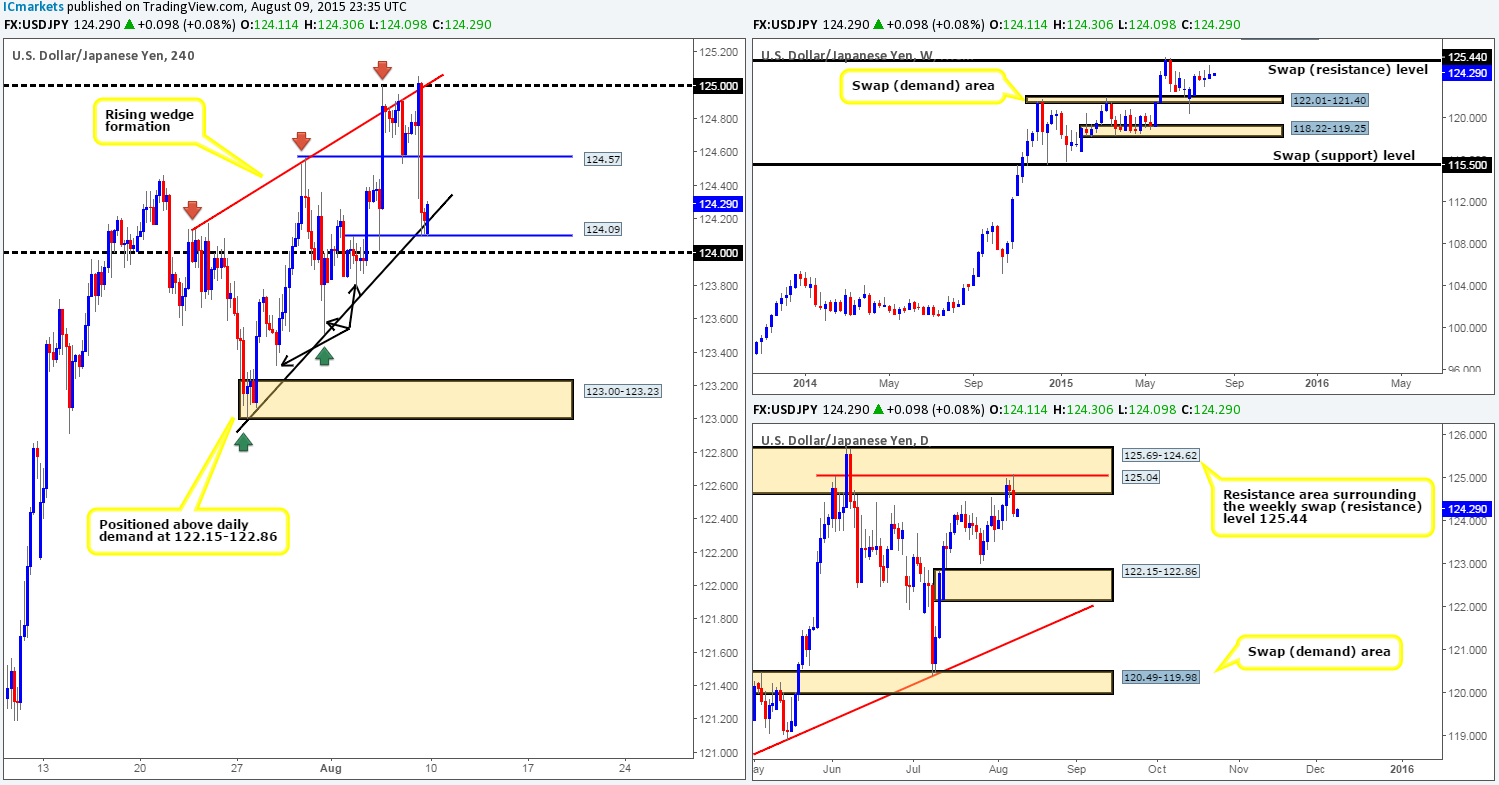
The USD/JPY pair ended the week printing a weekly bearish pin-bar candle 40 or so pips below the weekly swap (resistance) level at 125.44, gaining a mere 37 pips into the close 124.19. Looking at the daily chart, one can see that price sold off from a daily Quasimodo resistance level at 125.04, which is also lodged within a daily resistance area coming in at 125.69-124.62 (surrounds the aforementioned weekly swap [resistance] level).
From the pits of the 4hr timeframe, we can see that Friday’s action found strong offers sitting around the 125.00 handle, which converges beautifully with trendline resistance from the high 124.14. This forced price to take out the minor 4hr swap (support) level at 124.57, and slam dunk itself into 4hr support formed from a minor swing high on Tuesday (04/08/15) at 124.09, which also boasts 4hr trendline confluence extended from the low 123.00 (check out the rising wedge pattern currently in play).
Looking into the week ahead, price action began the week relatively calm with a small gap lower of nine pips at the open 124.11. This, as you can see, drove price back down into the upper limits of 4hr support at 124.09/the lower limit of current rising wedge, and as a result has seen a steady wave of bids so far enter this market.
As bullish as this looks from the 4hr scale, we would just not feel comfortable buying here due to where price is currently located on the higher timeframe picture (see above in bold). That being the case, we’d ideally like to see price take out this minor 4hr support, and also the round number sitting just below it at 124.00. With these two numbers out of the picture, there would be a possible short trade (assuming a confirmed retest was seen following the break lower) down to the 4hr demand area coming in at 123.00-123.23 (sitting just above daily demand at 122.15-122.86). Everything in between this 4hr demand zone and 124.00 appears consumed already – take note of the possible demand consumption tails marked with black arrows at: 123.79/123.51/123.32.
Levels to watch/ live orders:
- Buys:Flat(Stop loss: N/A).
- Sells: Watch for both 124.09 and 124.00 to be consumed and then look to enter on a confirmed retest at this small area.
USD/CAD:
Weekly recap:
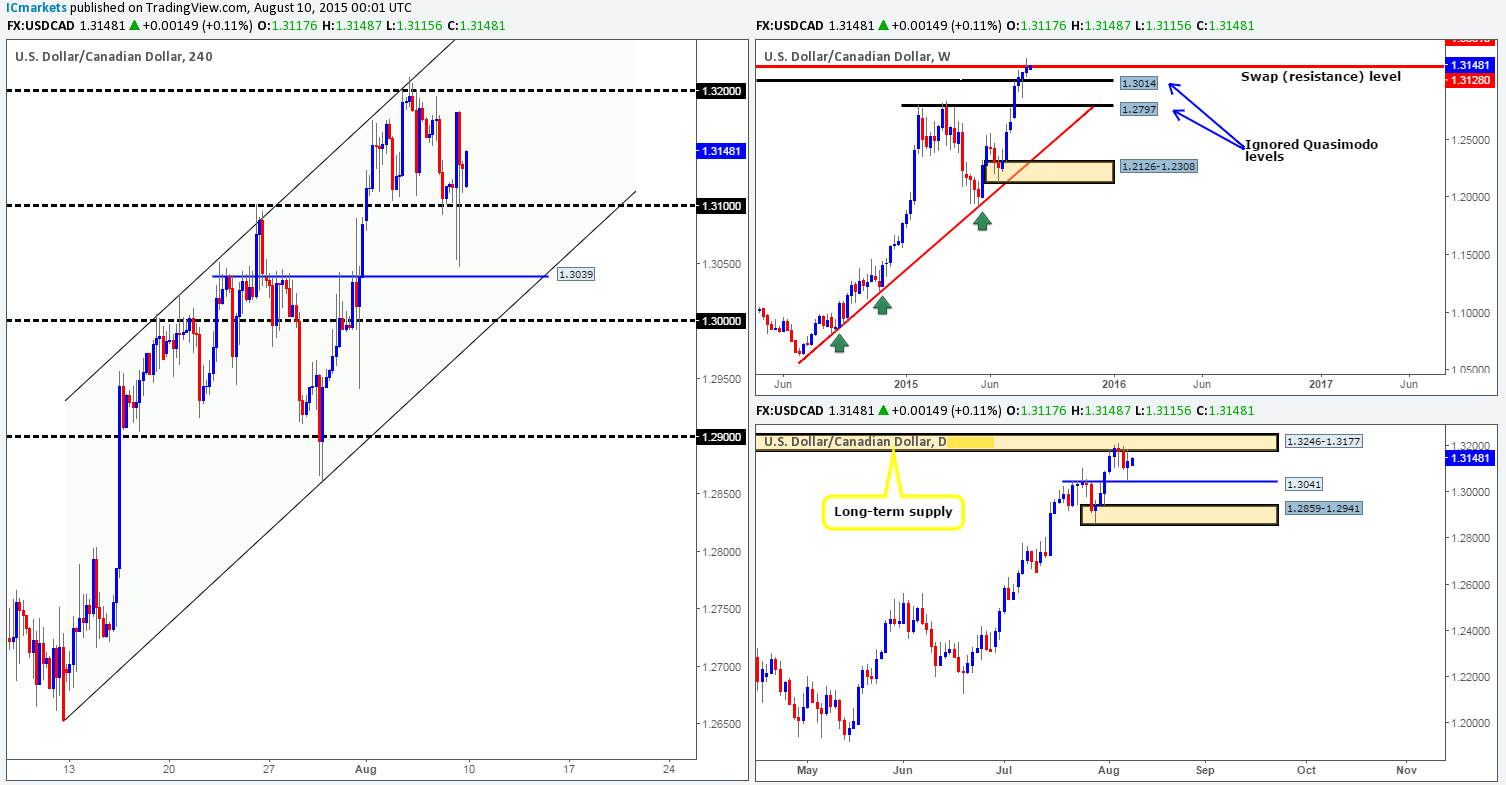
Last week’s trade saw the USD/CAD cross swords with a weekly swap (resistance) level at 1.3128 which for the best part held this market lower, consequently printing a selling tail in this process. Althoughthere were clearly active sellers within this region, the USD still posted gains close to fifty pips closing just above this weekly level by five pips at 1.3133. From the pits of the daily timeframe, however, it is clear to see that price found additional resistance from a long-term daily supply area coming in at 1.3246-1.3177, resulting in price painting a daily indecision candle, which as you can see tagged in bids from a minor daily swap (support) level at 1.3041.
Going down one more scale to the 4hr timeframe, the round number 1.3100 provided a strong floor of support during the NFP shenanigans on Friday – just look at those tails below this number! One can almost hear the sound of stop losses being hit!
Crossing over into a fresh week, however, price began with a 16-pip gap lower at the open 1.3117, which the buyers wasted no time in filling.
With offers seen holding this market lower around the long-term daily supply at 1.3246-1.3177, and bids currently controlling this pressure from a minor daily (swap) support barrier at 1.3014, trading this pair long-term or even medium-term right now may be a challenge.
Nevertheless, we certainly agree that this pair is in a humongous uptrend at present and buying into this market is indeed tempting. However, how can one look to conservatively get in on this trend? Well, from the 4hr timeframe what we would really like to see from price today, or even tomorrow, is close above 1.3200as this would not only confirm buying strength around both the weekly swap (resistance) level/long-term daily supply area, but also provide one a nice base in which to buy from should the market retest this barrier following a break higher (lower timeframe confirmation will still need to be seen here).
Levels to watch/ live orders:
- Buys:Watch for 1.3200 to be consumed and then look to enter on a confirmed retest at this number.
- Sells:Flat (Stop loss: N/A).
USD/CHF:
Weekly recap:
(The live position we took on Thursday from 0.98378 was taken out at breakeven on Friday).
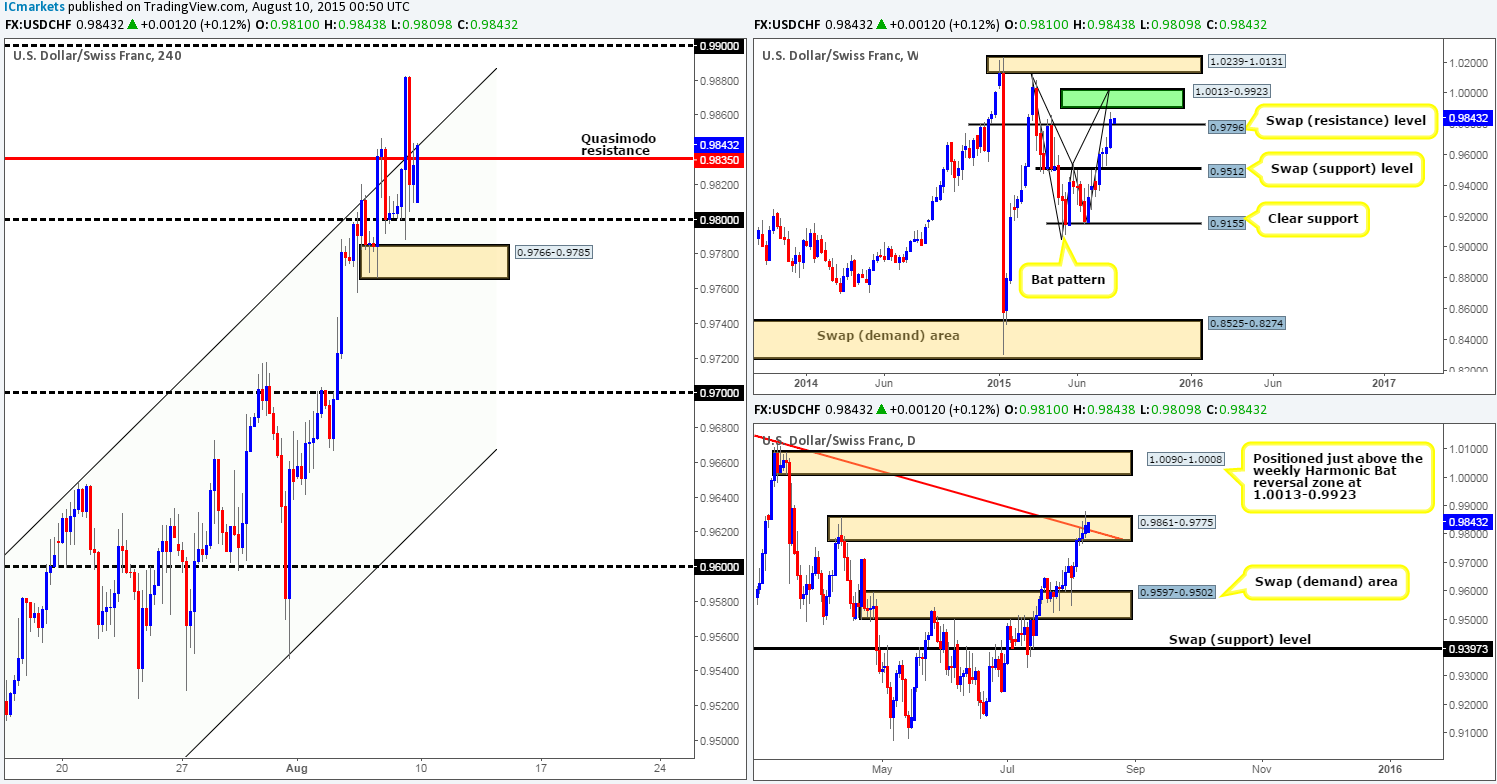
The USD/CHF pair gained an impressive 180 pips on the week, closing at 0.9831 just above a weekly swap (resistance) level coming in at 0.9796. Slipping one lower, we can see that last week’s daily movement reveals that price attacked a daily supply area seen at 0.9861-0.9775, which converges nicely with a daily trendline extended from the high 1.0239. As you can see, price did break above this area, but has yet to see a definitive close.
Trade on the 4hr timeframe, however, shows Friday’s action broke out above both the 4hr Quasimodo resistance level at 0.9835 and the 4hr ascending channel upper limit taken from the high 0.9386. This NFP induced upsurge quickly lost breath though as prices plummeted south back below the aforementioned 4hr levels to end the week.
Going forward, we can see that price gapped lower 21 pips at the opening number 0.9810. This gap, as you can probably see, was quickly filled consequently bringing prices back up above the aforementioned 4hr Quasimodo resistance level.
With all of the above taken into account, here is our two pips’ worth on where this pair may trade today and possibly into the week… With price showing room on the weekly timeframe to move further north this week up to a weekly Harmonic Bat completion zone at 1.0013-0.9923, and the fact that there was a spike above daily supply coming in at 0.9861-0.9775 (the majority of offers now likely consumed), we feel that this market is likely going to continue on its path north. Therefore, if the buyers can hold this market above the 4hr Quasimodo resistance barrier today, there may be a potential buying (retest) opportunity from here, targeting 0.9900. Assuming that price hits target today, our team will then close any long positions we may have and begin shifting into short mode since 23 pips above the 0.9900 sits the lower limit of the weekly Harmonic Bat reversal zone (see above). However, we would not recommend using the 5 or even 15 minute timeframe to look for entries within this weekly Harmonic area due to the weekly sell zone being rather large. 30/60 minute timeframes should provide adequate coverage.
Levels to watch/ live orders:
- Buys: 0.9835 [Tentative – confirmation required] (Stop loss: dependent on where one confirms this level).
- Sells: 1.0013/0.9923 [Tentative – confirmation required on the 30 or 60 minute timeframes](Stop loss: dependent on where one finds confirmation on with this area).
DOW 30:
Weekly recap:
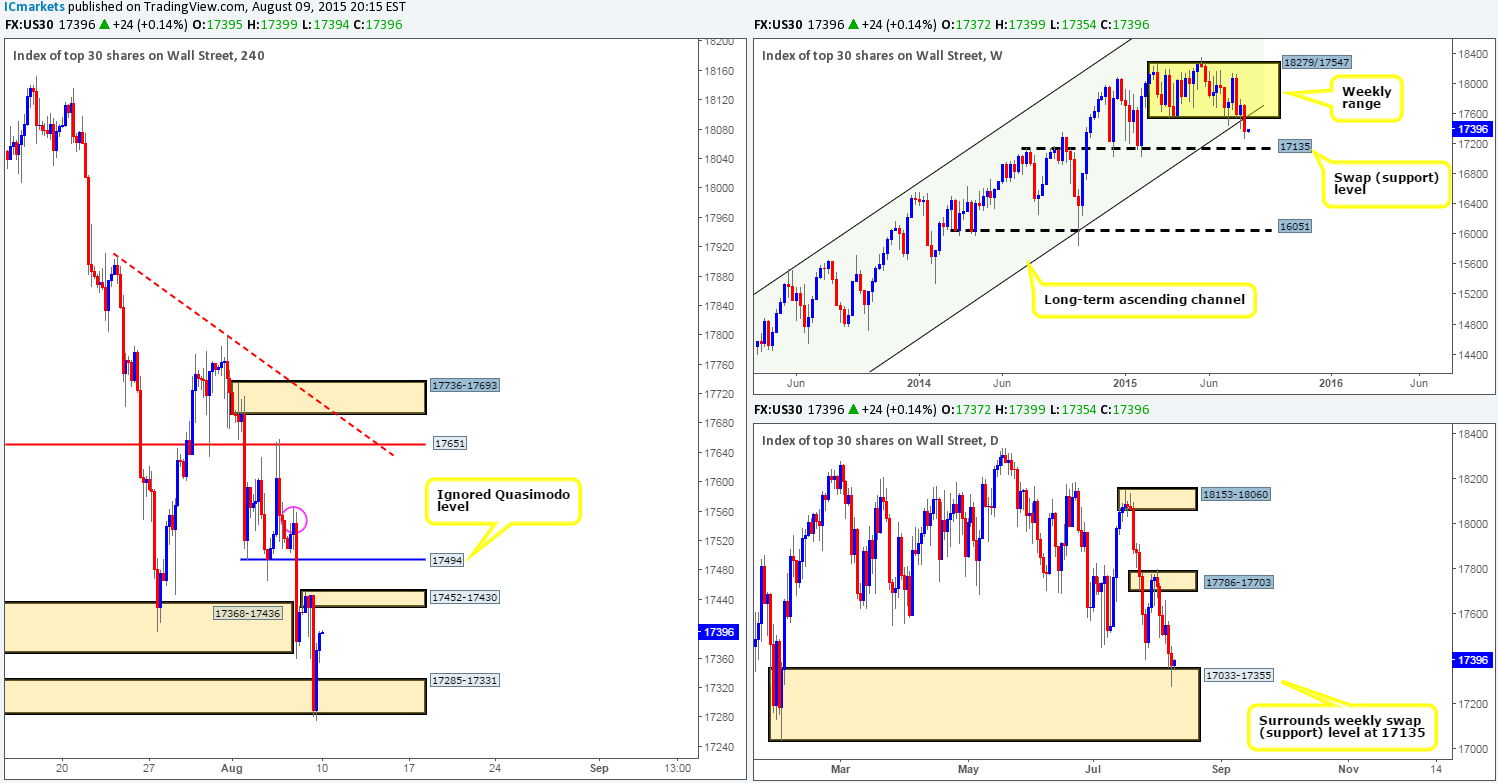
The DOW 30 index performed relatively poorly last week. Bids at both the weekly range ‘floor’ 17547 and the weekly ascending channel support taken from the low 10402 were taken out, resulting in price dropping 350 points into the close 17732. Checking in on the daily timeframe reveals that price ended the week piercing into a large daily demand area coming in at 17033-17355.
Friday’s trade on the 4hr scale, however, shows price aggressively closed below 4hr demand at 17368-17436 and slightly faked beyond a 4hr demand area just below it at 17285-17331, which triggered an 80 point surge in buying to end the week.
This week’s trade saw no change in prices over the weekend, but has, nevertheless, seen a steady wave of bids come into the market so far. From current prices, the next upside target we have noted falls in at 17452-17430 – a 4hr supply zone. As such, risk/reward considerationswould argue against any longs taken in this market right now. In addition to this, given that the weekly timeframe is now showing room to continue selling off down towards a weekly swap (support) level coming in at 17135 (see chart);we would be hesitant about going long in this market anyway even with price sitting at daily demand (remember, the higher timeframes usually take precedence over the lower timeframes).
With all of the above taken into consideration, here is what we have noted so far:
- Entering short at the small aforementioned 4hr supply area or the 4hr Quasimodo resistance level just above it at 17494 is certainly a valid trade in our book (with lower timeframe confirming price action) considering the room to move lower on the weekly scale (see above).
- No buy trades shall be considered in this market this week until we see either an attack on the 4hr Quasimodo support level seen much lower at 17131 (lines up perfectly with the weekly swap [support] level at 17135) mentioned above), or the above said 4hr areas are taken out. Even with these areas out of the picture though, buyers will likely have to contend with selling pressure from the 4hr supply zone seen marked with a pink circle at 17566-17529, so be careful trading in this region!
Levels to watch/ live orders:
- Buys: 17131 [Tentative – confirmation required] (Stop loss: dependent on where one confirms this level). Sells: 17452-17430 [Tentative – confirmation required] (Stop loss: dependent on where one confirms this area) 17494 [Tentative – confirmation required] (Stop loss: dependent on where one confirms this level).
XAU/USD: (Gold)
Weekly recap:
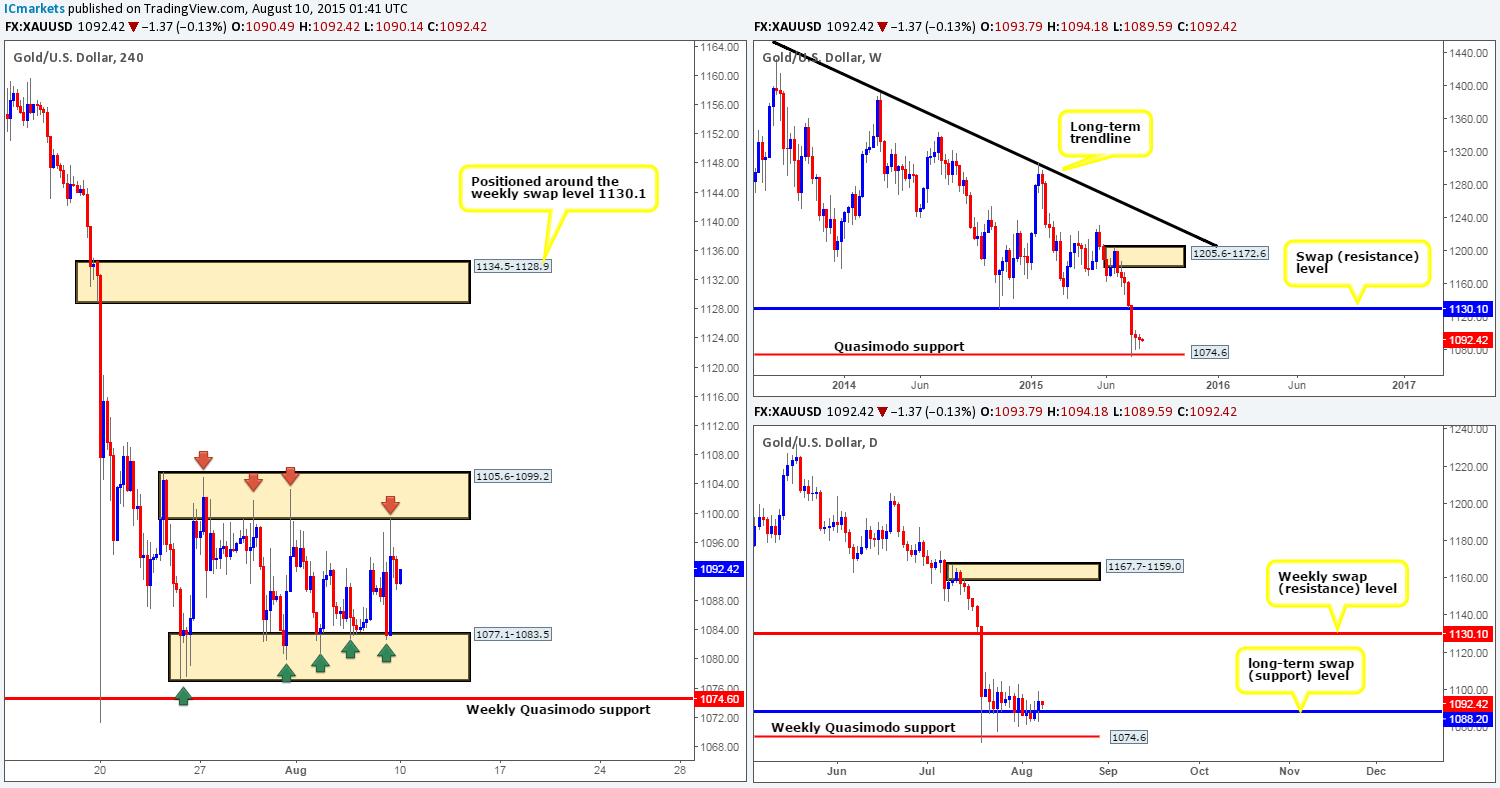
Ever since price crossed paths with the weekly Quasimodo support barrier at 1074.6, the Gold market has been relatively quiet with very little gains/losses to report. That being said, however, during this quiet spell, price action painted back-to-back buying tails on the weekly timeframe, which suggests there are still willing bids in and around this region. Turning our attention to the daily timeframe, we can see that price has spent the last two weeks hugging a long-term daily swap (support) barrier at 1088.2, which sits just above the aforementioned weekly Quasimodo support.Finishing up with the 4hr timeframe, Friday’s trade shows that price continued to Ping-Pong within its current supporting barriers last week – the 4hr demand at 1077.1-1083.5 and 4hr supply at 1105.6-1099.2.
This morning’s opening price 1093.7 saw a steady wave of offers come into this market, consequently pushing prices back into the current 4hr range.
In the event that the buyers can successfully hold out above the aforementioned long-term daily swap (support) barrier today/tomorrow, we feel that with this – and the fact that price is still trading above the weekly Quasimodo support may attract buyers into this market.
Given the points made above, there are two avenues we’re currently looking at today/this week:
- Trade the limits of the present 4hr consolidation zone (watch for a fakeout below this range though into the weekly Quasimodo support). Our team has come to a general consensus that entering long or short within this area will require lower timeframe confirmation before a position is considered.
- In the event that price closes above the upper limit of the 4hr range, the path north would then likely be clear for buying up the 4hr supply zone sitting at 1134.5-1128.9 (conveniently positioned around the weekly swap [resistance] level at 1130.1). However, to trade this potentially humongous move, we’d require a retest of this broken zone as demand along with corresponding lower timeframe price action confirmation.
Levels to watch/ live orders:
- Buys: 1077.1-1083.5[Tentative – confirmation required] (Stop loss: dependent on where one finds confirmation in this area). Watch for 1105.6-1099.2 to be consumed and then look to enter on a confirmed retest seen at this area.
- Sells: 1105.6-1099.2[Tentative – confirmation required] (Stop loss: dependent on where one finds confirmation in this area).

