DXY (US Dollar Index):
Potential Direction: Bullish
Overall momentum of the chart: Bearish
Price could potentially make a bullish bounce off pivot and head towards 1st resistance.
Pivot: 100.52
Supporting reasons: Swing high resistance, which could act as a significant level for a potential bounce.
1st support: 99.75
Supporting reasons: Multi-swing low support, with confluence from the 161.80% Fibonacci Extension, indicating a strong support area.
1st resistance: 101.78
Supporting reasons: Multi-swing high resistance, likely to be a key resistance level if the price moves higher.

EUR/USD:
Potential Direction: Bearish
Overall momentum of the chart: Bullish
Price could potentially make a bearish reaction off pivot and drop to 1st support.
Pivot: 1.1151
Supporting reasons: An overlap resistance, which may provide a significant level for a bearish reaction.
1st support: 1.0979
Supporting reasons: An overlap support with 50% Fibonacci Retracement, indicating a potential area where the price may find support if it drops.
1st resistance: 1.1274
Supporting reasons: Swing high resistance, which may be a key level if the price moves higher.

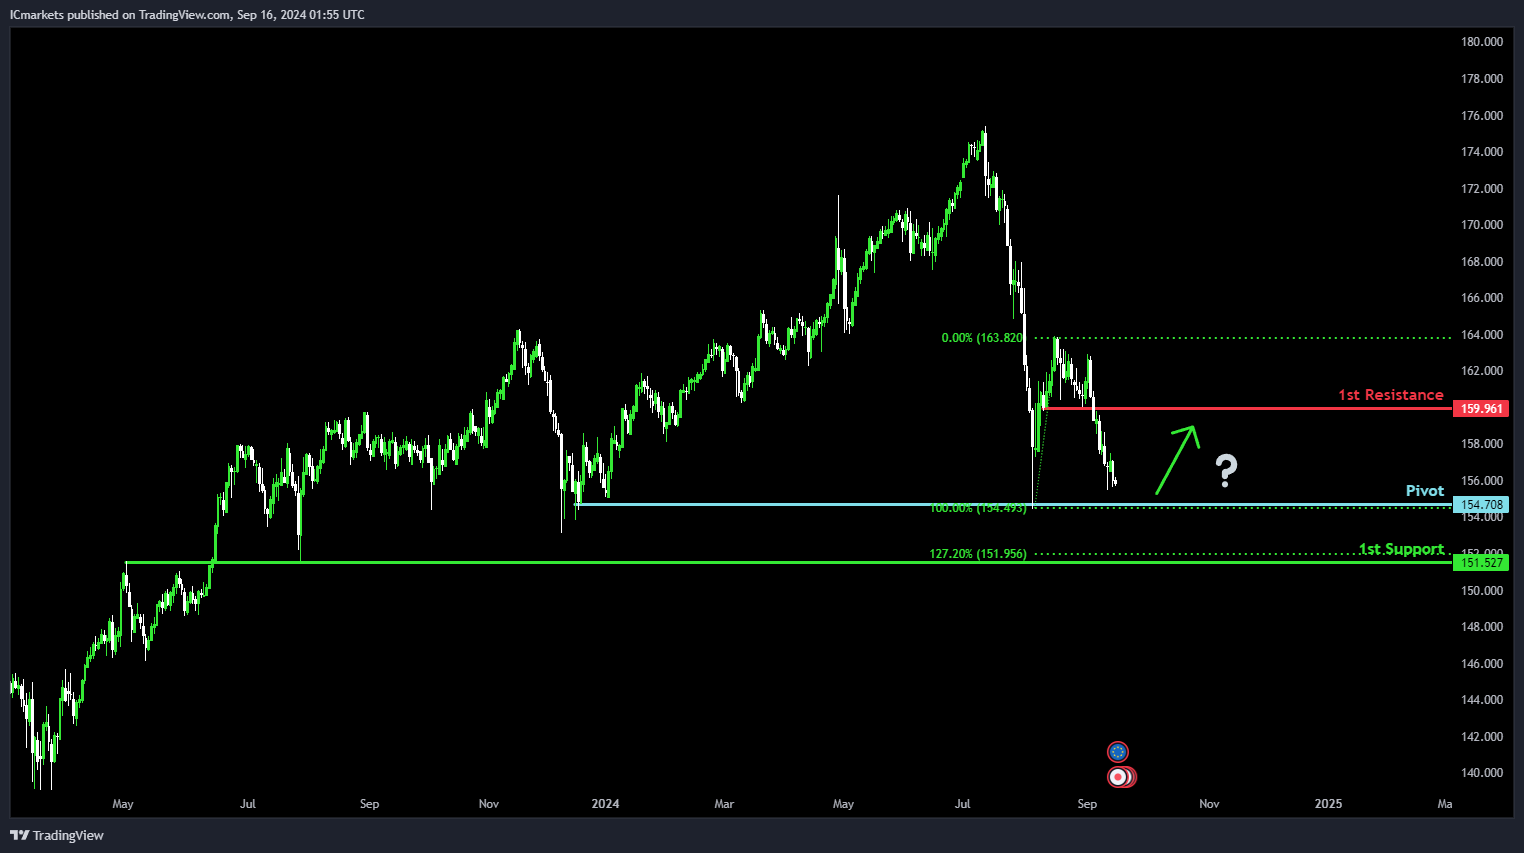
EUR/JPY:
Potential Direction: Bullish
Overall momentum of the chart: Bearish
Price could potentially make a bullish bounce off pivot and head towards 1st resistance.
Pivot: 154.70
Supporting reasons: Multi-swing low support, which may provide a key level for a bullish bounce.
1st support: 151.52
Supporting reasons: An overlap support with 127.20% Fibonacci Extension, indicating a strong support level.
1st resistance: 159.96
Supporting reasons: Pullback resistance, is likely to be a significant level if the price advances.
EUR/GBP:
Potential Direction: Bearish
Overall momentum of the chart: Bearish
Price could potentially make a bearish reaction off pivot and drop to 1st support.
Pivot: 0.8490
Supporting reasons: Pullback resistance, reinforced by 38.20% Fibonacci Retracement, making it a significant level for potential bearish reaction.
1st support: 0.8407
Supporting reasons: Multi-swing low support, providing a key level where the price may find support if the bearish trend continues.
1st resistance: 0.8533
Supporting reasons: Pullback resistance with 61.80% Fibonacci Retracement, suggesting it could act as a strong resistance if the price rebounds.

GBP/USD:
Potential Direction: Bearish
Overall momentum of the chart: Bearish
Price could potentially make a bearish reaction off pivot and drop to 1st support.
Pivot: 1.3182
Supporting reasons: An Overlap resistance, reinforced by 61.80% Fibonacci Retracement, indicating a key level where the price might face resistance and trigger a bearish reaction.
1st support: 1.3009
Supporting reasons: An Overlap support, reinforced by 38.20% Fibonacci Retracement, providing a significant level where the price might find support if the bearish trend continues.
1st resistance: 1.3266
Supporting reasons: Swing high resistance, which might act as a barrier for any potential price rebounds.

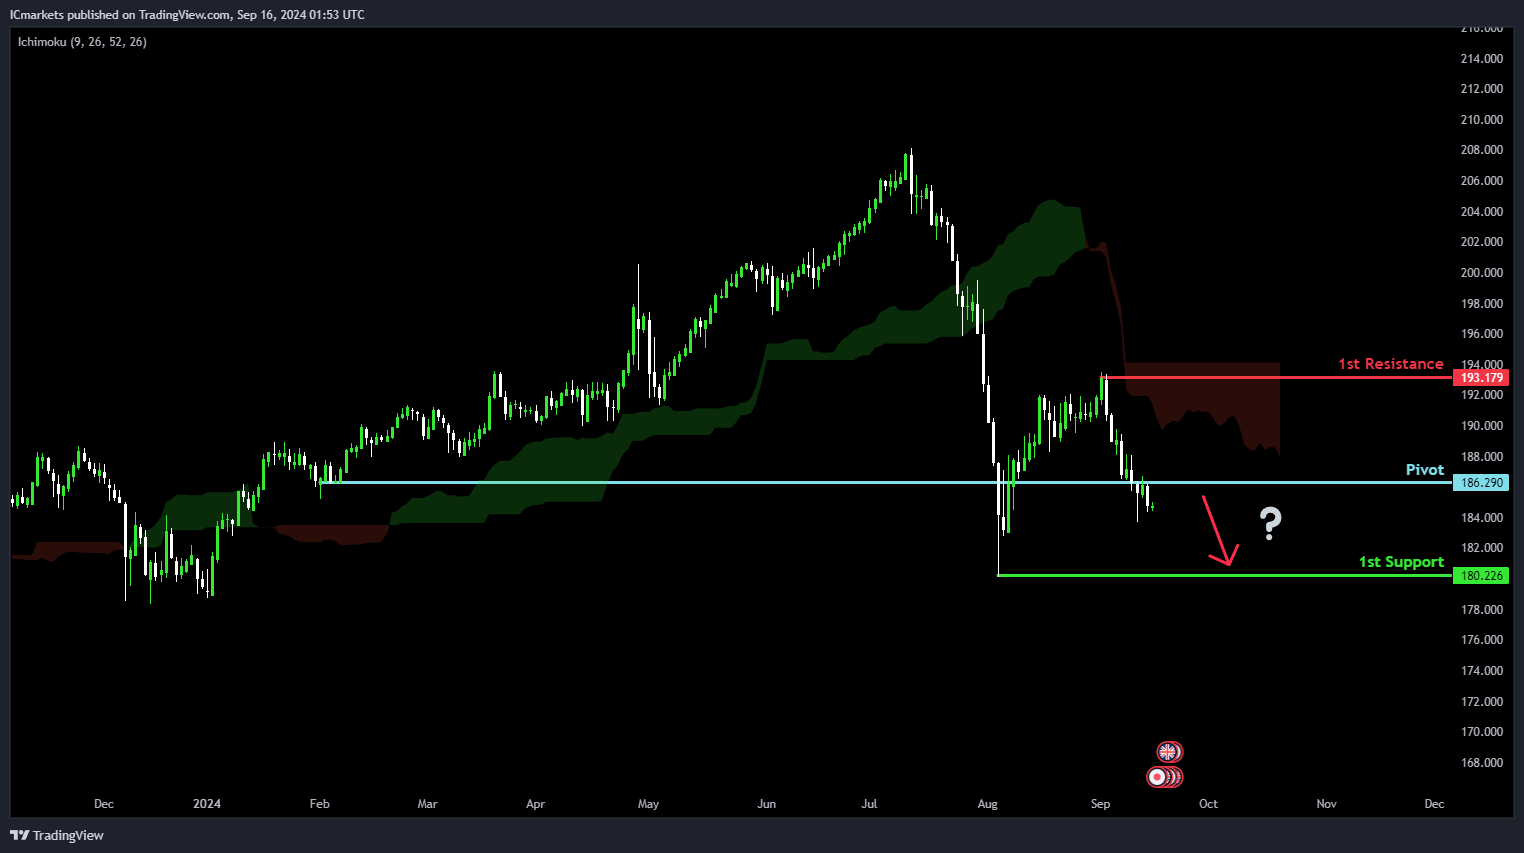
GBP/JPY:
Potential Direction: Bearish
Overall momentum of the chart: Bearish
Factors contributing to the momentum: Price is below the bearish Ichimoku cloud.
Price could potentially make a bearish continuation towards 1st support.
Pivot: 186.29
Supporting reasons: An Overlap resistance, indicating a key level where the price might encounter resistance and trigger further bearish movement.
1st support: 180.22
Supporting reasons: Swing low support, which could act as a significant level where the price may find support if the bearish trend persists.
1st resistance: 193.17
Supporting reasons: Swing high resistance, serving as a potential barrier for any upward price movement.
USD/CHF:
Potential Direction: Neutral
Overall momentum of the chart: Bearish
Price could potentially fluctuate between the 1st resistance and 1st support level.
1st support: 0.8394
Supporting reasons: Multi-swing low support, indicating a level where price has historically found support and could potentially stabilize.
1st resistance: 0.8555
Supporting reasons: An Overlap resistance, suggesting a level where price may encounter resistance and struggle to advance further.

USD/JPY:
Potential Direction: Bearish
Overall momentum of the chart: Bearish
Factors contributing to the momentum: Price is below the bearish Ichimoku cloud, indicating a prevailing bearish trend.
Price could potentially make a: Bearish continuation towards 1st support.
Pivot: 144.04
Supporting reasons: An Overlap resistance, where price has historically struggled to move above, reinforcing the bearish outlook.
1st support: 137.95
Supporting reasons: Swing low support, reinforced by the 161.80% Fibonacci Extension, suggesting a strong level where price may find significant support if the bearish trend continues.
1st resistance: 149.42
Supporting reasons: Swing high resistance, indicating a level where price may face difficulty moving beyond if a reversal or retracement occurs.

USD/CAD:
Potential Direction: Bullish
Overall momentum of the chart: Neutral
Price is falling towards the pivot and could potentially make a bullish bounce off this level to rise towards the 1st resistance.
Pivot: 1.3547
Supporting reasons: Identified as an overlap support that aligns with a 38.2% Fibonacci retracement, suggesting a potential area where buying interests could pick up to stage a minor rebound.
1st support: 1.3439
Supporting reasons: Identified as a multi-swing-low support, indicating a key level where price has found strong support in the past.
1st resistance: 1.3616
Supporting reasons: Identified as a swing-high resistance that aligns close to a 38.2% Fibonacci retracement, indicating a potential area that could halt any further upward movement. The presence of the bearish Ichimoku Cloud adds further significance to the downward momentum.

AUD/USD:
Potential Direction: Bearish
Overall momentum of the chart: Neutral
Price could rise towards the pivot and potentially reverse off this level to drop towards the 1st support.
Pivot: 0.6798
Supporting reasons: Identified as a multi-swing-high resistance, suggesting a potential level where selling interests could intensify.
1st support: 0.6645
Supporting reasons: Identified as a swing-low support that aligns with a 38.2% Fibonacci retracement, indicating a key level where price has recently found support.
1st resistance: 0.6882
Supporting reasons: Identified as a multi-swing-high resistance that aligns with a 127.2% Fibonacci extension, indicating a potential area that could halt any further upward movement.

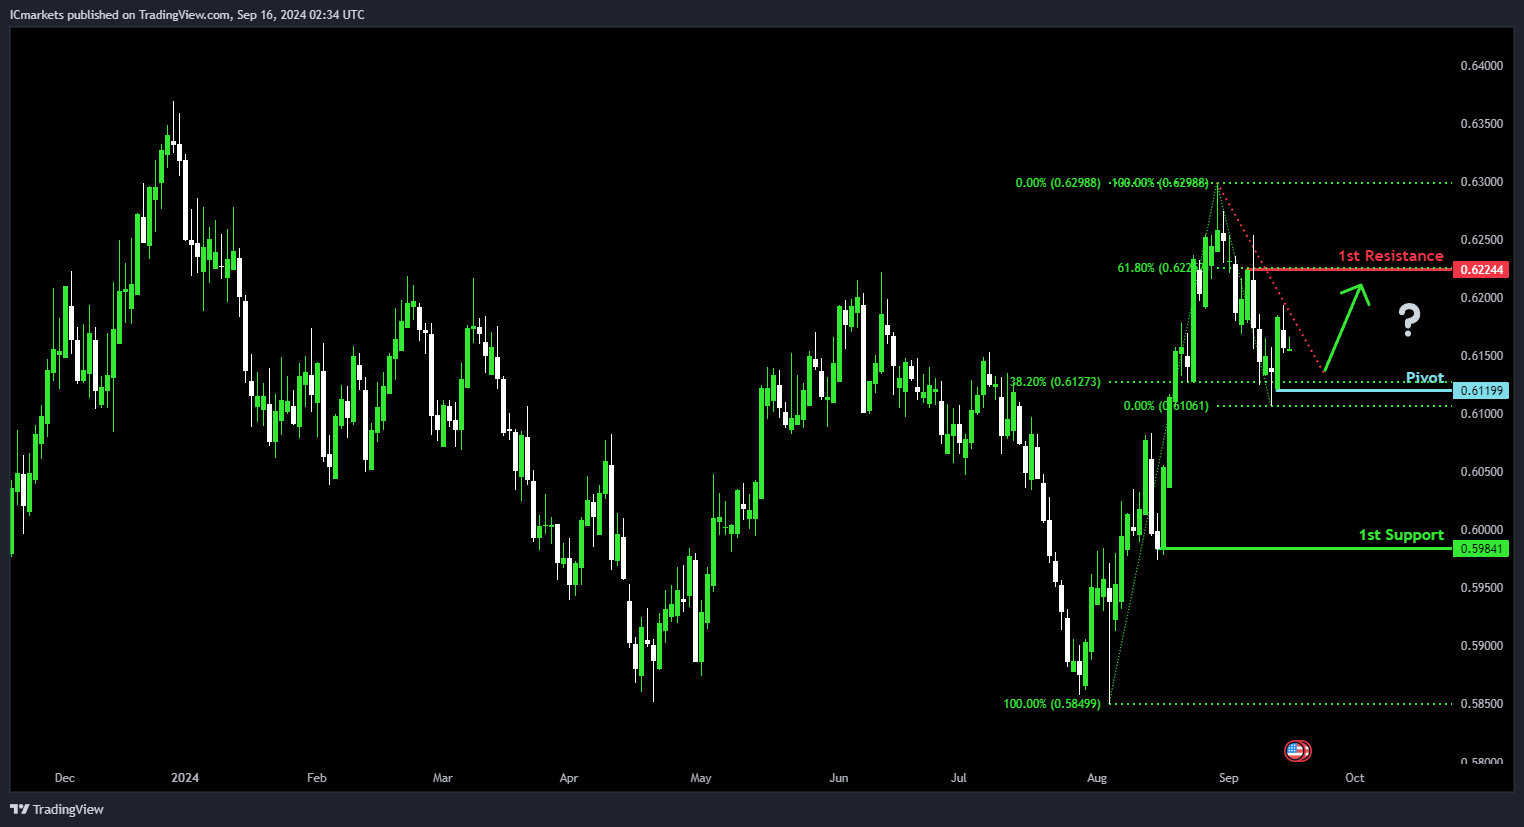
NZD/USD
Potential Direction: Bullish
Overall momentum of the chart: Neutral
Price could fall towards the pivot and potentially make a bullish bounce off this level to rise towards the 1st resistance.
Pivot: 0.6119
Supporting reasons: Identified as a swing-low support that aligns close to a 38.2% Fibonacci retracement, suggesting a potential level where buying interests could pick up to stage a minor rebound.
1st support: 0.5984
Supporting reasons: Identified as a swing-low support, indicating a potential level where price has found strong support in the past.
1st resistance: 0.6224
Supporting reasons: Identified as a pullback resistance that aligns with a 61.8% Fibonacci retracement, indicating a potential area that could halt any further upward movement.
US30 (DJIA):
Potential Direction: Bearish
Overall momentum of the chart: Neutral
Price is rising towards the pivot and could potentially make a bearish reversal off this level to pull back towards the 1st support.
Pivot: 41,604.84
Supporting reasons: Identified as a swing-high resistance that aligns close to the all-time high, suggesting a potential area where selling pressures could intensify.
1st support: 40,202.56
Supporting reasons: Identified as a swing-low support that aligns close to a 50% Fibonacci retracement, indicating a key level where price has found support recently.
1st resistance: 42,532.73
Supporting reasons: Identified as a resistance that aligns with a 78.6% Fibonacci projection, indicating a potential area that could halt any further upward movement.

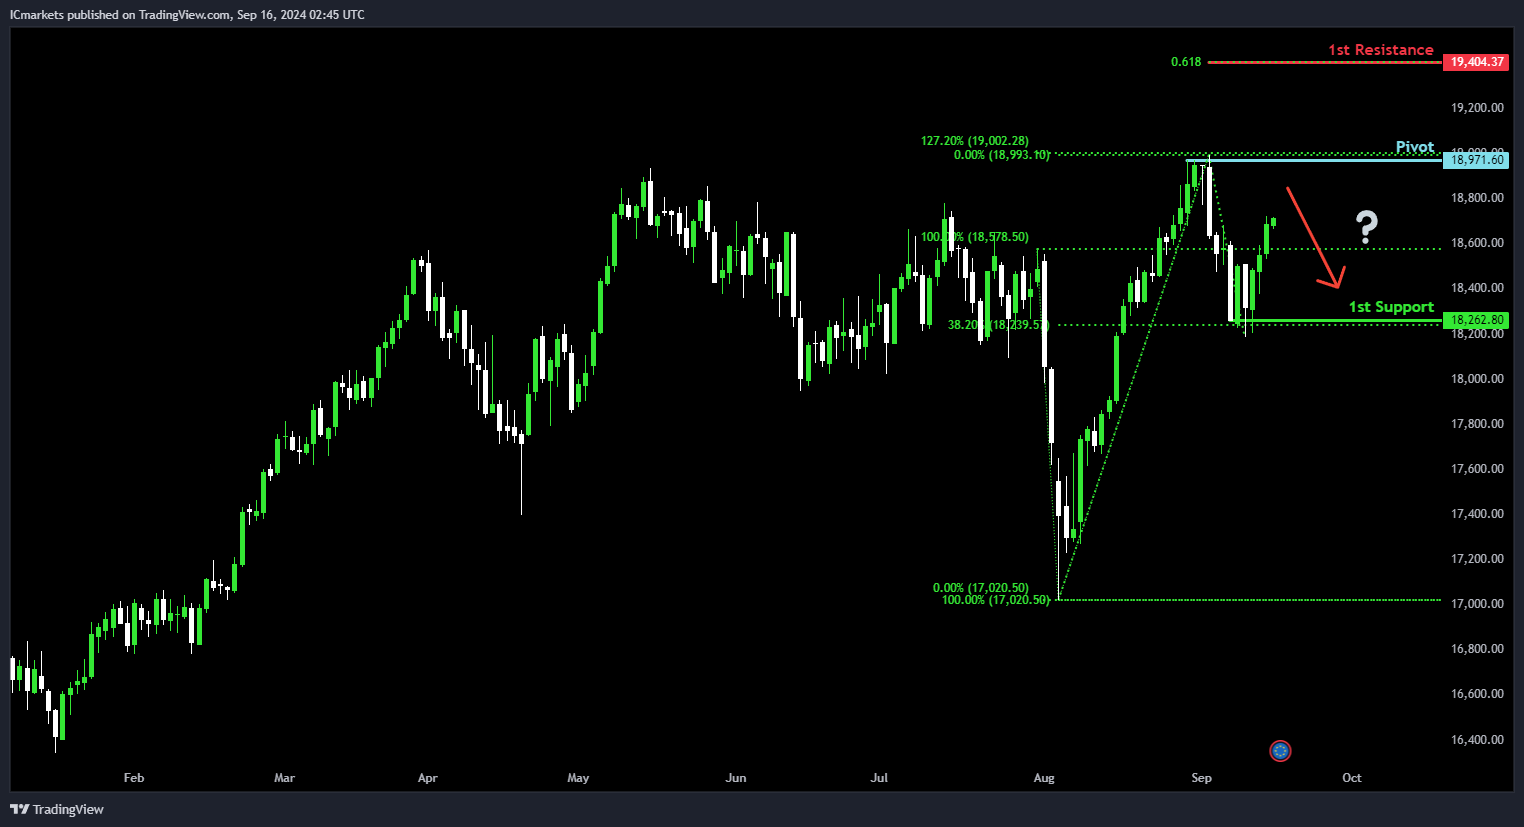
DE40 (DAX):
Potential Direction: Bearish
Overall momentum of the chart: Neutral
Price is rising towards the pivot and could potentially make a bearish reversal off this level to pull back towards the 1st support.
Pivot: 18,971.60
Supporting reasons: Identified as a swing-high resistance that aligns with a 127.2% Fibonacci extension, suggesting a potential area where selling pressures could intensify.
1st support: 18,262.80
Supporting reasons: Identified as a swing-low support that aligns with a 38.2% Fibonacci retracement, indicating a key level where price has found support recently.
1st resistance: 19,404.37
Supporting reasons: Identified as a resistance that aligns with a 61.8% Fibonacci projection, indicating a potential area that could halt any further upward movement.
US500 (S&P 500):
Potential Direction: Bearish
Overall momentum of the chart: Neutral
Price is rising towards the pivot and could potentially make a bearish reversal off this level to pull back towards the 1st support.
Pivot: 5,669.89
Supporting reasons: Identified as a multi-swing-high resistance that aligns close to the all-time high, suggesting a potential area where selling pressures could intensify.
1st support: 5,385.30
Supporting reasons: Identified as a swing-low support that aligns close to a 50% Fibonacci retracement, indicating a key level where price has found support recently.
1st resistance: 5,830.11
Supporting reasons: Identified as a resistance that aligns with a 78.6% Fibonacci projection, indicating a potential area that could halt any further upward movement.

BTC/USD (Bitcoin):
Potential Direction: Bullish
Overall momentum of the chart: Neutral
Price is falling towards the pivot and could potentially make a bullish bounce off this level to rise towards the 1st resistance.
Pivot: 53,776.62
Supporting reasons: Identified as a multi-swing-low support, suggesting a potential level where buying interests could pick up to stage a rebound.
1st support: 49,048.70
Supporting reasons: Identified as an overlap support that aligns with a 50% Fibonacci retracement, indicating a key level where price has found strong in the past.
1st resistance: 60,529.00
Supporting reasons: Identified as a swing-high resistance that aligns with a 61.8% Fibonacci retracement, indicating a potential area that could halt any further upward movement.

ETH/USD (Ethereum):
Potential Direction: Bullish
Overall momentum of the chart: Neutral
Price is falling towards the pivot and could potentially make a bullish bounce off this level to rise towards the 1st resistance.
Pivot: 2,135.44
Supporting reasons: Identified as an overlap support that aligns close to a 78.6% Fibonacci retracement, suggesting a potential level where buying interests could pick up to stage a rebound.
1st support: 1,729.30
Supporting reasons: Identified as an overlap support, indicating a potential level where price could find strong.
1st resistance: 2,553.98
Supporting reasons: Identified as an overlap resistance that aligns with a 61.8% Fibonacci retracement, indicating a potential area that could halt any further upward movement. The presence of the bearish Ichimoku Cloud adds further significance to the downward momentum.

WTI/USD (Oil):
Potential Direction: Bullish
Overall momentum of the chart: Bearish
Price is falling towards the pivot and could potentially make a bullish bounce off this level to rise towards the 1st resistance.
Pivot: 66.34
Supporting reasons: Identified as a multi-swing-low support that aligns close to a 161.8% Fibonacci extension, suggesting a potential level where buying interests could pick up to stage a minor rebound.
1st support: 61.79
Supporting reasons: Identified as a multi-swing-low support that aligns close to a 61.8% Fibonacci projection, indicating a key level where price could find strong support.
1st resistance: 70.35
Supporting reasons: Identified as an overlap resistance that aligns with a 38.2% Fibonacci retracement, indicating a potential area that could halt any further upward movement. The presence of the bearish Ichimoku Cloud adds further significance to the downward momentum.

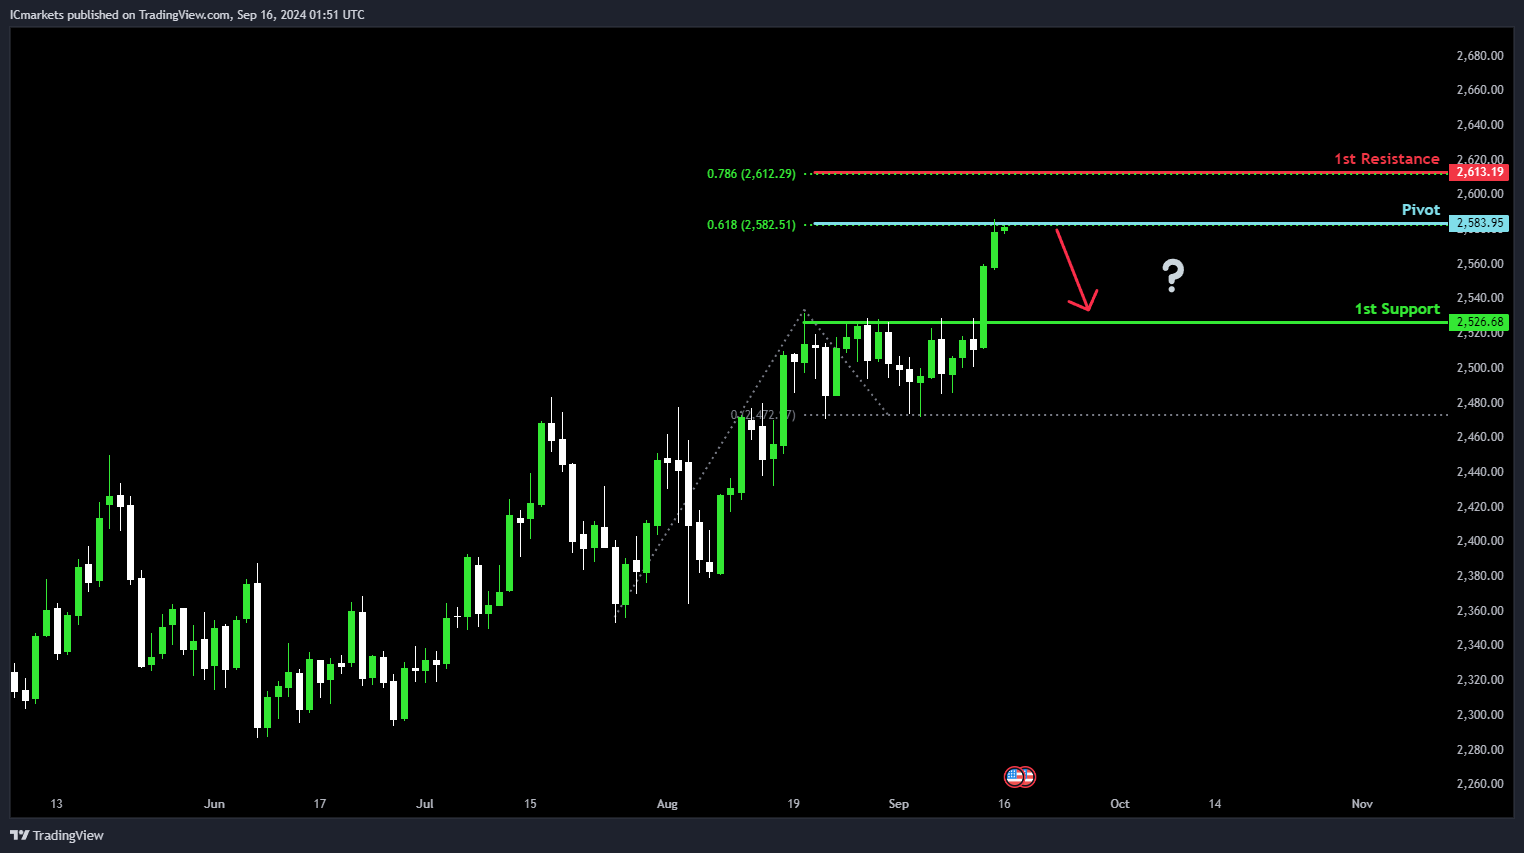
XAU/USD (GOLD):
Potential Direction: Bearish
Overall momentum of the chart: Bullish
Factors contributing to the momentum: Despite the overall bullish trend, there is a potential bearish reaction expected.
Price could potentially make a: Bearish reaction off pivot and drop to 1st support.
Pivot: 2583.95
Supporting reasons: 61.80% Fibonacci Projection, indicating a level where price might face resistance and reverse.
1st support: 2526.68
Supporting reasons: Pullback support, a key level where price has previously found support and may again.
1st resistance: 2613.19
Supporting reasons: 78.60% Fibonacci Projection, suggesting a significant resistance level if the bullish trend continues.
The accuracy, completeness and timeliness of the information contained on this site cannot be guaranteed. IC Markets does not warranty, guarantee or make any representations, or assume any liability regarding financial results based on the use of the information in the site.
News, views, opinions, recommendations and other information obtained from sources outside of www.icmarkets.com, used in this site are believed to be reliable, but we cannot guarantee their accuracy or completeness. All such information is subject to change at any time without notice. IC Markets assumes no responsibility for the content of any linked site.
The fact that such links may exist does not indicate approval or endorsement of any material contained on any linked site. IC Markets is not liable for any harm caused by the transmission, through accessing the services or information on this site, of a computer virus, or other computer code or programming device that might be used to access, delete, damage, disable, disrupt or otherwise impede in any manner, the operation of the site or of any user’s software, hardware, data or property.