Key risk events today:
UK Manufacturing PMI; OPEC Meetings; US ISM Manufacturing PMI; China Caixin Manufacturing PMI.
EUR/USD:
Weekly gain/loss: -0.01%
Weekly close: 1.1367
Weekly perspective:
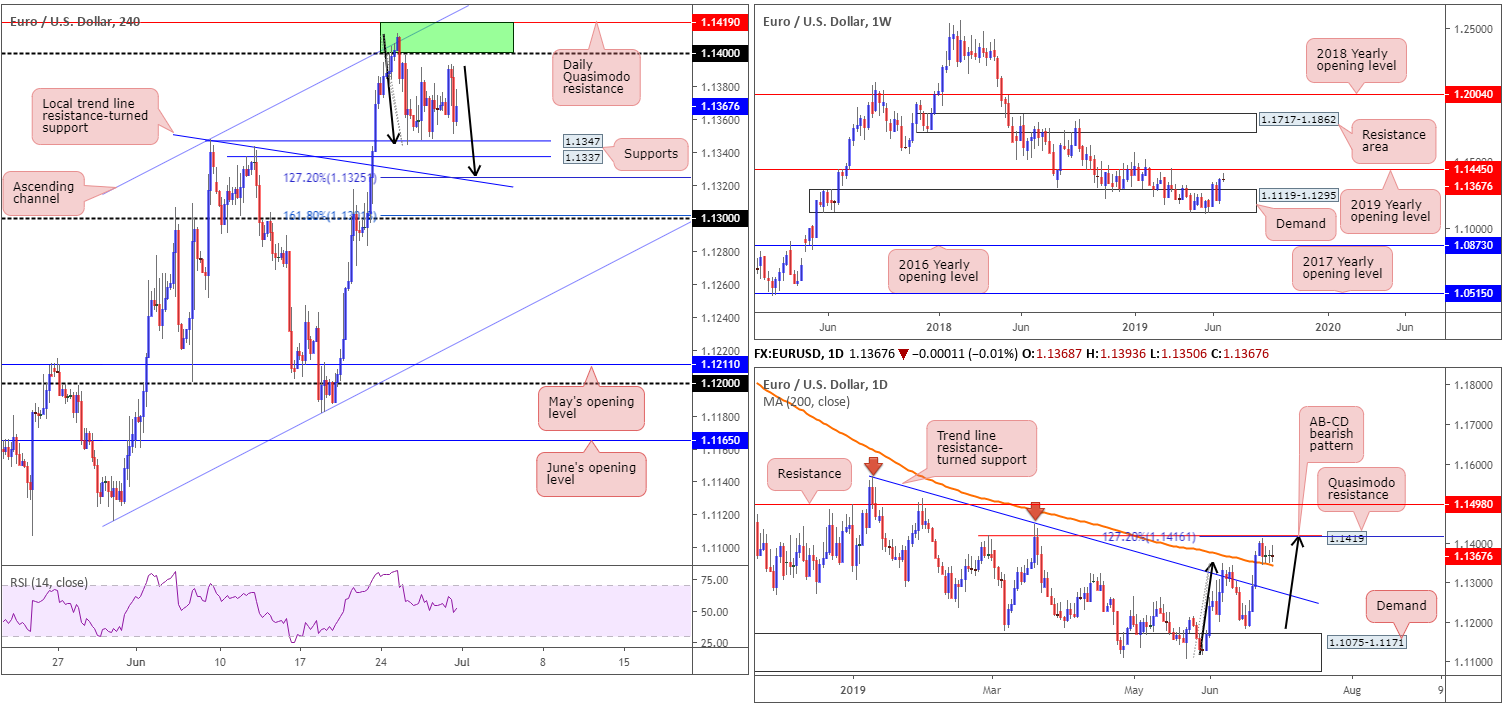
Ranging no more than 70 points, direction was somewhat limited in recent trading. The week prior, by means of a near-full-bodied bullish candle, nonetheless, added more than 160 points out of a long-standing demand area at 1.1119-1.1295.
Continued bidding this week will bring the 2019 yearly opening level (resistance) back to light at 1.1445. Traders may also want to acknowledge the overall trend remains facing in a southerly direction since topping in early 2018. For that reason, 1.1445 is likely to act as strong resistance should it enter the mix.
Daily perspective:
Daily movement, on the other hand, remains sandwiched between a Quasimodo resistance at 1.1419 as well as its merging 127.2% AB=CD – black arrows – bearish pattern at 1.1416, and a 200-day SMA positioned close by at around 1.1341ish. Note mid-week onwards chalked up consecutive indecision candles just north of the said SMA.
Areas outside of the border to have on the watchlist this week can be seen around resistance drawn from 1.1498 and a trend line resistance-turned support extended from the high 1.1569.
H4 perspective:
Macroeconomic data out of both the US and Europe was largely ignored Friday, as price continued to emphasise a consolidative phase into the close. The market clearly remains on the sidelines ahead of the critical trade talks at the G20 summit in Japan, Osaka.
With little change observed, particularly mid-week onwards, the H4 candles continue to fluctuate between a collection of supports at 1.1337/1.1347 (as well as a nearby trend line resistance-turned support taken from the high 1.1347), and the round number 1.14.
In addition to the H4 structures mentioned, higher-timeframe action adds additional weight: daily Quasimodo resistance at 1.1419 (positioned just north of 1.14 – green zone) and the 200-day SMA currently intersecting with the two noted H4 supports.
Areas of consideration:
Depending on the outcome of the G20 meeting, two scenarios remain in view, according to our technical studies:
- Additional selling could bring about a H4 127.2% AB=CD completion (black arrows) at the H4 trend line resistance-turned support highlighted above (1.1325). This, given its close connection with the 200-day SMA on the daily timeframe, underscores a potential long opportunity with stop-loss placement best set beyond the 161.8% extension point at 1.1301.
- Another reaction from the H4 green resistance area at 1.1419/1.14 may develop should we push for higher ground, though traders are urged to wait for additional candlestick confirmation to form before pulling the trigger (entry/risk levels can be determined according to the candlestick’s structure) for two reasons. Firstly, the area has already been tested and could be weak, and secondly let’s remember weekly action shows room to press north towards 1.1445.
GBP/USD:
Weekly gain/loss: -0.36%
Weekly close: 1.2694
Weekly perspective:
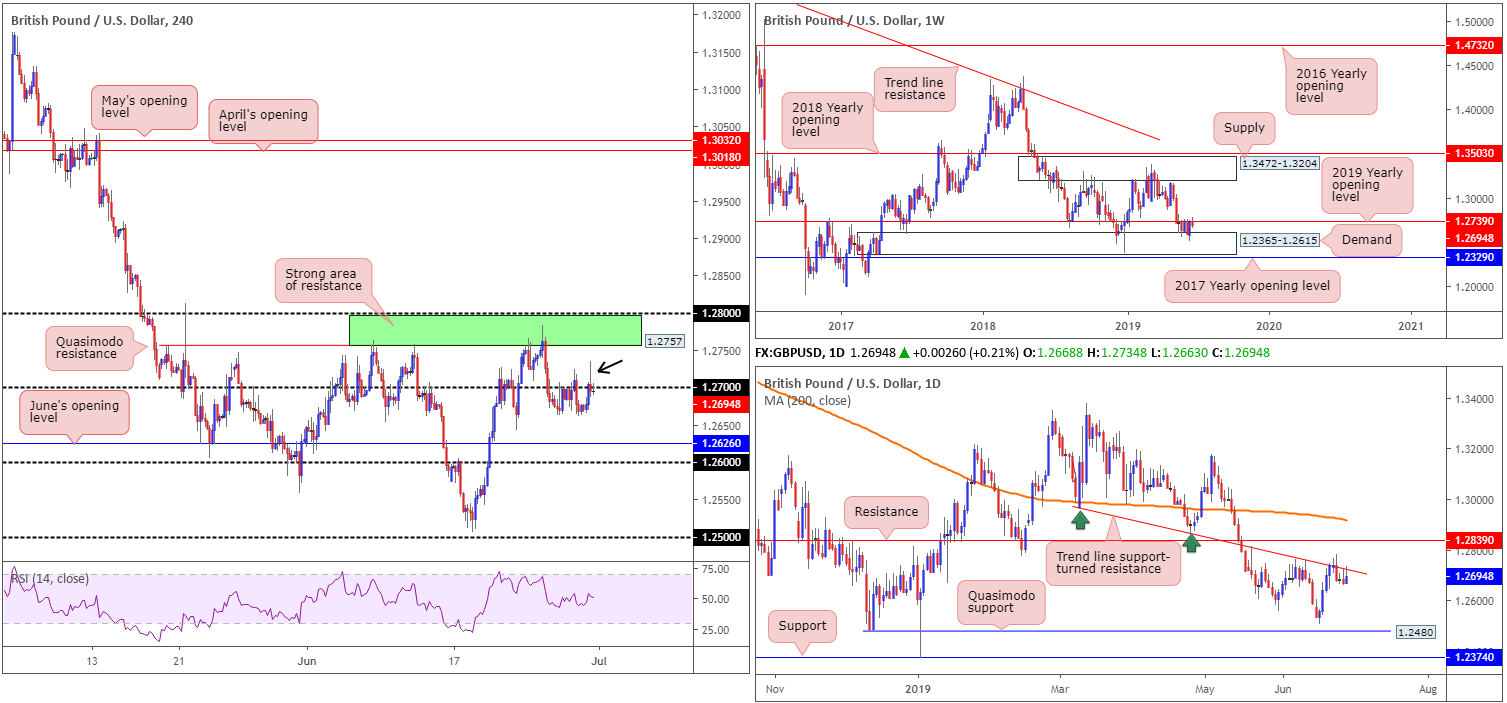
In similar fashion to our previous weekly report, buyers and sellers remain warring for position between long-standing demand at 1.2365-1.2615 and the 2019 yearly opening level at 1.2739, since May 20.
Areas outside of this border to be conscious of fall in around the 2017 yearly opening level at 1.2329 (support) and supply coming in at 1.3472-1.3204. Traders may also wish to acknowledge the unit is currently seen defending the underside of the 2019 yearly opening level, so selling may ensue this week.
Daily perspective:
In tandem with the 2019 yearly opening level at 1.2739 on the weekly timeframe, daily movement concluded the week chalking up back-to-back bearish selling candles off the underside of a trend line support-turned resistance taken from the low 1.2960. Beyond here, traders’ crosshairs are likely fixed on resistance drawn from 1.2839, whereas a move lower has Quasimodo support at 1.2480 to target.
H4 perspective:
Friday’s movement on the H4 timeframe spiked to a high of 1.2734 in the opening hours of US trade, though, once again, failed to sustain gains above 1.27. Although recent moves may be attributed to month-end flows, low volatility continued to persist ahead of the G20 summit in Japan and the meeting between US President Trump and Chinese President Xi.
With the underside of 1.27 continuing to serve as resistance, visible nearby structure worth noting falls in around June’s opening level at 1.2626 (support), followed closely by 1.26. To the upside, we also have a reasonably long-standing resistance area formed by 1.28 and a Quasimodo resistance at 1.2757 (green zone).
Areas of consideration:
Traders who remain short from 1.2757 should already have reduced risk to breakeven and liquidated partial profits before the weekly close. With a little help from 1.27 serving as resistance, as highlighted in recent reports, the next take-profit target: June’s opening level at 1.2626 may enter the fray today.
In addition to the above, Thursday’s report touched on the possibility of pyramiding the current sell position on the retest of 1.27, targeting the said H4 supports mentioned above.
Friday’s H4 shooting star pattern (black arrow) could be enough to draw in sellers today and target 1.2626 (entry and risk can be determined according to the said candlestick structure). This, of course, all depends on the outcome of the G20 summit and the market’s response at the open.
AUD/USD:
Weekly gain/loss: +1.41%
Weekly close: 0.7021
Weekly perspective:
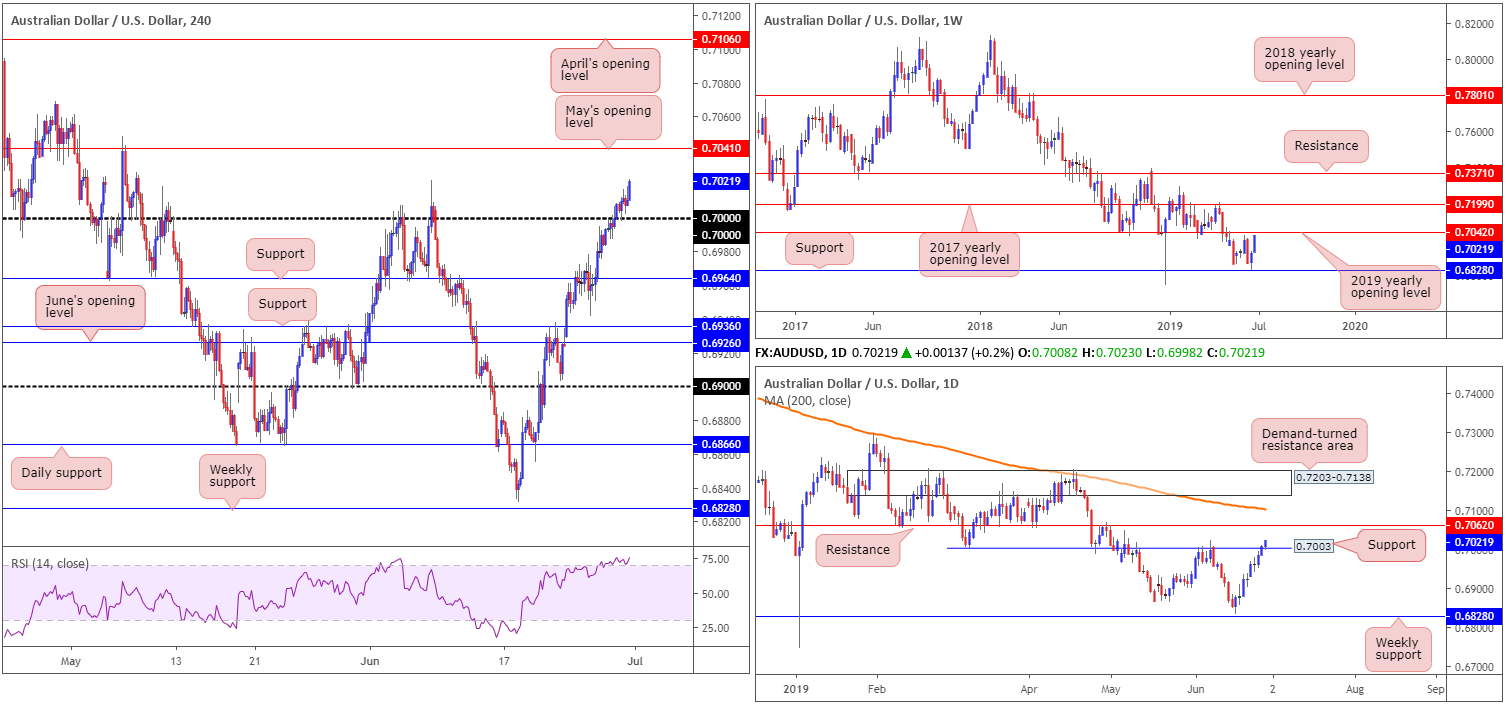
In the shape of a full-bodied bullish candle, last week’s movement added more than 95 points and positioned the unit within striking distance of the 2019 yearly opening level at 0.7042. This followed a near-test of support at 0.6828 the week prior.
Beyond 0.7042, the research team notes the next layer of resistance resides around the 2017 yearly opening level at 0.7199.
Daily perspective:
Resistance at 0.7003 on the daily timeframe, a barrier which held price action lower since May, was overthrown Friday, consequently exposing another layer of resistance at 0.7062. Also of interest is the 200-day SMA lurking just north of this level at around 0.7102.
H4 perspective:
A closer reading of price action on the H4 timeframe has the candles trading above the key figure 0.70 Friday, after consuming the figure during US hours on Thursday. While 0.70, and its closely associated daily resistance at 0.7003, was considered a sell zone, recent reports also suggested the possibility of a break higher (given weekly structure pointing to a move towards 0.7042) and potential retest of 0.70 as support.
As is evident from Friday’s movement, a retest of 0.70 was observed in the shape of a bullish engulfing candle (the retesting candle engulfed the preceding candle’s range), whereby price action continued to push higher into the closing bell.
The next upside target can be seen at May’s opening level taken from 0.7041, which happened to hold price action lower in early May.
Areas of consideration:
For those who managed to jump aboard the noted H4 bullish engulfing pattern off 0.70, great work. Given the potentially tumultuous weekend ahead, it was likely best to reduce risk to breakeven or even cash in on the profits before the close, as it Is difficult to know the market’s G20 summit response at the open.
May’s opening level at 0.7041 on the H4 timeframe and the 2019 yearly opening level on the weekly timeframe at 0.7042 offer potentially strong resistance this week for possible shorting opportunities. Having seen the 2019 yearly opening level offer strong support in the past, there’s a strong chance resistance will likely emerge. Again, though, this all depends on how we kick off the week in terms of the opening reaction to G20 movement.
USD/JPY:
Weekly gain/loss: +0.56%
Weekly close: 107.91
Weekly perspective:
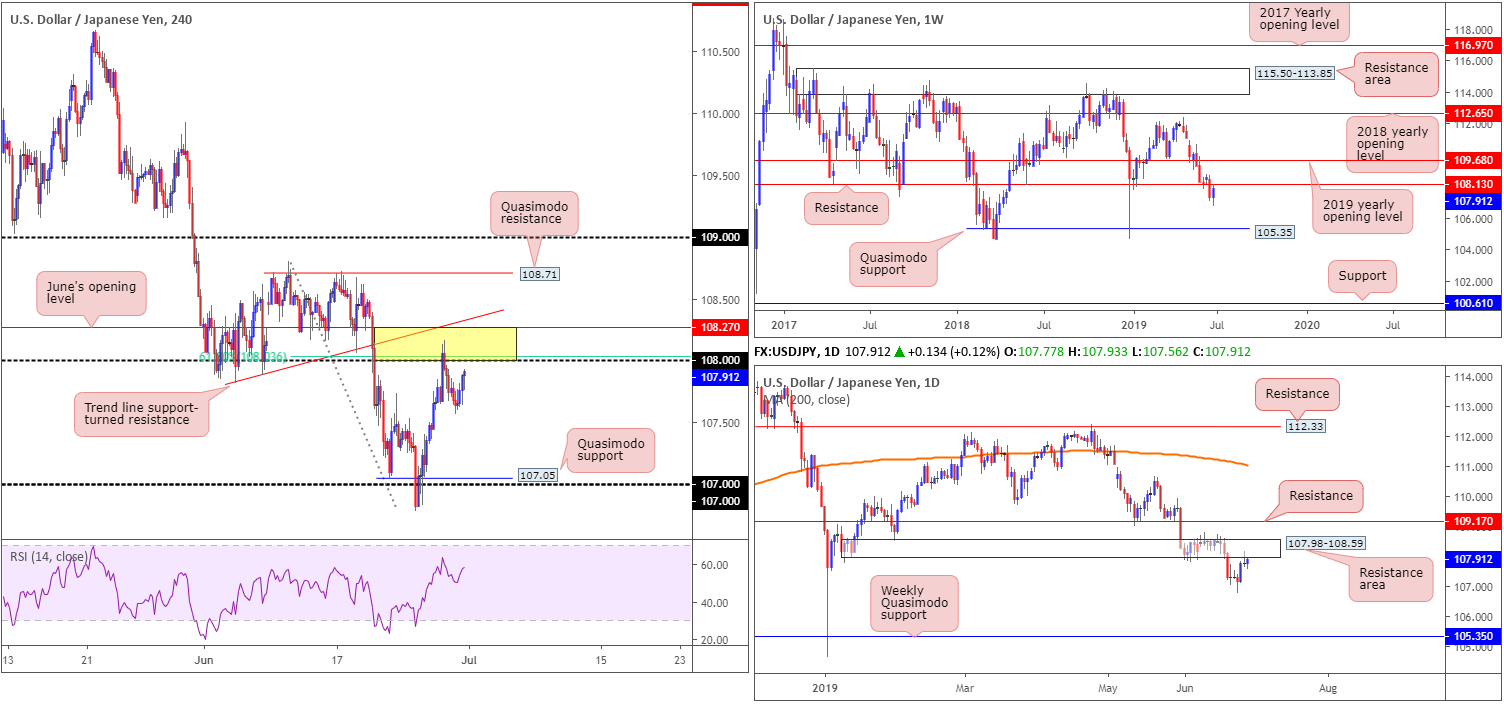
Longer-term flow on the USD/JPY recently dethroned support at 108.13 and retested the underside as resistance. The next available support, should 108.13 hold, does not emerge until Quasimodo support at 105.35. Continued buying, on the other hand, has the 2019 yearly opening level in sight at 109.68.
Daily perspective:
In conjunction with weekly structure, daily action also displays a rather interesting resistance area at 107.98-108.59 which entered the fold Thursday by way of a shooting star pattern. Although Friday’s action observed limited follow-through selling from the said bearish candlestick signal, further downside could still be on the cards, targeting the weekly Quasimodo support underlined above at 105.35.
H4 perspective:
Mid-week onwards saw focus shift to a resistance area marked in yellow at 108.27/108 (comprised of June’s opening level at 108.27, a 61.8% Fibonacci resistance at 108.03, round number 108 and an intersecting trend line support-turned resistance (taken from the low 107.81). What’s also notable regarding 108.27/108 was the underside of a daily resistance area at 107.98-108.59 provides higher-timeframe confluence, as does weekly resistance at 108.13.
As is evident from the H4 timeframe, Thursday witnessed a selloff develop from the said resistance area, specifically the weekly resistance at 108.13 within, though struggled to push through 107.57 Friday. A second retest of the current resistance area, therefore, may occur today/early week. This all depends on the market’s opening position relative to the weekend’s G20 summit.
Areas of consideration:
Folks who sold 108.27/108 likely reduced risk to breakeven and liquidated partial profits ahead of the close. However, given the potentially turbulent opening this week, it may have been best to cash in on the trade and await the opening movement.
As highlighted above, should we retest the 108.27/108 for a second time and produce a H4 bearish candlestick signal (this is recommended due to the possibility of weakened sellers here from the initial test), another selloff could emerge, targeting H4 Quasimodo support at 107.05 as the initial take-profit zone.
USD/CAD:
Weekly gain/loss: -1.00%
Weekly close: 1.3086
Weekly perspective:
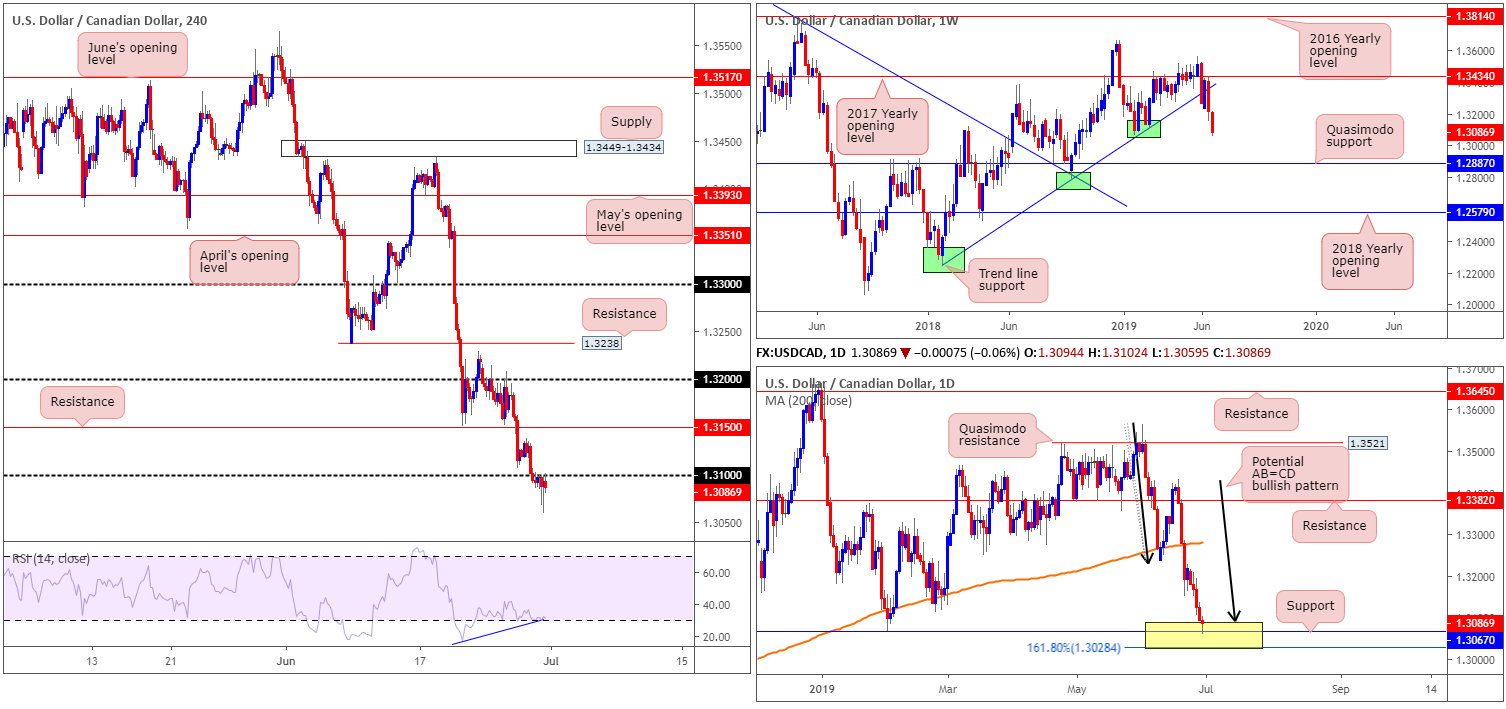
In response to price action coming within two points of the 2017 yearly opening level at 1.3434 (resistance) and turning lower the week prior, recent action observed additional selling take shape last week, erasing more than 130 points.
Limited demand is visible to the left of current price, therefore the possibility of further downside this week is in store, targeting Quasimodo support at 1.2887.
Daily perspective:
A closer analysis of price action on the daily timeframe saw a decisive close beneath the 200-day SMA and opened the door for a run to a support area fixed between 1.3028/1.3089 (yellow). Comprised of an AB=CD (black arrows) formation at 1.3089, a support at 1.3067 and a 161.8% Fibonacci extension at 1.3028 (forms part of the AB=CD structure), this area entered the mix Friday and tested the support level seen within at 1.3067 in the shape of a reasonably strong hammer pattern (considered a bullish candlestick signal).
H4 perspective:
As a result of recent selling, focus shifts to the 1.31 handle which was taken out Friday. The reaction from the daily support area mentioned above at 1.3028/1.3089 hampered breakout selling below 1.31 and produced two back-to-back hammer patterns into the close. Indicator-based traders may also wish to note the RSI is currently seen chalking up positive divergence (blue line) out of overbought territory.
Areas of consideration:
With daily players potentially looking to take things higher, and weekly price suggesting lower prices could be in store as well as H4 action testing the underside of 1.31, here’s where our research team stands at the moment:
- Sellers considering a short at the underside of 1.31 face potential buying from a strong daily buy zone. For that reason, waiting for additional candlestick confirmation to form (entry/risk can be determined according to the candlestick structure) before pulling the trigger is recommended.
- Conservative buyers threatened by the weekly timeframe suggesting lower prices may opt to wait and see if further buying is seen out of 1.3028/1.3089 and a H4 forms close above 1.31. This acts as confirmation buyers are interested in the daily zone and may take things higher from here and, thus could be a good opportunity to buy this market.
USD/CHF:
Weekly gain/loss: -0.02%
Weekly close: 0.9759
Weekly perspective:
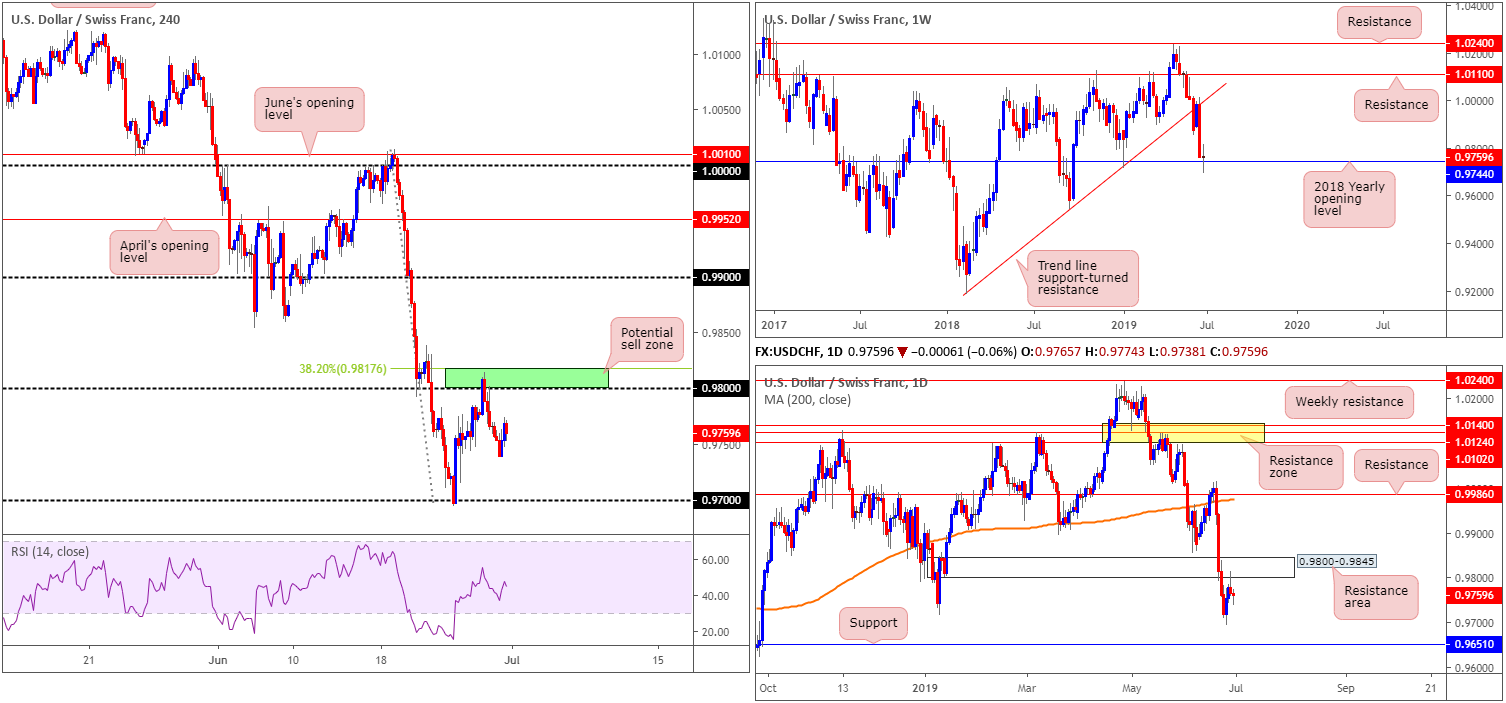
After a strong bout of selling two weeks back, the USD/CHF crossed swords with the 2018 yearly opening level at 0.9744 and produced a clear-cut indecision candle. The next downside target beyond 0.9744 on the weekly timeframe can be found at the 0.9542 September 17 low, whereas to the upside we have trend line support-turned resistance drawn from the low 0.9187.
Daily perspective:
Exploring lower-timeframe action, we can see the daily candles retested the underside of a resistance area at 0.9800-0.9845 last Thursday by way of a shooting star formation. This aroused seller interest Friday, though was limited. Aside from last Tuesday’s low at 0.9693, limited support is in view until reaching 0.9615.
H4 perspective:
For traders who read recent reports you may recall the research team highlighted a potential sell zone on the H4 timeframe between the 38.2% Fibonacci resistance level at 0.9817 and the round number 0.98. What was also interesting here was the underside of the daily resistance area at 0.9800 merging with the said H4 area. Well done to any of our readers who managed to jump aboard this move – the risk/reward was mouth-watering.
Areas of consideration:
Although the market observed a sizeable move out of the H4 resistance area at 0.9817/0.98, with daily movement suggesting further selling could be seen, continued selling remains questionable in light of weekly price responding from support at 0.9744.
Traders who remain short this market will likely have reduced risk to breakeven and cashed in the majority of profits by now. The expectation for most sellers going forward, however, is for a break of weekly support at 0.9744 and run towards the 0.97 handle, and quite possibly daily support at 0.9615. This, of course, depends how the market reacts to the weekend’s G20 movement.
Dow Jones Industrial Average:
Weekly gain/loss: -0.09%
Weekly close: 26642
Weekly perspective:
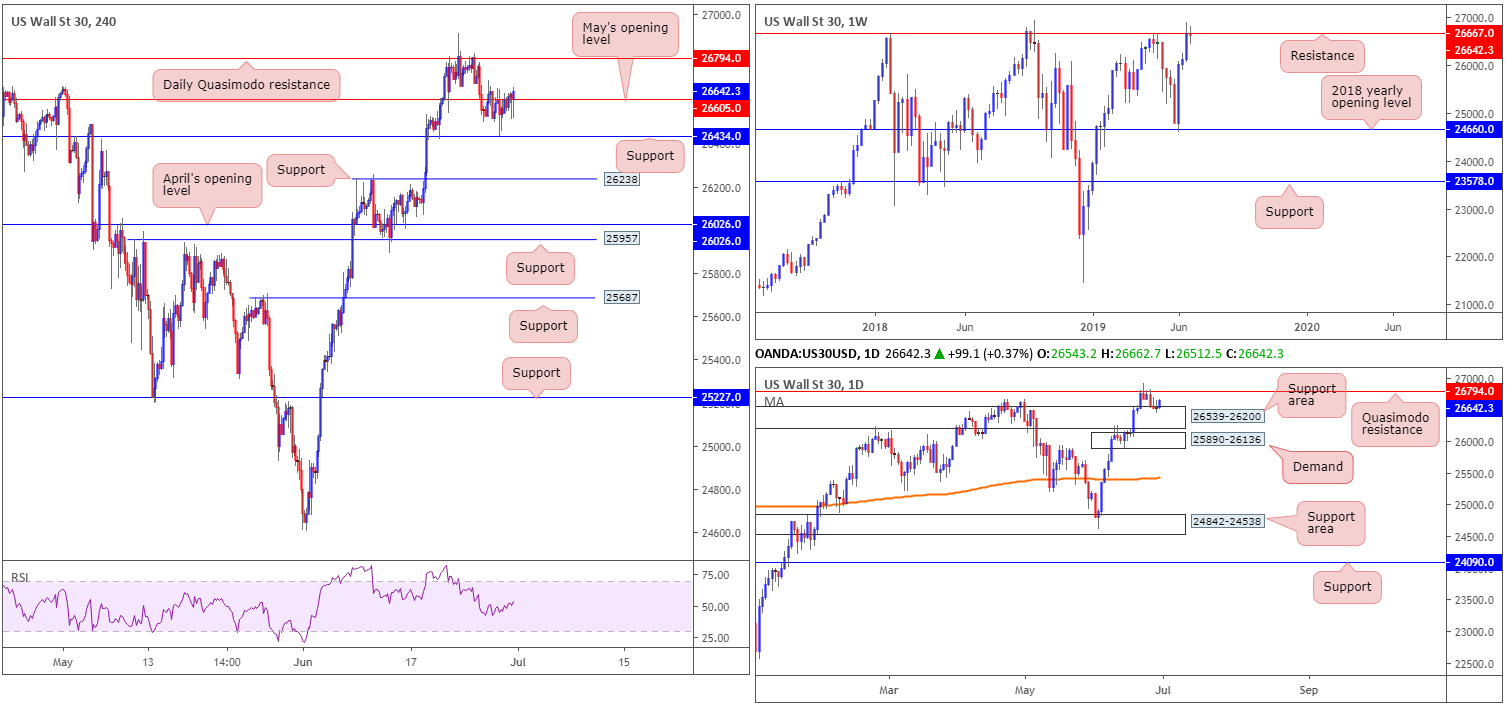
US equities failed to extend gains last week, hampered by notable resistance at 26667. Closing in the form of an indecision candle, areas to be aware of this week are the all-time high at 26939 as a possible resistance and the 2018 yearly opening level at 24660: the origin of the recent move higher.
Daily perspective:
Quasimodo resistance at 26794 continued to cap upside last week, though downside also remained closely supported by 26539-26200. Beyond the Quasimodo formation, the all-time high is present at 26939, while beneath the current support area we have a nearby layer of demand residing at 25890-26136. Technically speaking, this was likely the origin of the recent move higher that broke the 26668 April 24 high and, therefore, is an important base.
H4 perspective:
Since Wednesday, volatility diminished considerably as investors avoid executing large positions ahead of the G20 summit, particularly the meeting between Trump and XI.
The H4 candles, therefore, have remained fluctuating between gains/losses around May’s opening level at 26605. Support is visible at 26434, closely followed by another barrier of support at 26238, while to the upside the daily Quasimodo resistance is visible at 26794.
Areas of consideration:
As has been the case for more than a week now, our technical studies reveal a conflict of signals between timeframes at the moment. On the one hand, weekly sellers are attempting to potentially push lower below resistance at 26667, though on the other hand, daily players defend a support area at 26539-26200. In situations such as this the higher-timeframe structure usually takes precedence, but given the trend is strongly pointing north, selling based on weekly structure is a challenge.
The above, coupled with a possibly turbulent start to the week in response to the G20 summit, may see many traders sidelined for the time being. Tuesday will likely bring about fresh levels of interest.
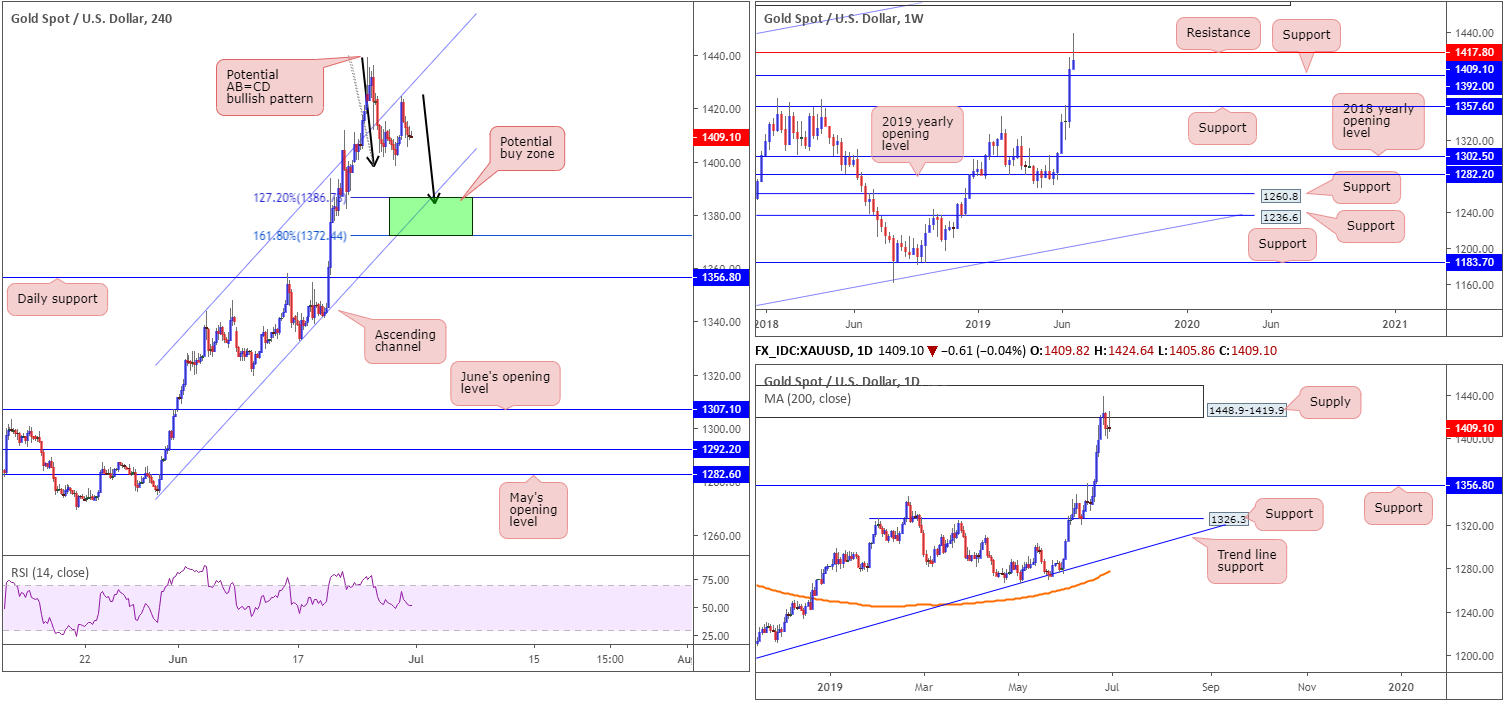
XAU/USD (GOLD):
Weekly gain/loss: +0.75%
Weekly close: 1409.1
Weekly perspective:
Resistance at 1417.8, despite a spike to highs at 1439.1, held ground last week, with the next downside hurdle set at weekly support drawn from 1392.0. It may also interest some traders to note the recently closed weekly candle concluded in the shape of a shooting star formation.
Daily perspective:
The said weekly resistance also boasts a reasonably strong buffer zone on the daily timeframe by way of a supply at 1448.9-1419.9. Drawn from mid-2013, and holding price lower on two occasions since then, active sellers clearly inhabit this region, with a downside target set at support fixed from 1356.8. Also worthy of mention is Friday’s bearish selling wick.
H4 perspective:
On the H4 timeframe, traders can see the candles re-entered an ascending channel formation (1274.8/1344.0) in recent trade and retested the upper edge of the said channel Friday. Follow-through selling from here has the channel support in view as the next downside target, which happens to closely unite with weekly support underlined above at 1392.0.
Traders may also wish to acknowledge the possibility of an AB=CD bullish pattern forming (black arrows), which has a termination zone positioned between the 127.2% and 161.8% Fibonacci extension points between 1372.4/1386.7 (green area).
Areas of consideration:
Granted, daily supply has likely attracted the attention of sellers. Most traders will recognise this. However, with weekly support seen nearby as a potential buy zone at 1392.0, along with the H4 ABCD formation at 1372.4/1386.7 and H4 channel support, as well as the market’s overall trend pointing north, buyers will likely inhabit this zone.
On account of the above reading, the H4 green zone is considered a high-probability buy this week. Ultimately, stop-loss orders can be positioned beyond the area’s range, with the first upside target generally set around the 38.2% Fibonacci retracement of legs A-D (of the AB=CD pattern), which can only be set once/if the pattern completes and begins turning higher.
The accuracy, completeness and timeliness of the information contained on this site cannot be guaranteed. IC Markets does not warranty, guarantee or make any representations, or assume any liability with regard to financial results based on the use of the information in the site.
News, views, opinions, recommendations and other information obtained from sources outside of www.icmarkets.com.au, used in this site are believed to be reliable, but we cannot guarantee their accuracy or completeness. All such information is subject to change at any time without notice. IC Markets assumes no responsibility for the content of any linked site.
The fact that such links may exist does not indicate approval or endorsement of any material contained on any linked site. IC Markets is not liable for any harm caused by the transmission, through accessing the services or information on this site, of a computer virus, or other computer code or programming device that might be used to access, delete, damage, disable, disrupt or otherwise impede in any manner, the operation of the site or of any user’s software, hardware, data or property.


