DXY (US Dollar Index):
Potential Direction: Bearish
Overall momentum of the chart: Bearish
Price could potentially make a bearish reaction off pivot and drop to 1st support.
Pivot: 102.31
Supporting reasons: Identified as pullback resistance, reinforced by the 38.20% Fibonacci Retracement, indicating a level where the price may encounter selling pressure.
1st support: 100.54
Supporting reasons: Marked as multi-swing low support, suggesting a significant area where the price has historically found support after a decline.
1st resistance: 103.69
Supporting reasons: Recognized as pullback resistance, strengthened by the 78.60% Fibonacci Retracement, indicating a key level where previous upward movements may face resistance.

EUR/USD:
Potential Direction: Bullish
Overall momentum of the chart: Bullish
Price could potentially make a bullish bounce off the pivot and head toward 1st resistance.
Pivot: 1.0949
Supporting reasons: Identified as pullback support, reinforced by the 61.80% Fibonacci Retracement, indicating a level where the price may find buying interest.
1st support: 1.0781
Supporting reasons: Marked as swing low support, suggesting a significant area where the price has previously found support after a decline.
1st resistance: 1.1109
Supporting reasons: Recognized as swing high resistance, indicating a key level where previous upward movements have faced selling pressure.

EUR/JPY:
Potential Direction: Bearish
Overall momentum of the chart: Bearish
Price could potentially make a bearish reaction off the pivot and drop to 1st support.
Pivot: 164.05
Supporting reasons: Identified as an overlap resistance, suggesting a key area where sellers might enter the market, reinforcing bearish momentum.
1st support: 159.37
Supporting reasons: Marked as overlap support and supported by the 38.20% Fibonacci Retracement, indicating a potential level where the price may find buying interest.
1st resistance: 168.32
Supporting reasons: Recognized as pullback resistance, indicating a potential area where the price could face selling pressure if it retraces upward.

EUR/GBP:
Potential Direction: Bearish
Overall momentum of the chart: Bearish
Price could potentially make a bearish reaction off the pivot and drop to 1st support.
Pivot: 0.8453
Supporting reasons: Identified as pullback support, reinforced by the 23.60% Fibonacci Retracement, indicating a potential area where the price might stall before continuing downward.
1st support: 0.8384
Supporting reasons: Marked as swing low support, suggesting a significant area where previous declines have found a buying interest.
1st resistance: 0.8490
Supporting reasons: Recognized as pullback resistance, supported by the 38.20% Fibonacci Retracement, indicating a potential level where the price may face selling pressure if it retraces upward.

GBP/USD:
Potential Direction: Bullish
Overall momentum of the chart: Bullish
Price could potentially make a bullish bounce off the pivot and head towards the 1st resistance.
Pivot: 1.3014
Supporting reasons: Identified as pullback support, reinforced by the 38.20% Fibonacci Retracement, suggesting a key level where the price might find buying interest.
1st support: 1.2863
Supporting reasons: Marked as pullback support, supported by the 61.80% Fibonacci Retracement, indicating a significant area where the price may find support if it dips lower.
1st resistance: 1.3264
Supporting reasons: Recognized as swing high resistance, indicating a potential area where the price might encounter selling pressure if it rallies.

GBP/JPY:
Potential Direction: Bearish
Overall momentum of the chart: Bearish
Price could potentially make a bearish reaction off the pivot and drop to the 1st support.
Pivot: 191.84
Supporting reasons: Identified as an overlap resistance, indicating a significant level where the price might encounter selling pressure.
1st support: 183.33
Supporting reasons: Marked as an overlap support, suggesting a key area where the price may find support if it moves lower.
1st resistance: 197.51
Supporting reasons: Recognized as pullback resistance, reinforced by the 61.80% Fibonacci Retracement, indicating a potential area where the price might face resistance if it moves higher.

USD/CHF:
Potential Direction: Bearish
Overall momentum of the chart: Bearish
Price could potentially make a bearish reaction off the pivot and drop to the 1st support.
Pivot: 0.8729
Supporting reasons: Identified as an overlap resistance, suggesting a significant level where the price might encounter selling pressure.
1st support: 0.8402
Supporting reasons: Marked as multi-swing low support, indicating a critical area where the price may find support if it moves lower.
1st resistance: 0.8841
Supporting reasons: Recognized as pullback resistance, signaling a potential area where the price might face resistance if it moves higher.

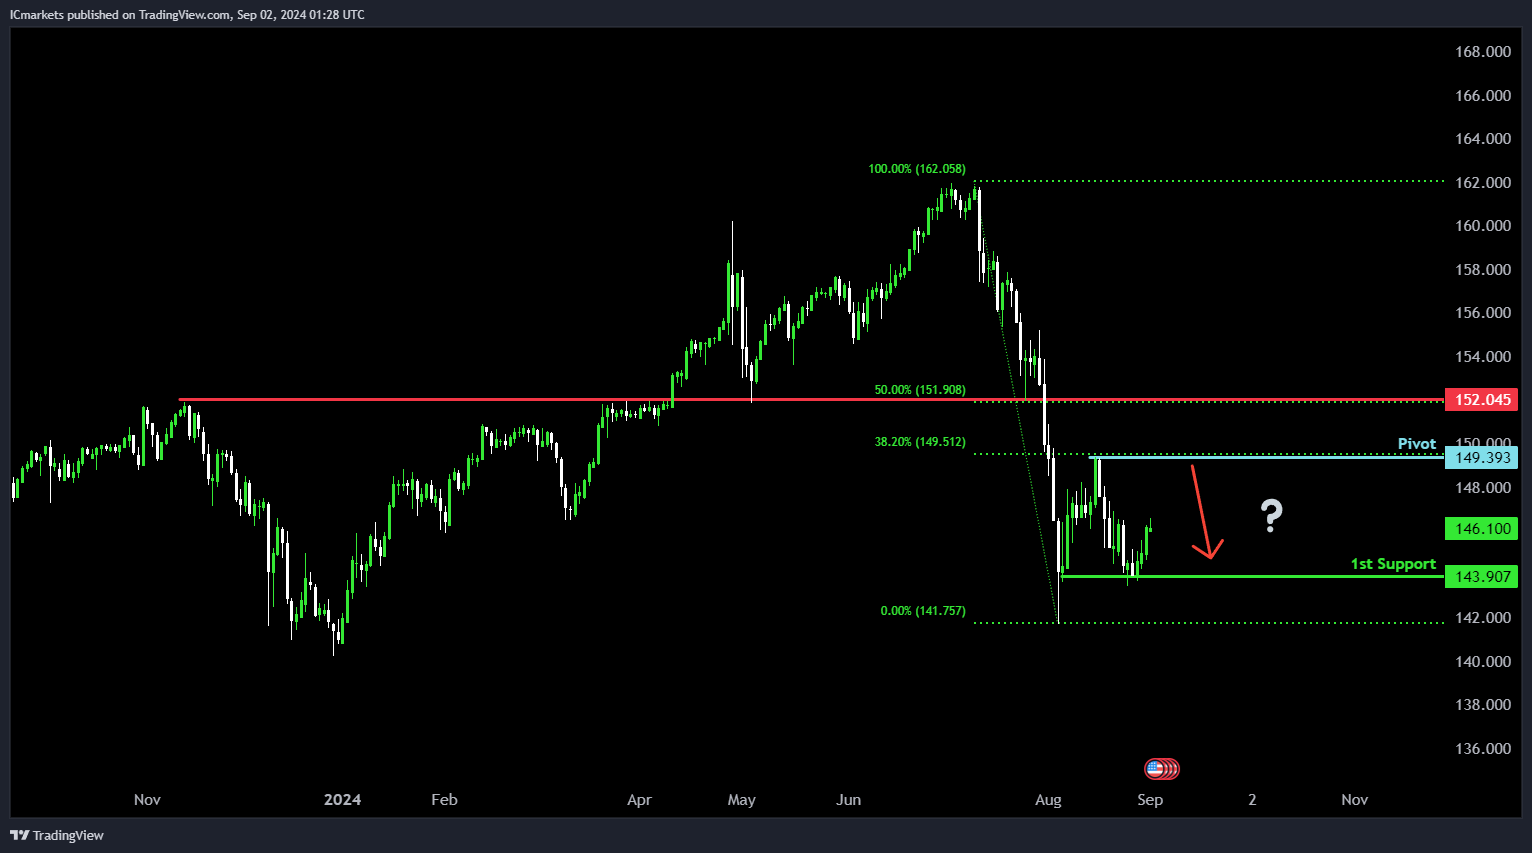
USD/JPY:
Potential Direction: Bearish
Overall momentum of the chart: Bearish
Price could potentially make a bearish reaction off the pivot and drop to the 1st support.
Pivot: 149.39
Supporting reasons: Identified as swing high resistance, supported by a 38.20% Fibonacci retracement level, indicating a potential area where selling pressure might occur.
1st support: 143.90
Supporting reasons: Marked as multi-swing low support, indicating a critical level where the price might find support if it moves lower.
1st resistance: 152.04
Supporting reasons: Recognized as pullback resistance, reinforced by a 50% Fibonacci retracement level, suggesting a significant area where the price may face resistance if it moves higher.
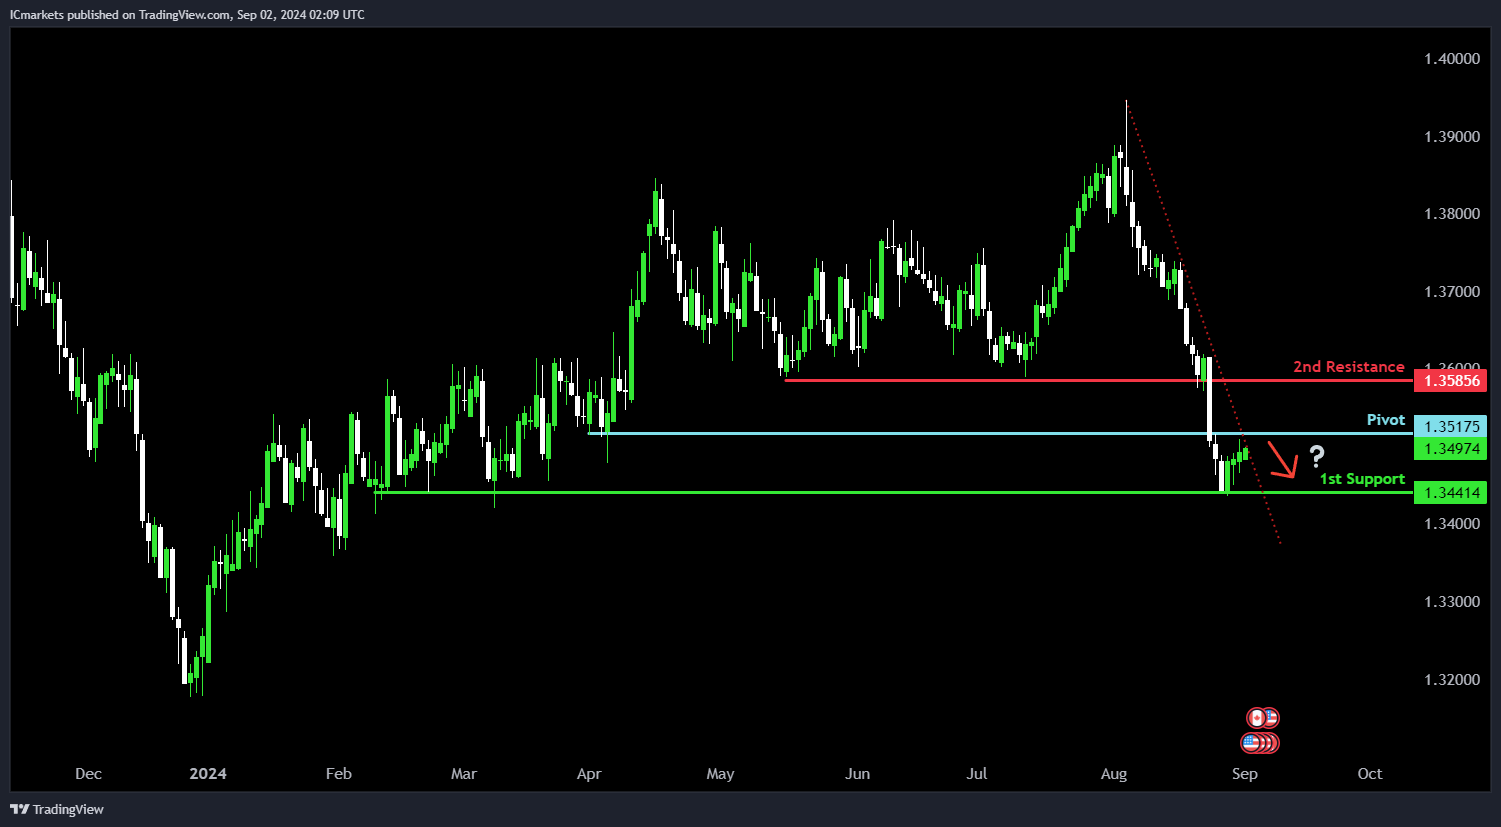
USD/CAD:
Potential Direction: Bearish
Overall momentum of the chart: Bearish
Price is rising towards the pivot and could potentially make a bearish reversal off this level to fall lower towards the 1st support.
Pivot: 1.3517
Supporting reasons: Identified as a pullback resistance, indicating a potential area where selling pressures could intensify. The presence of the descending trendline adds further significance to this resistance zone.
1st support: 1.3441
Supporting reasons: Identified as a multi-swing-low support, indicating a potential area where price could find strong support.
1st resistance: 1.3585
Supporting reasons: Identified as a pullback resistance, indicating a potential area that could halt any further upward movement.
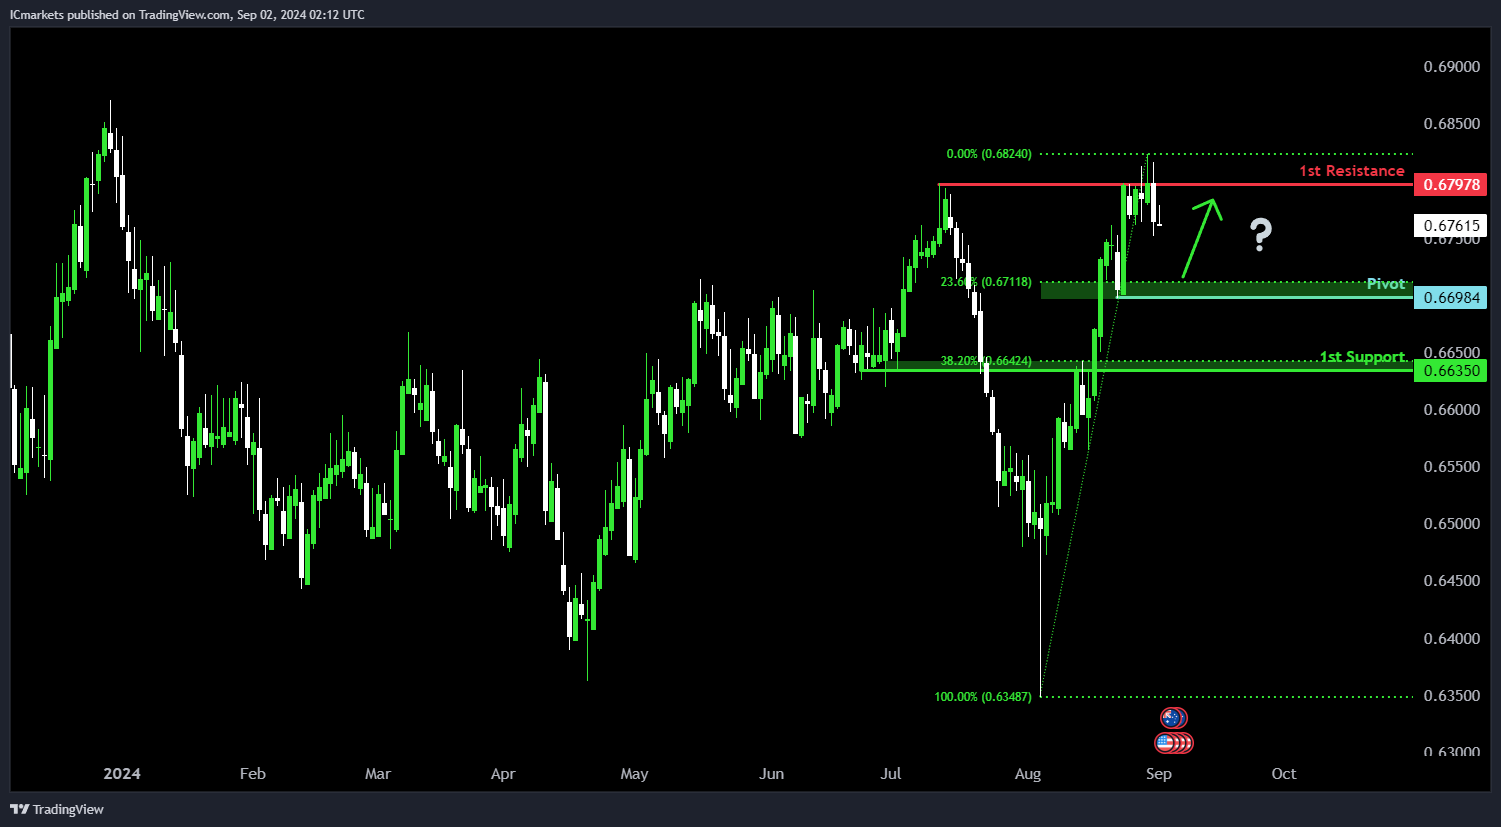
AUD/USD:
Potential Direction: Bullish
Overall momentum of the chart: Bullish
Price is falling towards the pivot and could potentially make a bullish bounce off this level to rise towards the 1st resistance.
Pivot: 0.6698
Supporting reasons: Identified as a swing-low support that aligns close to a 23.6% Fibonacci retracement, indicating a significant area where buying interests could pick up to resume the uptrend.
1st support: 0.6635
Supporting reasons: Identified as an overlap support that aligns close to a 38.2% Fibonacci retracement, suggesting a potential area where price could find support.
1st resistance: 0.6797
Supporting reasons: Identified as a multi-swing-high resistance, indicating a significant area that could halt further upward movement.
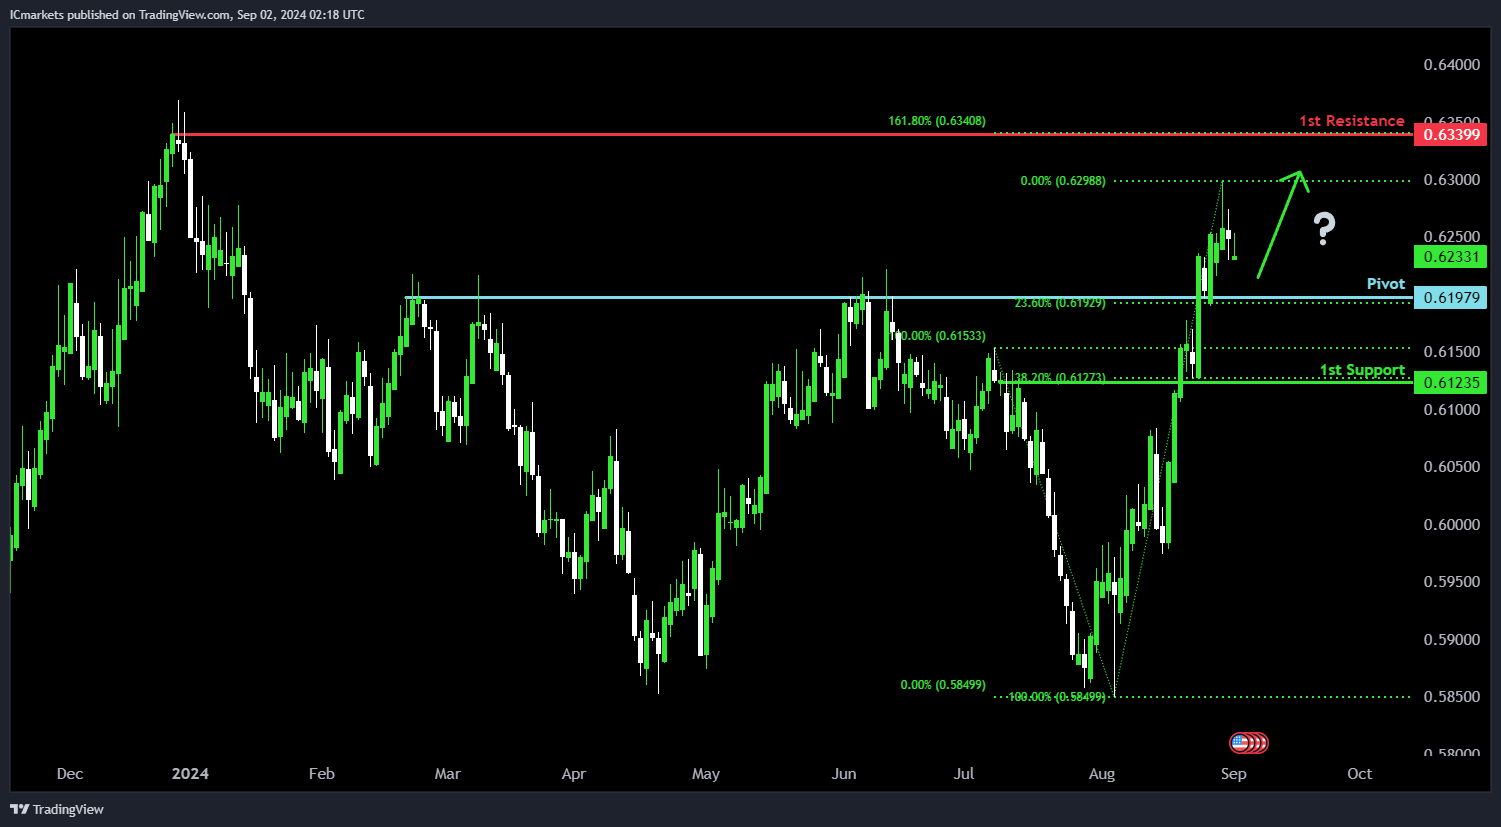
NZD/USD
Potential Direction: Bullish
Overall momentum of the chart: Bullish
Price is falling towards the pivot and could potentially make a bullish bounce off this level to rise towards the 1st resistance.
Pivot: 0.6197
Supporting reasons: Identified as an overlap support that aligns with a 23.6% Fibonacci retracement, indicating a significant area where buying interests could pick up to resume the uptrend.
1st support: 0.6123
Supporting reasons: Identified as an overlap support that aligns with a 38.2% Fibonacci retracement, suggesting a potential area where price could find support.
1st resistance: 0.6339
Supporting reasons: Identified as a swing-high resistance that aligns with a 161.8% Fibonacci extension, indicating a significant area that could halt further upward movement.
US30 (DJIA):
Potential Direction: Bullish
Overall Momentum of the Chart: Bullish
Price could fall towards the pivot and potentially make a bullish bounce off this level to rise towards the 1st resistance.
Pivot: 41,124.56
Supporting reasons: Identified as an overlap support, suggesting a potential area where buying interests could pick up to resume the uptrend.
1st Support: 40,753.96
Supporting Reasons: Identified as a pullback support that aligns close to a 23.6% Fibonacci retracement, suggesting an area where price has found support recently.
1st Resistance: 42,014.15
Supporting Reasons: Identified as a resistance that aligns with a 127.2% Fibonacci extension, indicating a significant area that could halt further upward movement.

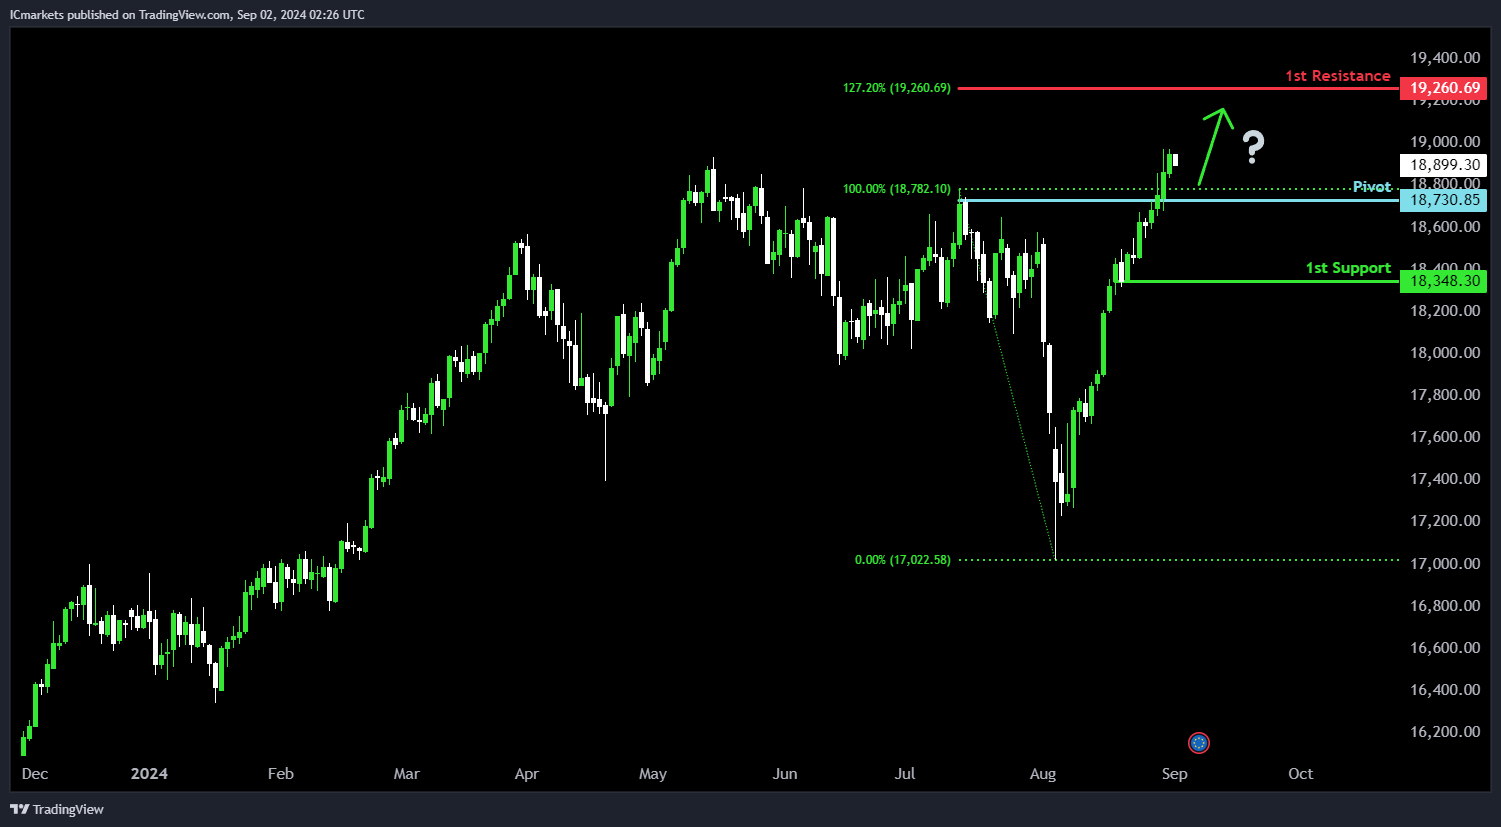
DE40 (DAX):
Potential Direction: Bullish
Overall Momentum of the Chart: Bullish
Price could fall towards the pivot and potentially make a bullish bounce off this level to rise towards the 1st resistance.
Pivot: 18,730.85
Supporting reasons: Identified as a pullback support, suggesting a potential area where buying interests could pick up to resume the uptrend.
1st Support: 18,348.30
Supporting Reasons: Identified as a pullback support, indicating a potential area where price could find support.
1st Resistance: 19,260.69
Supporting Reasons: Identified as a resistance that aligns with a 127.2% Fibonacci extension, indicating a significant area that could halt further upward movement.
US500 (S&P 500):
Potential Direction: Bullish
Overall Momentum of the Chart: Bullish
Price could fall towards the pivot and potentially make a bullish bounce off this level to rise towards the 1st resistance.
Pivot: 5,561.63
Supporting reasons: Identified as an overlap support, suggesting a potential area where buying interests could pick up to resume the uptrend.
1st support: 5,402.66
Supporting reasons: Identified as a pullback support that aligns close to a 38.2% Fibonacci retracement, suggesting a potential area where price could find support.
1st resistance: 5,669.89
Supporting reasons: Identified as a swing-high resistance that aligns close to a 127.2% Fibonacci extension, suggesting a critical area that could halt further upward movement.

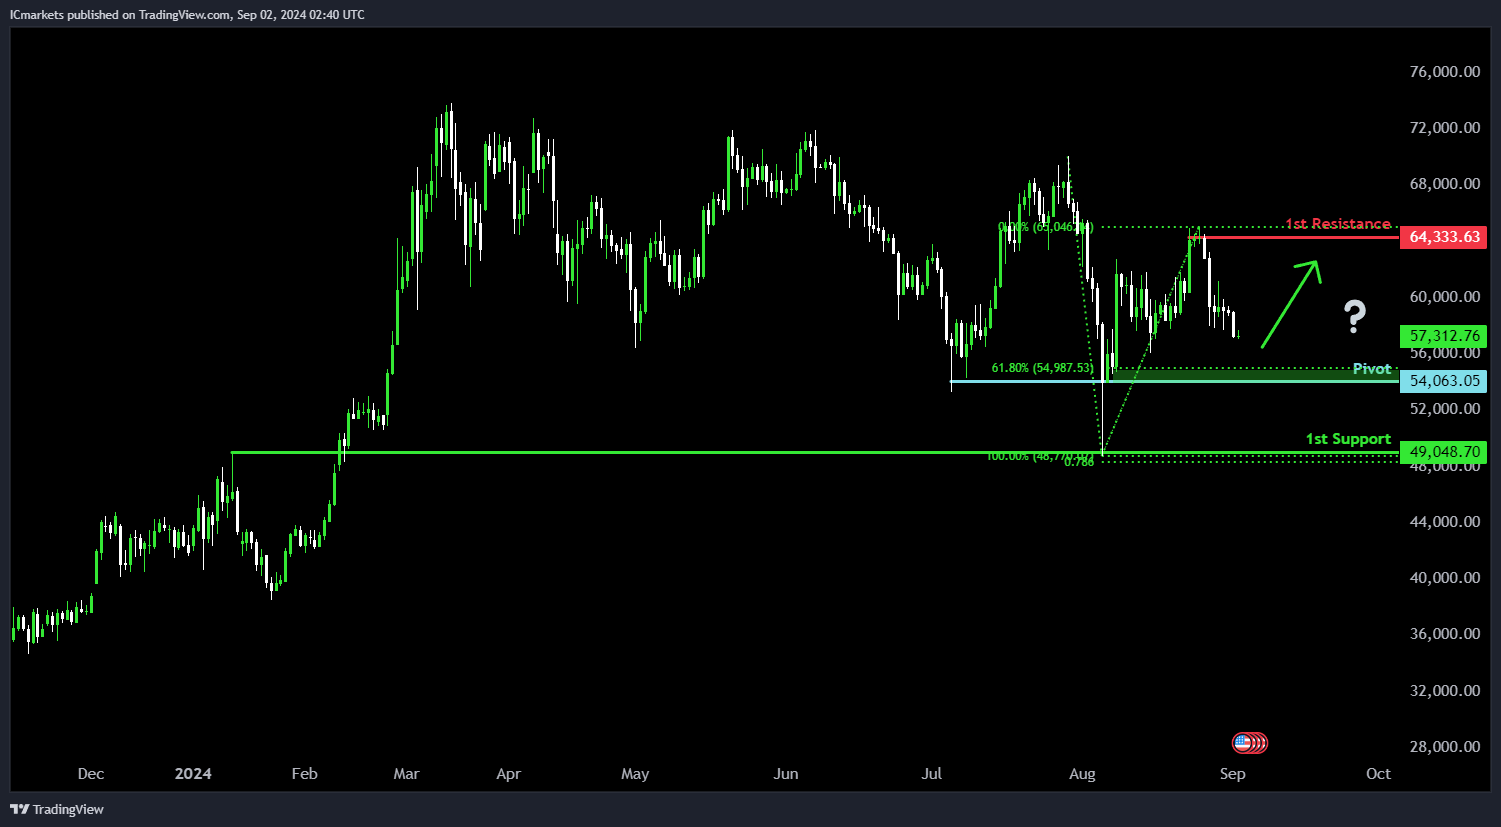
BTC/USD (Bitcoin):
Potential Direction: Bullish
Overall momentum of the chart: Neutral
Price is falling towards the pivot and could potentially make a bullish bounce off this level to rise towards the 1st resistance.
Pivot: 54,063.05
Supporting reasons: Identified as a multi-swing-low support that aligns close to a 61.8% Fibonacci retracement, indicating a potential area where buying interests could pick up to stage a minor rebound.
1st support: 49,048.70
Supporting reasons: Identified as an overlap support, indicating a significant area where price has found support in the past.
1st resistance: 64,333.63
Supporting reasons: Identified as a swing-high resistance, indicating a potential barrier that could halt further upward movement.
ETH/USD (Ethereum):
Potential Direction: Bullish
Overall momentum of the chart: Neutral
Price is falling towards the pivot and could potentially make a bullish bounce off this level to rise towards the 1st resistance.
Pivot: 2,341.67
Supporting reasons: Identified as a swing-low support that aligns with a 61.8% Fibonacci retracement, indicating a potential area where buying interests could pick up to stage a minor rebound.
1st Support: 2,037.36
Supporting Reasons: Identified as a multi-swing-low support, indicating a potential area where price could find support.
1st Resistance: 2,779.44
Supporting Reasons: Identified as a swing-high resistance that aligns with a 50% Fibonacci retracement, indicating a historical barrier where that could halt further upward movement.

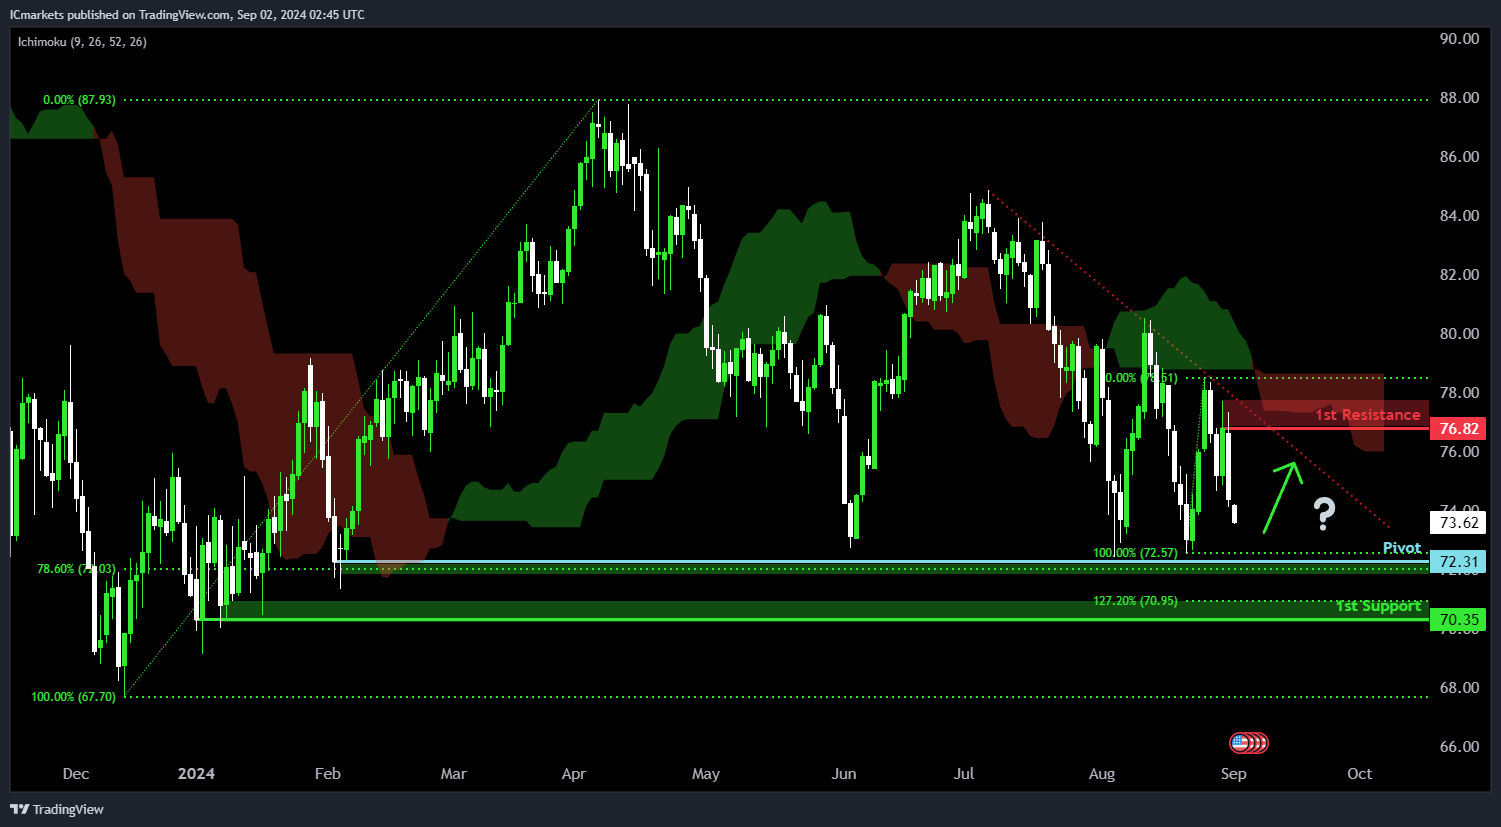
WTI/USD (Oil):
Potential Direction: Bullish
Overall Momentum of the Chart: Bearish
Price is falling towards the pivot and could potentially make a bullish bounce off this level to rise towards the 1st resistance.
Pivot: 72.31
Supporting Reasons: Identified as a multi-swing-low support that aligns close to a 78.6% Fibonacci retracement, suggesting a potential area where buying interests could pick up to stall the decline.
1st Support: 70.35
Supporting Reasons: Identified as a multi-swing-low support, indicating a potential area where price has found support in the past.
1st Resistance: 76.82
Supporting Reasons: Identified as a swing-high resistance, indicating a potential barrier that could halt further upward movement. The presence of a bearish Ichimoku cloud and a descending trendline add further significance to the strength of this resistance zone.
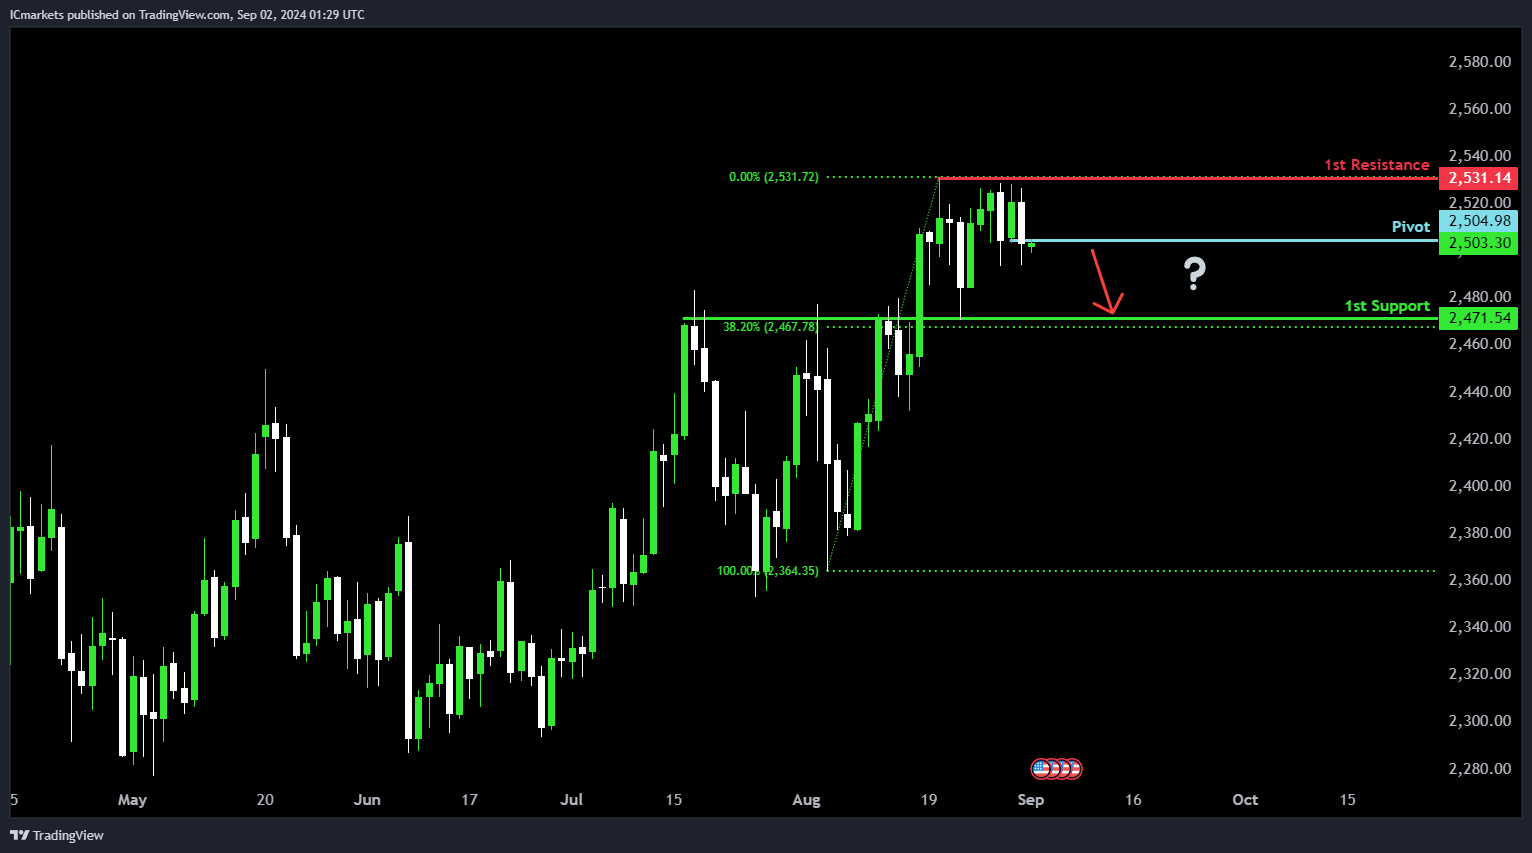
XAU/USD (GOLD):
Potential Direction: Bearish
Overall momentum of the chart: Bearish
Price could potentially make a bearish reaction off the pivot and drop to the 1st support.
Pivot: 2504.98
Supporting reasons: Identified as an overlap resistance level, indicating a potential area where sellers could enter the market.
1st support: 2471.54
Supporting reasons: Recognized as overlap support, reinforced by a 38.20% Fibonacci retracement level, suggesting a significant area where previous declines have found support.
1st resistance: 2531.14
Supporting reasons: Marked as multi-swing high resistance, highlighting a historical point where previous rallies have faced selling pressure or reversed.
The accuracy, completeness and timeliness of the information contained on this site cannot be guaranteed. IC Markets does not warranty, guarantee or make any representations, or assume any liability regarding financial results based on the use of the information in the site.
News, views, opinions, recommendations and other information obtained from sources outside of www.icmarkets.com, used in this site are believed to be reliable, but we cannot guarantee their accuracy or completeness. All such information is subject to change at any time without notice. IC Markets assumes no responsibility for the content of any linked site.
The fact that such links may exist does not indicate approval or endorsement of any material contained on any linked site. IC Markets is not liable for any harm caused by the transmission, through accessing the services or information on this site, of a computer virus, or other computer code or programming device that might be used to access, delete, damage, disable, disrupt or otherwise impede in any manner, the operation of the site or of any user’s software, hardware, data or property.