EUR/USD:
Weekly gain/loss: -0.31%
Weekly close: 1.1168
Weekly perspective:
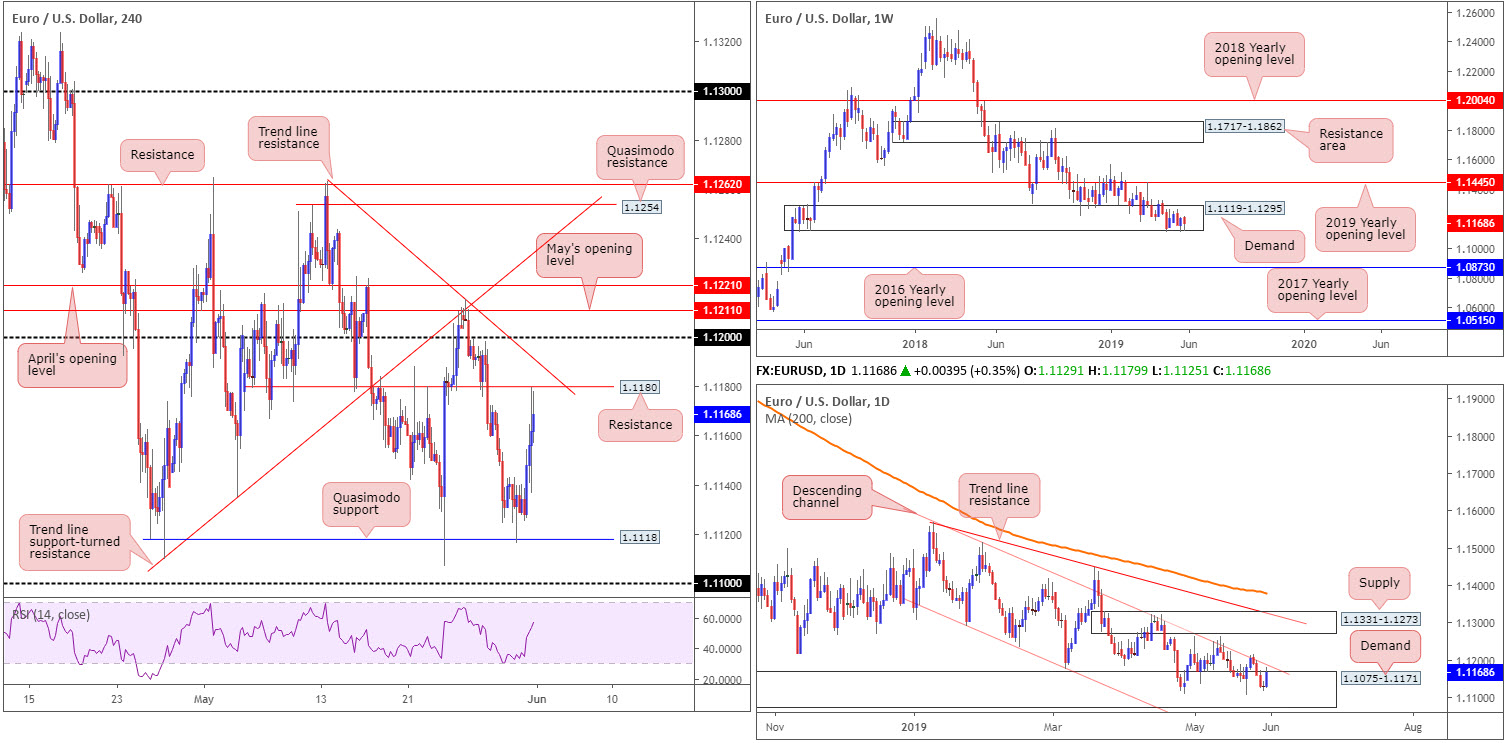
Longer-term flows remain positioned within the lower boundary of a long-standing demand zone at 1.1119-1.1295, despite a marginal breach two weeks ago.
Upside from this point shows room for extension to as far north as the 2019 yearly opening level at 1.1445, whereas a move lower has the 2016 yearly opening level at 1.0873 in the firing range. According to the overall trend facing a southerly bearing since topping in early 2018, a break of the aforesaid demand is the more likely event.
Daily perspective:
Demand coming in at 1.1075-1.1171 – glued to the underside of the current weekly demand – also remained in motion last week. The issue daily players have from here, aside from the predominant downtrend, is channel resistance extended from the high 1.1569 hampering upside.
Should the trend maintain its downside trajectory this week, traders are urged to pencil in the support area at 1.0860-1.0954 (not visible on the screen).
H4 perspective:
Breaking a four-day bearish phase, EUR/USD bulls went on the offensive Friday and erased more than 50% of the week’s losses. Bolstered by a waning dollar (US dollar index crossed back beneath 98.00), the H4 candles reached a session high of 1.1179, falling a point short of shaking hands with resistance at 1.1180.
Overhead, traders may wish to acknowledge nearby trend line resistance extended from the high 1.1263 and the psychological level 1.12. It might also be worth noting April and May’s opening level at 1.1221 and 1.1211, respectively, in the event we press above 1.12 this week. A sustained rejection from 1.1180, nonetheless, has Quasimodo support at 1.1118 in sight, shadowed closely by the 1.11 handle.
Areas of consideration:
Impressive as Friday’s upsurge may have been, the pendulum remains swinging in favour of sellers according to our technical studies. Sentiment clearly favours downside longer term; weekly demand mentioned above at 1.1119-1.1295 is hanging on by a thread and price action on the daily timeframe is struggling to make much headway from its demand at 1.1075-1.1171, given nearby channel resistance.
With the above in mind, shorter-term traders may find use in the H4 trend line resistance (1.1263) and 1.12 level for possible shorting opportunities today/early week. This area is favoured due to its connection with the daily channel resistance. Conservative stop-loss placement is seen around 1.1205, while aggressive stop-loss orders may opt to position above the aforementioned H4 trend line resistance.
Today’s data points: US ISM Manufacturing PMI.
GBP/USD:
Weekly gain/loss: -0.63%
Weekly close: 1.2630
Weekly perspective:
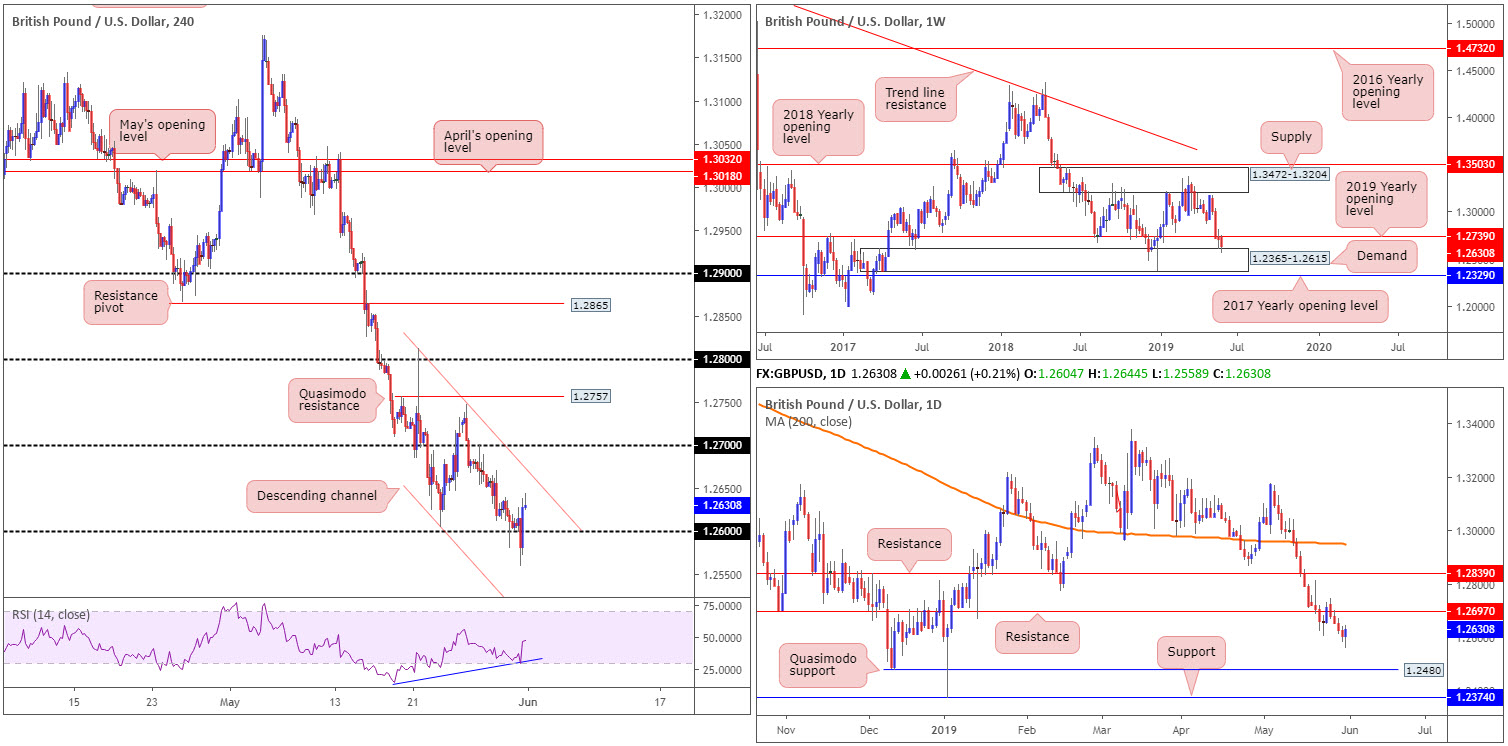
Sterling sustained further losses in recent trading, positioning itself firmly beneath the 2019 yearly opening level at 1.2739. Although registering its fourth consecutive weekly loss, there may be some light at the end of the tunnel: demand at 1.2365-1.2615. Note this area capped downside since mid-2017 and, therefore, could do so again in the weeks to come.
Daily perspective:
Contrary to weekly structure, daily flow displays room to stretch as far south as Quasimodo support at 1.2480. However, having seen Friday’s activity chalk up a bullish engulfing formation (from the top edge of weekly demand mentioned above at 1.2365-1.2615), a run towards resistance at 1.2697 could be in store this week.
H4 perspective:
Following the pair declining to its lowest level since early January at 1.2559 Friday, the British pound staged a modest recovery and reclaimed 1.26 to the upside. Largely strengthened on the back of dollar weakness, movement positioned the H4 candles within striking distance of a channel resistance etched from the high 1.2812. This descending line is not likely to hold given the higher-timeframe position.
Another key thing to note from a technical perspective on the H4 timeframe is the RSI indicator currently displaying a positive divergence (blue line).
Areas of consideration:
Having seen H4 action repossess 1.26, bolstered by RSI positive divergence; daily flow printing a clear-cut bullish engulfing pattern and weekly price challenging demand at 1.2365-1.2615, further upside is a possibility. With this being the case, 1.26 could potentially serve as support and drive north to at least the 1.27 neighbourhood (1.27 boasts a connection with daily resistance at 1.2697).
As round numbers (1.26) often encourage a stop run (fakeout), traders may opt to wait and see how price action behaves prior to pulling the trigger. Should the unit chalk up a H4 bullish candlestick pattern, for example, this not only identifies buyer intent, it also helps position entry and risk levels.
Today’s data points: UK Manufacturing PMI; US ISM Manufacturing PMI.
AUD/USD:
Weekly gain/loss: +0.15%
Weekly close: 0.6935
Weekly perspective:
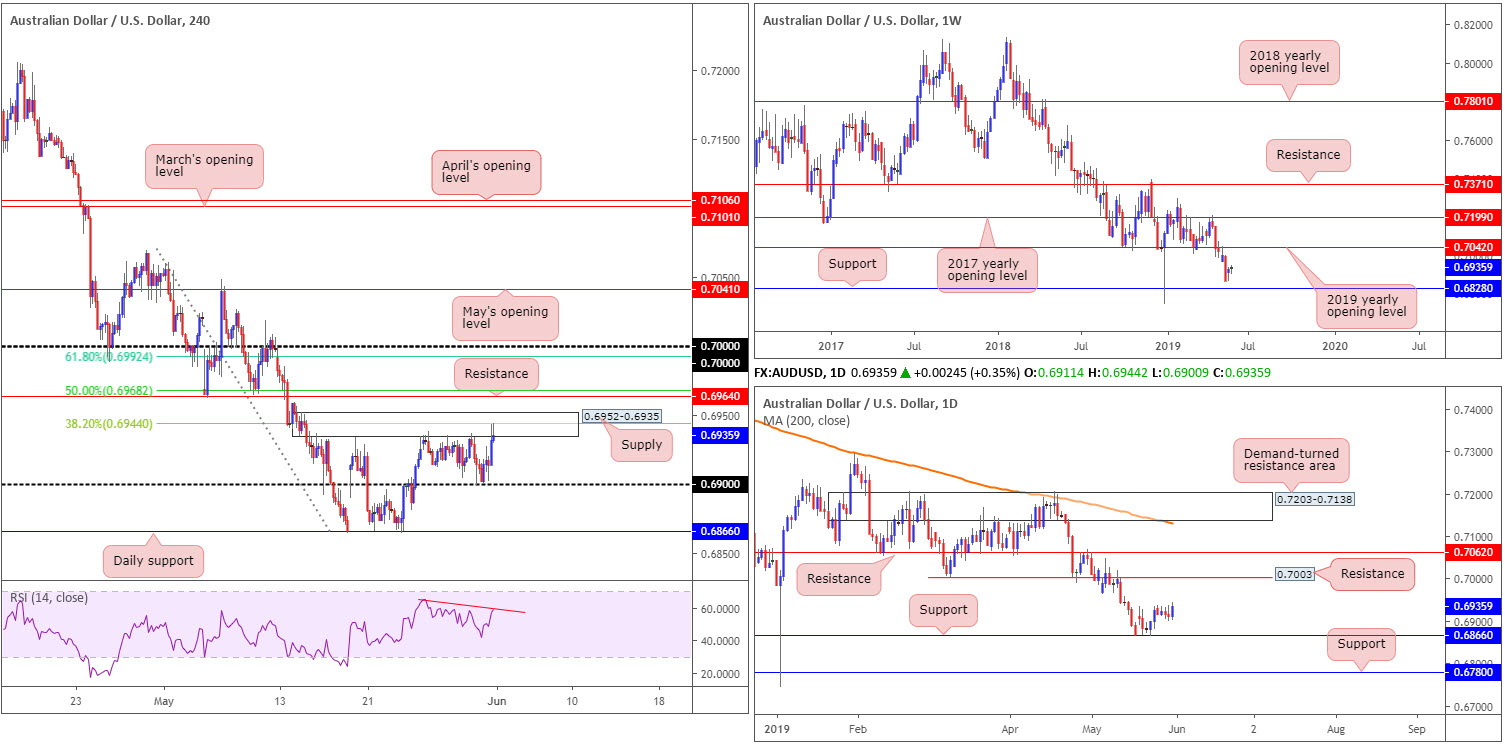
According to the market’s technical position on the weekly timeframe, price action remained unchanged last week. The research team, therefore, still have eyes on 0.6828 as possible support this week, and resistance by way of the 2019 yearly opening level at 0.7042.
Daily perspective:
Focus on the daily timeframe has now shifted to support establishing from the 0.6866 neighbourhood, with little in the way of resistance seen until connecting with 0.7003. Beyond the two said levels, we have another layer of support residing around 0.6780 and an additional film of resistance at 0.7062.
H4 perspective:
Since the beginning of the week, the H4 candles have been clinging to the underside of supply drawn from 0.6952-0.6935, which happens to house a 38.2% Fibonacci resistance value within its borders at 0.6944. Following support emerging from 0.69 Thursday, the Australian dollar maintained a mild bid tone Friday and reconnected with the said supply area. This time, nevertheless, the 38.2% Fibonacci base entered the fray with price action chalking up a shooting star pattern (confirmed by negative divergence out of the RSI indicator – red line).
A rejection from the current supply has the 0.69 handle as the next viable support, whereas above the supply we have the following resistances to look forward to:
- The 50.0% resistance value at 0.6968, which happens to align with resistance at 0.6964.
- The 61.8% Fibonacci resistance value at 0.6992 – lines up nicely with the key figure 0.70. Note also we have daily resistance offering a potential ceiling close by at 0.7003.
Areas of consideration:
Short-term players may find the H4 supply at 0.6952-0.6935 of service today, targeting 0.69 as the initial port of call. Traders have the choice of either positioning stop-loss orders above the upper shadow of the noted H4 shooting star pattern or beyond the current supply.
On account of the overall technical picture, though, the key figure 0.70 on the H4 timeframe also remains of interest as potential resistance this week (should we push above the aforementioned H4 supply), in light of its surrounding confluence (see above).
Today’s data points: Australia Company Operating Profits q/q; China Caixin Manufacturing PMI; US ISM Manufacturing PMI.
USD/JPY:
Weekly gain/loss: -0.91%
Weekly close: 108.28
Weekly perspective:
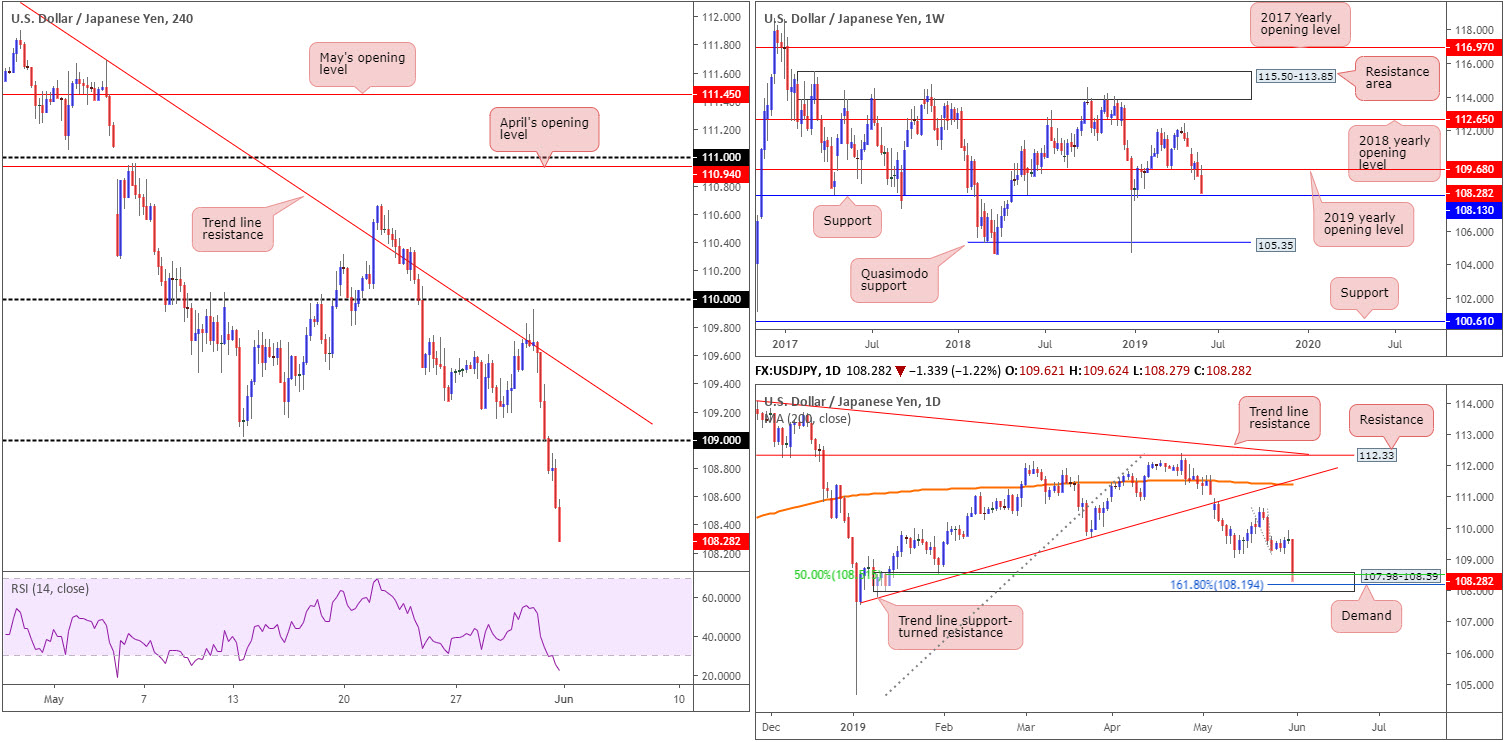
After recently closing beneath the 2019 yearly opening level at 109.68, the unit spun off into another wave of selling last week. Closing not too far of its lows, price action appears poised to revisit notable support coming in at 108.13 this week. In view of this level’s history, active buyers likely inhabit this region.
Daily perspective:
In terms of daily construction, the week ended connecting with demand at 107.98-108.59.
By way of a full-bodied daily bearish candle, Friday entered the said demand in strong fashion. While momentum traders may be eyeing further downside this week, the demand zone offers reasonably attractive confluence, potentially promoting a recovery: 50.0% support value at 108.51, a 161.8% Fibonacci support value at 108.19 and the weekly support level highlighted above at 108.13.
H4 perspective:
In opening trade Friday, investors witnessed Japan’s Nikkei 225 plunge lower, dragging the USD/JPY along with it. US President Trump announced the US will, on 10th June, impose a 5% tariff on all goods coming into the country from Mexico, until such time as illegal migrants coming through Mexico into the US stop. In times of uncertainty, the Japanese yen is considered a safe haven.
Technically speaking, the 109 handle was cleared with ease on the H4 timeframe and now faces a possible move towards 108. It might also be worth noting the RSI indicator is deeply oversold as well.
Areas of consideration:
Between the lower edge of the daily demand area at 107.98 and the weekly support level at 108.13, we have ourselves a potential reversal zone to focus on this week.
Conservative traders concerned by recent events, might opt to wait for additional confirmation to form before pressing the buy button. This could be anything from a H4 candlestick formation to an MA crossover – its trader dependant.
Today’s data points: US ISM Manufacturing PMI.
USD/CAD:
Weekly gain/loss: +0.56%
Weekly close: 1.3515
Weekly perspective:
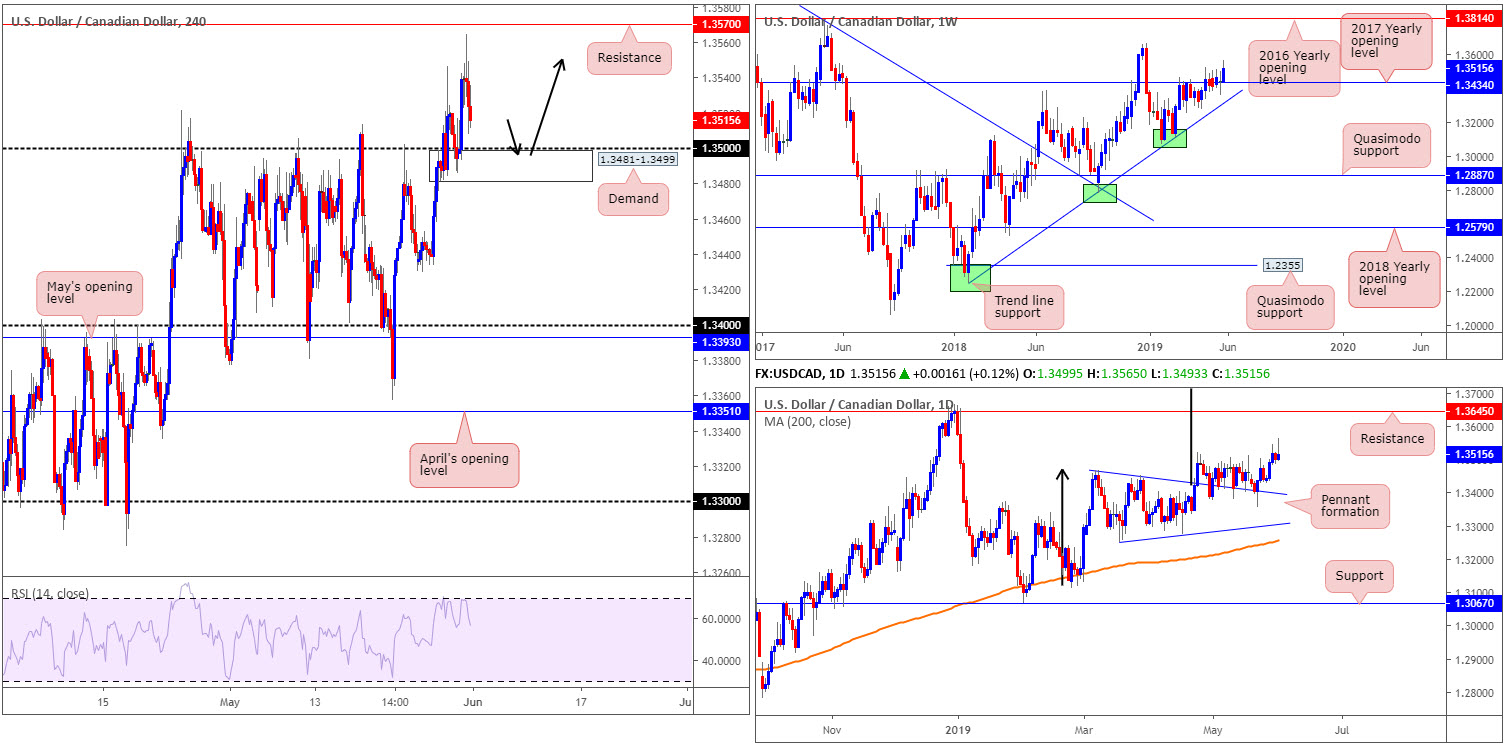
After more than a month of mundane activity around the 2017 yearly opening level at 1.3434, price action surged higher last week, testing a peak of 1.3565. Further buying from this point could call for a move towards the 2018 yearly high of 1.3664, followed by resistance at 1.3814.
Daily perspective:
In conjunction with weekly price, the unit exhibits space to climb higher this week after feeding off support drawn from the top edge of a pennant pattern (1.3467) for the past month. Although the traditional price target (calculated by taking the distance from the beginning of the preceding move and adding it to the breakout price) remains on the chart at 1.3768 (black arrows), the next upside target from a structural standpoint falls in around resistance at 1.3645.
H4 perspective:
A brief look of Friday’s movement on the H4 timeframe reveals the USD/CAD extended gains north of 1.35, though peaked just south of resistance plotted at 1.3570. While the day ended mildly in the green, not too far from 1.35 and nearby demand at 1.3481-1.3499, daily price did in fact chalk up a shooting star pattern.
Areas of consideration:
In spite of the daily shooting star pattern, all three timeframes analysed display room to explore higher ground this week. For that reason, focus is on the H4 demand mentioned above at 1.3481-1.3499 for potential long opportunities today/early week. To enter, traders may opt to long 1.35 with stop-loss orders positioned beneath the lower edge of the said H4 demand (1.3481). The demand area, according to our technical experience, provides a buffer to withstand a stop run through 1.35 should it occur, therefore making it an ideal location consider buying from.
Today’s data points: US ISM Manufacturing PMI.
USD/CHF:
Weekly gain/loss: -0.10%
Weekly close: 1.0005
Weekly perspective:
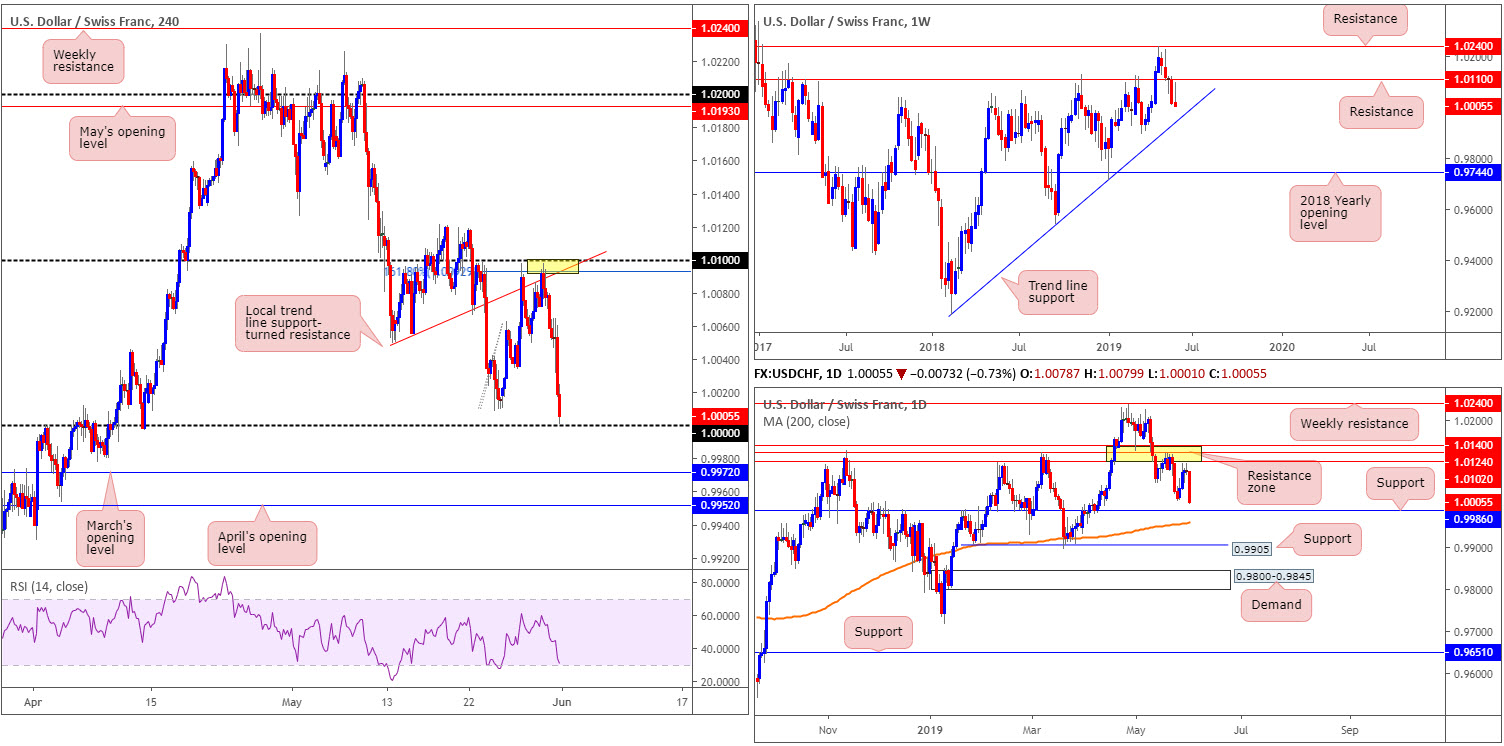
The greenback’s retreat against the Swiss franc from the 2019 high 1.0236 set towards the end of May continued last week, strengthening its position beneath resistance at 1.0110. Assuming the sellers remain the dominant figure, trend line support (etched from the low 0.9187) is in the firing range this week as the next viable ‘floor’.
Daily perspective:
Leaving the resistance zone at 1.0140/1.0102, which incorporates a weekly resistance at 1.0110, unchallenged last week, the pair turned lower. Technically, notable support at 0.9986 is now on the radar, though traders are also urged to note the 200-day SMA meandering just beneath the zone around 0.9960.
H4 perspective:
Following four days of buying, the USD/CHF turned aggressively lower Friday, erasing weekly gains and bottoming just north of the key figure 1.0000 (parity).
For folks who read Thursday’s briefing you may recall the piece highlighted 1.01/1.0092 as a potential sell zone. The research team favoured this area due to its close connection with the lower edge of the daily resistance zone at 1.0140/1.0102 and its associated weekly resistance at 1.0110. Well done to any of our readers who managed to sell 1.01/1.0092 and hold the position into the close – awesome risk/reward trade.
The dynamics behind Friday’s selloff fall largely on the back of dampened risk sentiment. Heightened geopolitical fears amid the on-going trade war between the US and China, as well as US President Trump announcing the US will impose a 5% tariff on all goods coming into the country from Mexico, until such time as illegal migrants coming through Mexico into the US stop, collectively ramped up demand for safe-haven assets.
Areas of consideration:
1.0000 is likely an area on many traders’ watchlist for possible longs this week. The number boasts additional backing from daily support at 0.9986 as well as the 200-day SMA. Therefore, we have a range between 0.9960/1.0000 to watch for signs of buying (note this also includes March’s opening level on the H4 timeframe at 0.9972).
Today’s data points: US ISM Manufacturing PMI.
Dow Jones Industrial Average:
Weekly gain/loss: -3.12%
Weekly close: 24800
Weekly perspective:
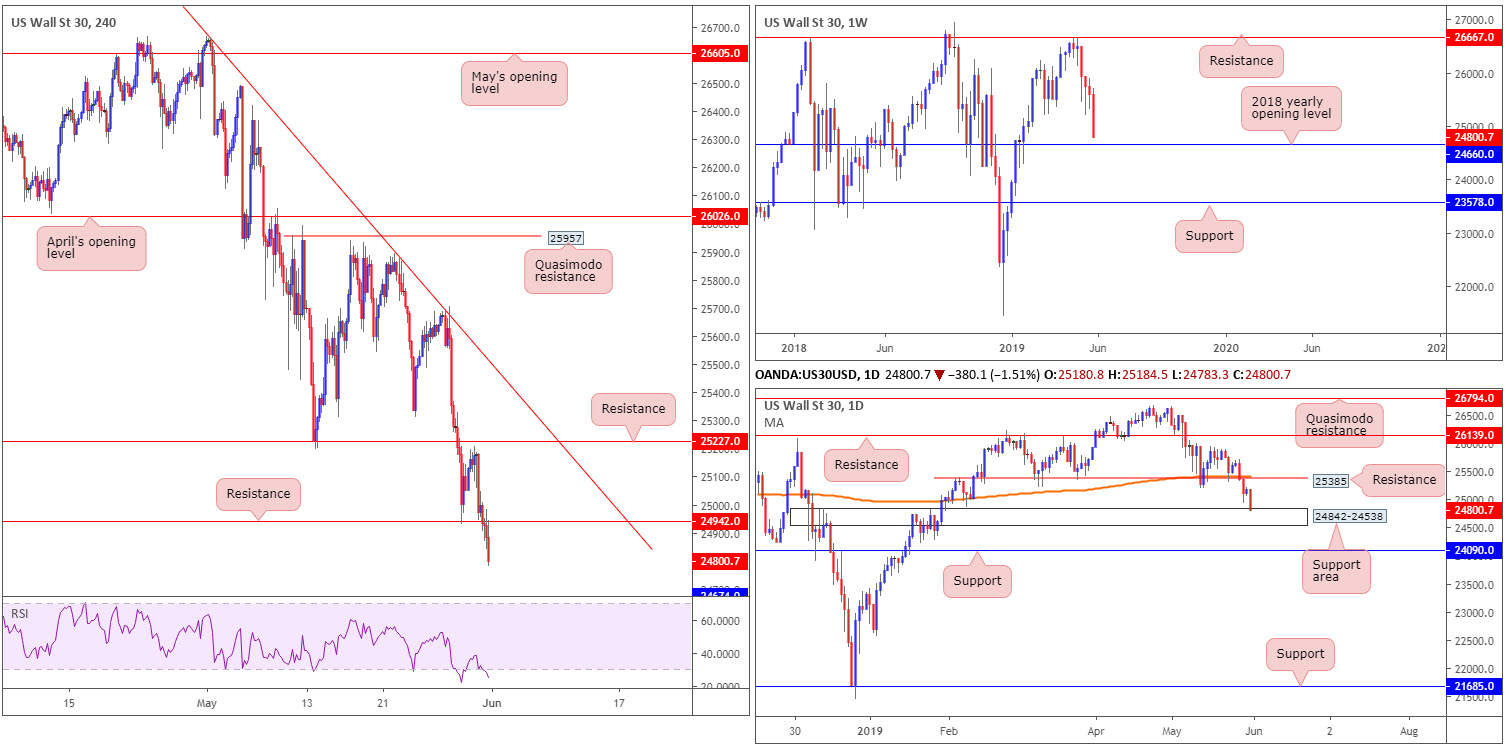
It really wasn’t a good week for US equity indexes, with the Dow Jones Industrial Average declining 800 points. Since topping at resistance drawn from 26667 mid-April time, the index has been under pressure.
Closing not too far off its lows, price action is now eyeing potential support by way of the 2018 yearly opening level at 24660 this week.
Daily perspective:
Reinforcing the weekly support level highlighted above at 24660 is a daily support area coming in at 24842-24538. A rotation higher from this angle could potentially draw the candles as far north as resistance at 25385, which, as of writing, aligns with the 200-day SMA.
H4 perspective:
Global equity markets tumbled Friday in the shape of a full-bodied daily bearish candle. Stock markets suffered after US President Donald Trump announced the United States will impose a 5% tariff on all Mexican imports.
As a result, the technical picture cleared support at 24942 (now acting resistance) and potentially set the stage for a move in the direction of support at 24674 (not visible on the screen).
What’s notable from a technical perspective is the connection between the H4 support mentioned above at 24674 and the 2018 yearly opening level underlined on the weekly timeframe at 24660 – both of which are housed within the walls of the current daily support area.
Areas of consideration:
Given weekly support is nearing at 24660, which holds a connection with H4 support at 24674 and is positioned within a daily support area, the research team feels active buyers may attempt to make a stance from this region this week.
Aggressive traders might opt to position an entry around 24674 and position a protective stop-loss order beneath the daily support area (24538). Should the above reading prove correct, the risk/reward could be monstrously huge from here.
Today’s data points: US ISM Manufacturing PMI.
XAU/USD (GOLD):
Weekly gain/loss: +1.60%
Weekly close: 1305.2
Weekly perspective:
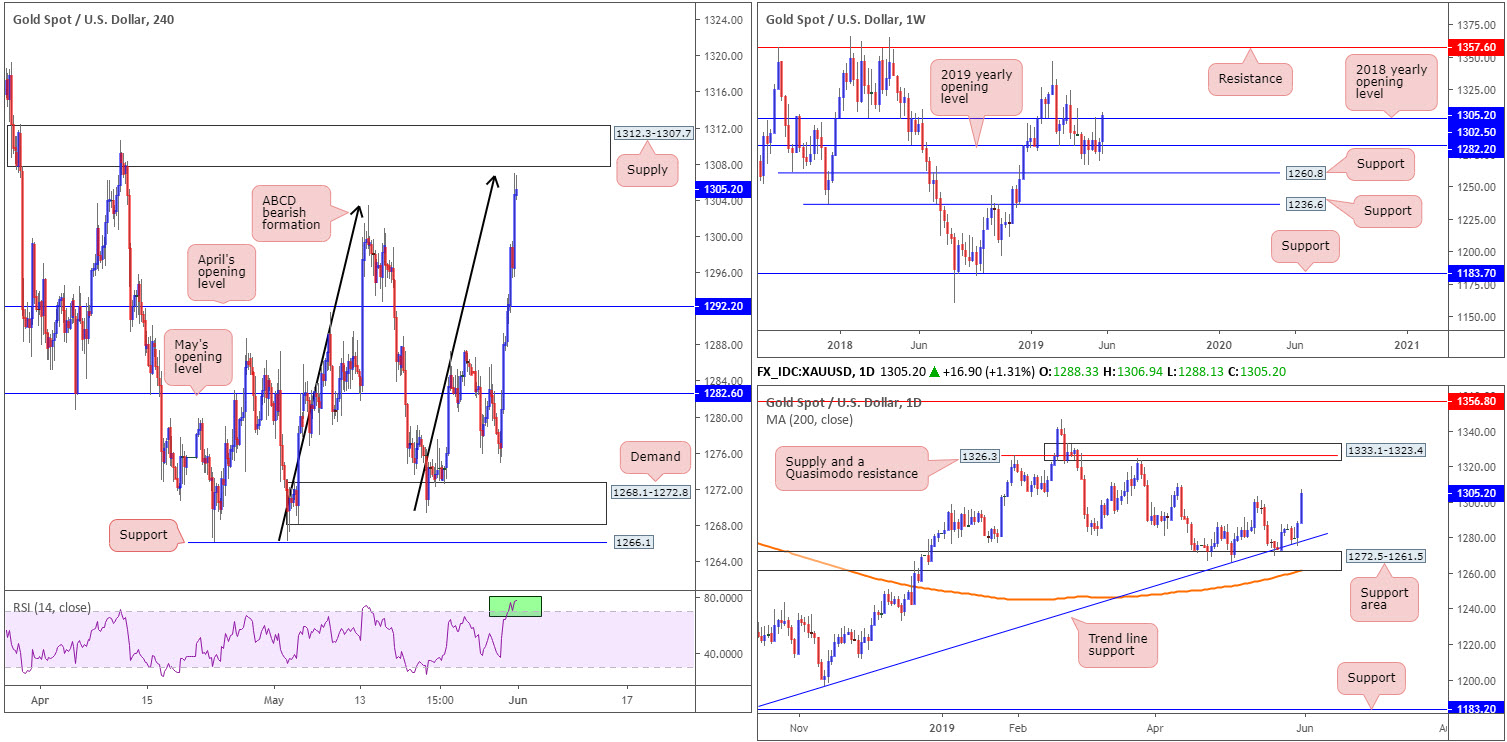
After retesting the 2019 yearly opening level at 1282.2, bullion surged higher last week, adding $20.61. As you can see, the move marginally engulfed the 2018 yearly opening level at 1302.5 and tested highs of 1306.9. According to the research team, aside from the possibility of shorts emerging from the 1346.7 February high, limited resistance is visible above 1302.5 until reaching 1357.6.
Daily perspective:
Recent buying overthrew the 1303.4 May 14 high, after forming solid ground off trend line support extended from the low 1160.3. The next port of call to the upside falls in around the 1310.6 April 10 high, followed by supply at 1333.1-1323.4. Note this area also happens to house a Quasimodo resistance within at 1326.3.
H4 perspective:
The yellow metal capitalised on risk aversion Friday, surging to its highest level in more than two weeks. In the shape of an ABCD (black arrows) bearish formation, the H4 candles dethroned April’s opening level at 1292.2 and topped just south of supply coming in at 1312.3-1307.7. By and of itself, this will likely entice many swing traders into the market this week looking to sell. What’s also interesting is the H4 supply ‘holds’ the next upside target within its boundary: the 1310.6 April 10 high mentioned above on the daily timeframe.
Areas of consideration:
Despite higher timeframes portending a move higher, a rotation south from the H4 supply zone at 1312.3-1307.7 could take shape this week.
For conservative traders concerned about the bigger picture, namely weekly price marginally closing above 1302.5, one option is to wait and see how H4 action behaves before pulling the trigger. This could be something as simple as a H4 bearish candlestick pattern, a moving average crossover or even drilling down to the lower timeframes and attempting to trade local structure. What this does is help identify seller intent and also provide traders levels to enter and base stop-loss orders from.
The accuracy, completeness and timeliness of the information contained on this site cannot be guaranteed. IC Markets does not warranty, guarantee or make any representations, or assume any liability with regard to financial results based on the use of the information in the site.
News, views, opinions, recommendations and other information obtained from sources outside of www.icmarkets.com.au, used in this site are believed to be reliable, but we cannot guarantee their accuracy or completeness. All such information is subject to change at any time without notice. IC Markets assumes no responsibility for the content of any linked site. The fact that such links may exist does not indicate approval or endorsement of any material contained on any linked site.
IC Markets is not liable for any harm caused by the transmission, through accessing the services or information on this site, of a computer virus, or other computer code or programming device that might be used to access, delete, damage, disable, disrupt or otherwise impede in any manner, the operation of the site or of any user’s software, hardware, data or property.


