DXY:
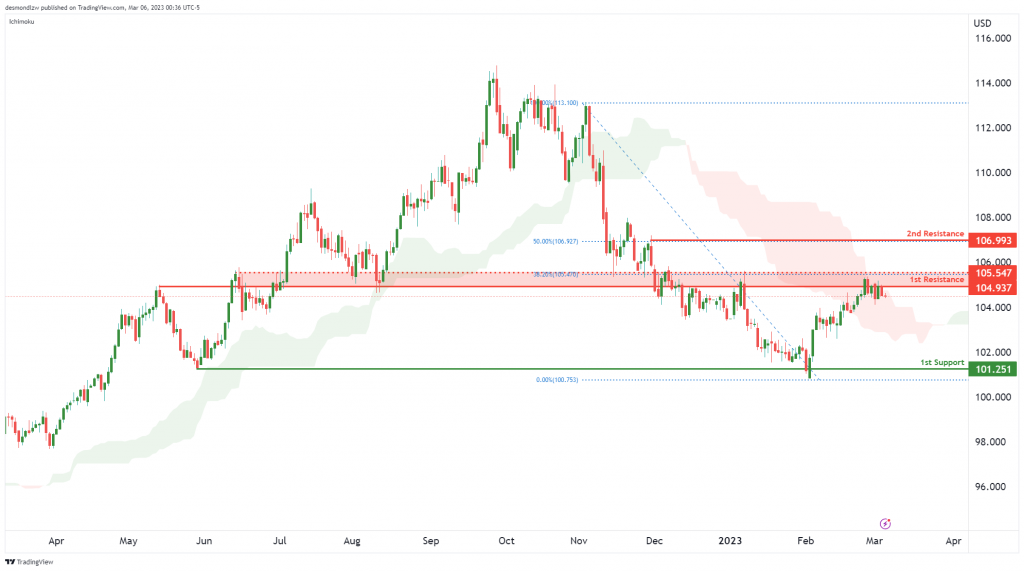
Price has reached our 1st resistance area at 104.93, which is also a 38.2% Fibonacci retracement and a swing high resistance. If the price cannot break this level, we could see prices drop all the way down to 1st support at 101.25, which is an overlap support.
However, if the price were to break our first resistance, we could potentially see the price push up to our 2nd resistance.
EUR/USD:
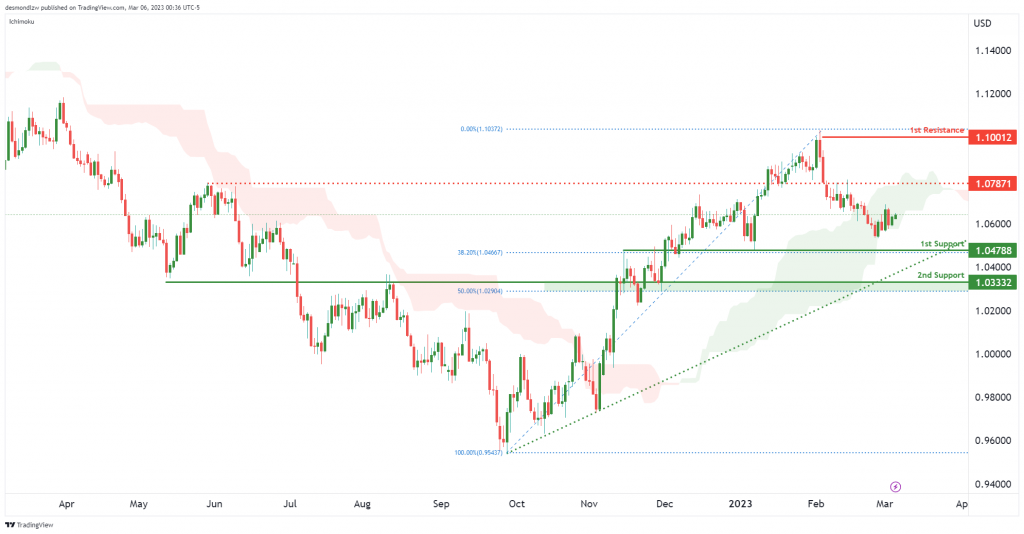
Price has reversed from our first resistance at 1.10012 and reached our first support at 1.0478, which also lines up with the 38.2% Fibonacci retracement. If the price were to break our first support at 1.04788, it could potentially drop further to our second support at 1.03332, where the overlap support is.
GBP/USD:
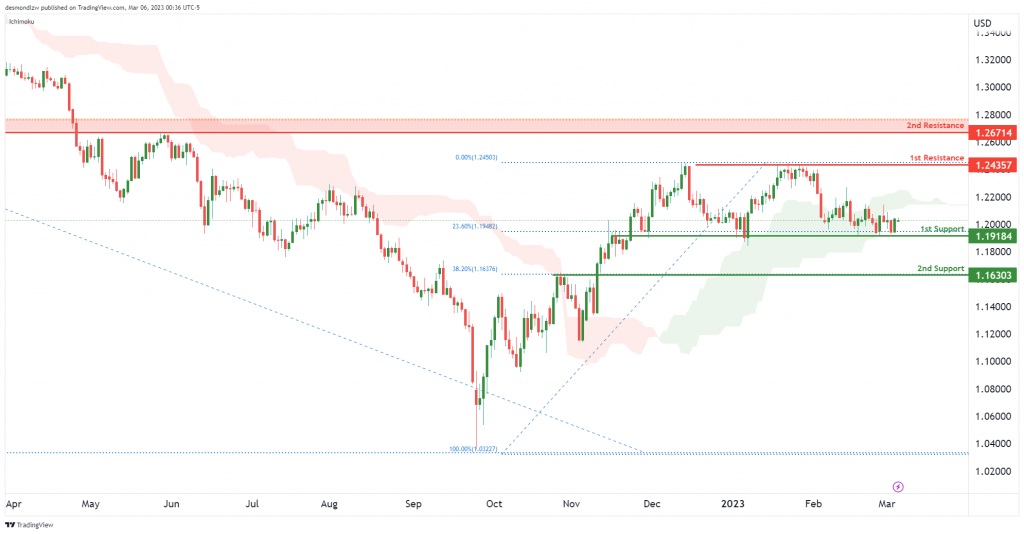
Price has bounced from our first support at 1.1918 with the 23.6% Fibonacci retracement. Our first support is a very strong overlap support because the price has reacted and bounced off it multiple times in the past. If prices were to break this first support, the next key support to watch out for is 1.1630, which lines up with the 38.2% Fibonacci retracement.
In terms of resistance, our first resistance is 1.2435, which is also a very strong resistance because the price has reacted and bounced off it multiple times. If the price were to break it, it could potentially push up to our second resistance at 1.2671.
USD/CHF:
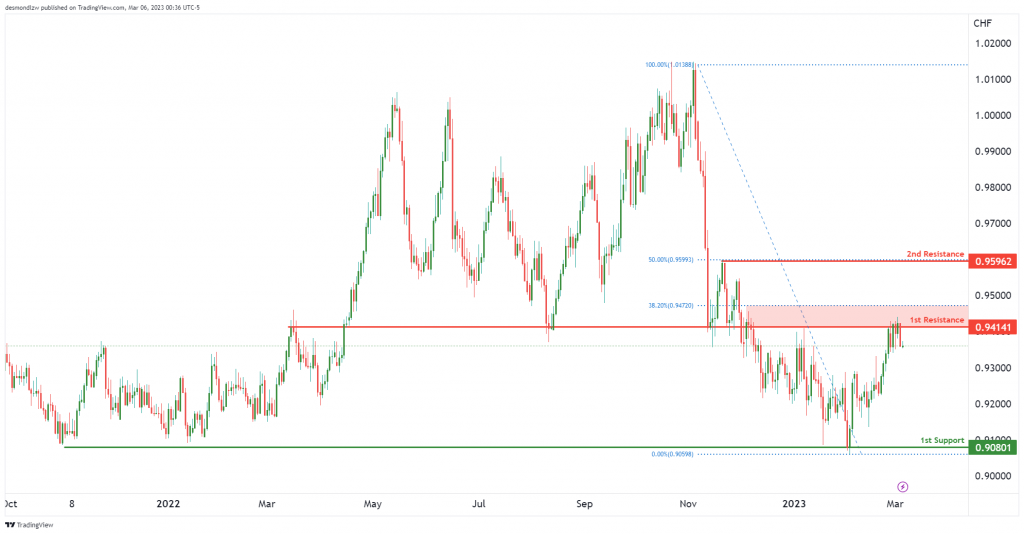
Price has reached our 1st resistance at 0.9414, which is a very strong resistance. If the price were to break this level, we could see a further push-up to our 2nd resistance at 0.9596. However, if prices fail to break the 1st resistance and instead reverse, we could see it drop to 1st support at 0.9080, which is a strong overlap support.
USD/JPY:
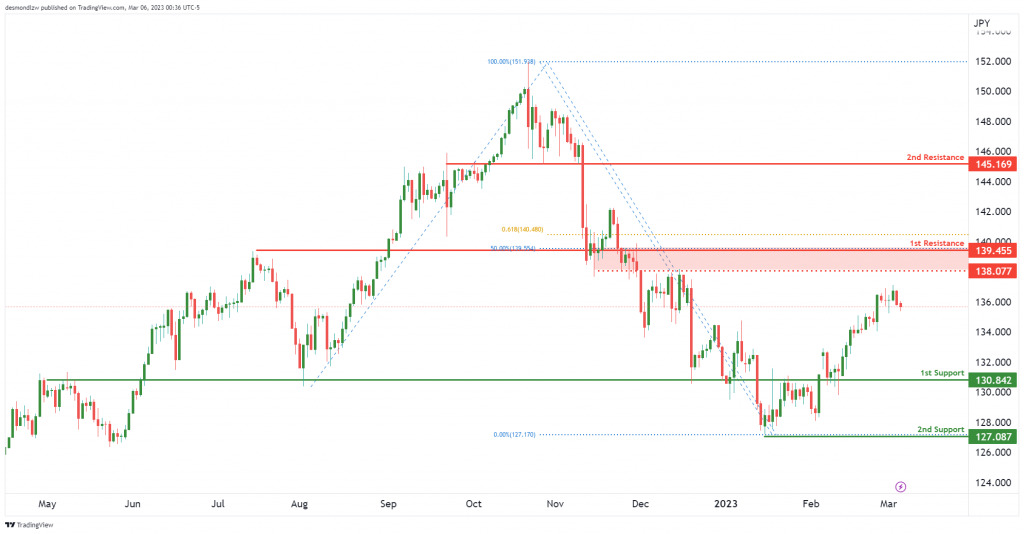
We are seeing that the price could potentially reach our first resistance at 138.077 with the 50% Fibonacci retracement, which is a strong overlap resistance.
In terms of support, we can see an overlap support at 130.84, which is our first support. If the price were to break this level, the price could drop to the second support at 127.08.
AUD/USD:
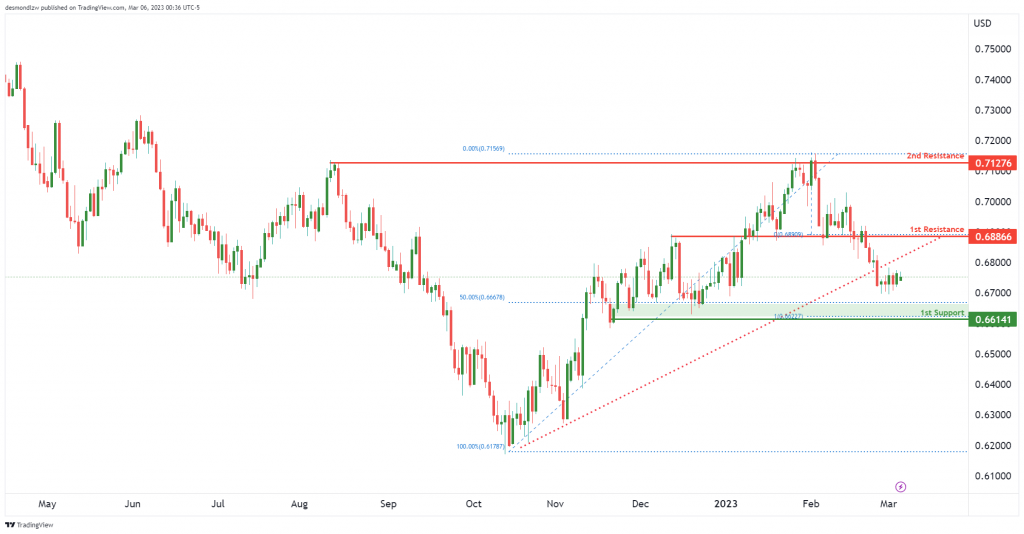
Price has broken from our ascending trendline, and it could come down to our first support area at 0.6614, along with the 50% Fibonacci retracement.
In terms of resistance, we can see overlap resistance at 0.6886. If the price were to break this level, it could potentially push up to our second resistance at 0.7127.
NZD/USD:
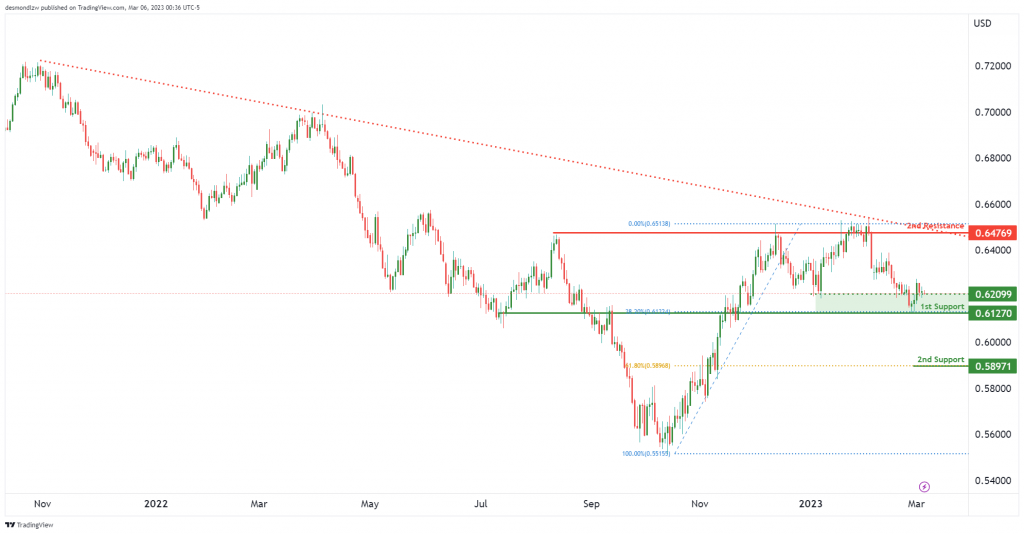
Price bounced off from our first support area at 0.6127, along with the 38.2% Fibonacci retracement. If the price were to break this level, it could potentially come down to our second support at 0.5897, along with the 61.8% Fibonacci retracement, which is strong overlap support.
In terms of resistance, the next swing high is 0.6476, which is a very strong overlap resistance along with the descending trendline.
USD/CAD:
We are seeing that the price has broken from the descending trendline and could potentially push up to our 1st resistance at 1.3707. If the price were to break this level, the next swing high is at 1.3981.
In terms of support, the first support of 1.3515 is a strong overlap support level. Breaking this level, the price could come down to our second support at 1.3232, which is another overlap support.
DJ30:
Price has bounced off from our first support at 32490, along with the 38.2% Fibonacci retracement. The price could potentially push up to the first resistance at 34370, which is overlap resistance where there are multiple touches in the past. If the price were to break this level, it could make its way up to the second resistance at 35399, which is the swing high.
In terms of support, if the price were to break from our first support, it could potentially come down to the second support at 31776, with the Fibonacci retracement.
GER30:
Price has reached our 1st resistance at 15677, and it has potentially come down to our 1st support at 14877
However, if the price were to break from the 1st resistance, the next swing high is 16275.
BTC/USD:
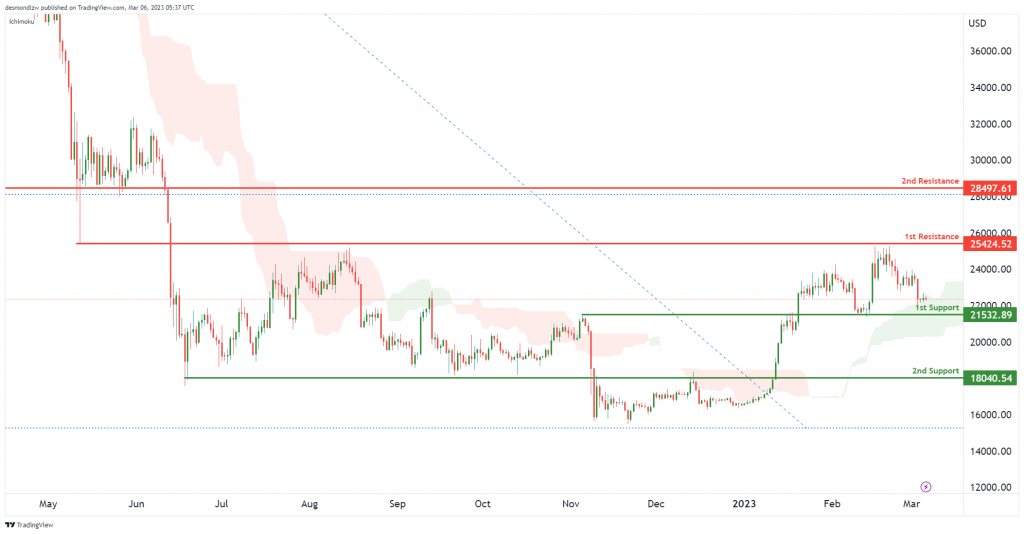
Our 1st resistance is at 25424, which is a very strong overlap resistance, and prices have reacted multiple times. If the price were to break, it could push up to our 2nd resistance at 28497.
In terms of support, the 1st support level is at 21532, and if it breaks, the next support is 18040, which is a very strong overlap support at this level.
US500:
We are seeing price testing our first support at 3918 and bouncing off from this level, pushing it up to our first resistance at 4145, which is overlap resistance. If the price were to break this level, we could potentially see the price push up to our second resistance at 4319, which is another overlap resistance.
However, if the price could not break through our first resistance, we could potentially see the price drop to our first support at 3918, and the second support is at 3759.
ETH/USD:
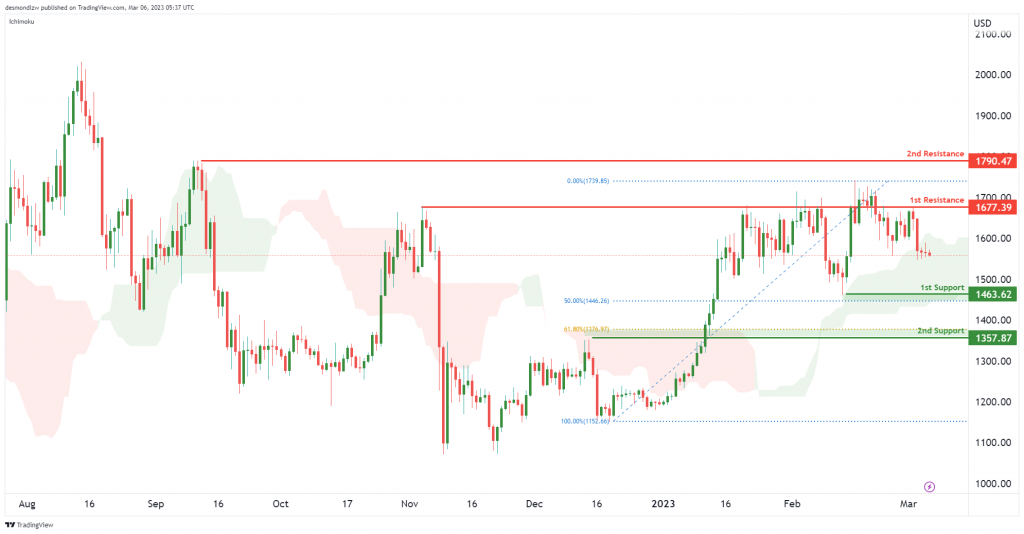
Price is testing our 1st resistance at 1677 where the overlap resistance is. The price is coming down to find the 1st support at 1463 with the 50% Fibonacci retracement. If the price were to break at this level, the next support is at 1357 with the 61.8% Fibonacci retracement.
In terms of resistance, if the price were to break the 1st resistance, the next swing high is at 1790.
BCO/USD:
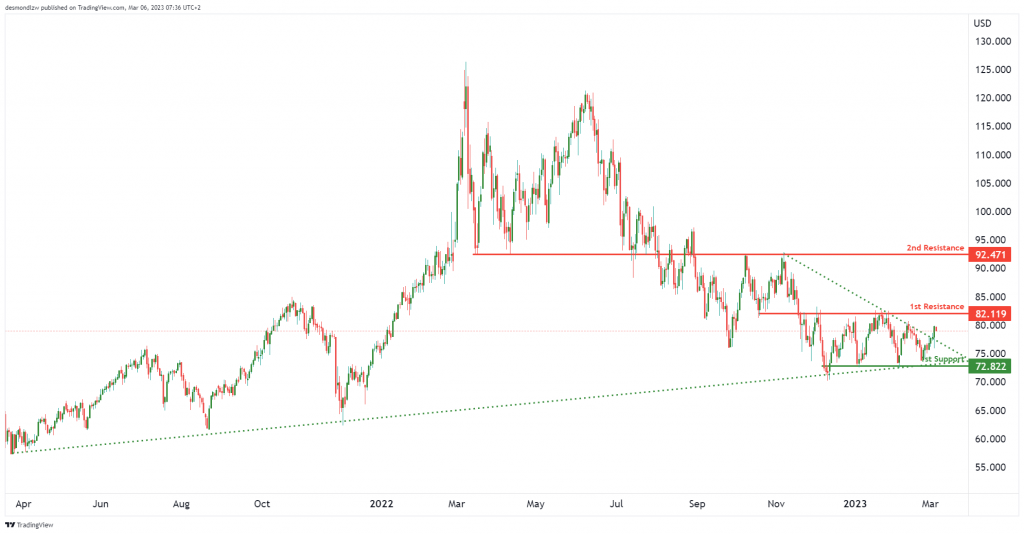
We are seeing that the price has broken off from the descending resistance, and it has the potential to push up to our first resistance at 82.119, which is overlap resistance. If the price were to break from this level, it could push up to our second resistance at 92.47, which is a strong overlap at this level.
However, the first support is at 72.82, which is a recent swing low support along with the ascending support line.
XAU/USD (GOLD):
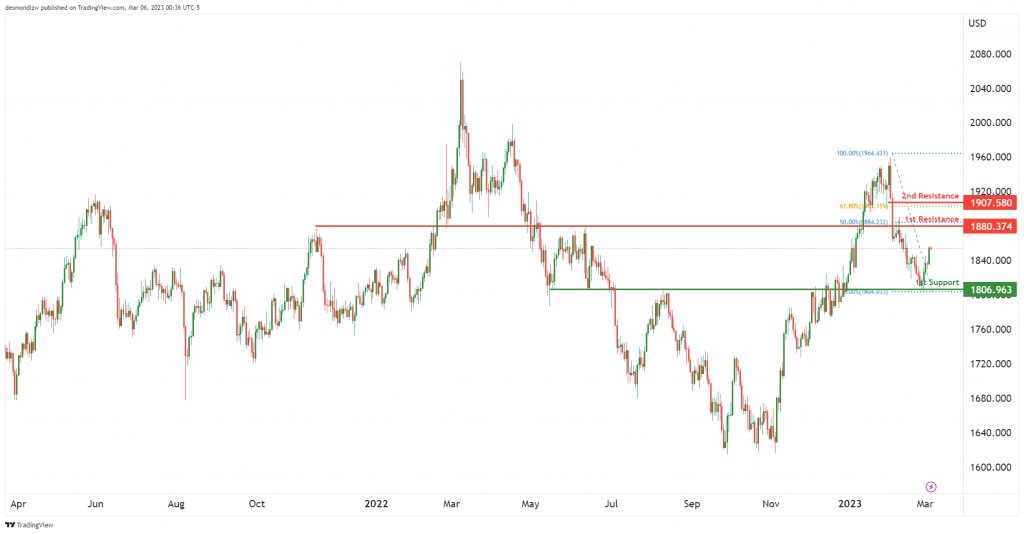
Price has bounced off from our first support and it could potentially push up to our first resistance level at 1880 with the 50% Fibonacci retracement. However, if the price were to break, it could push up to our second resistance level at 1907 with the 61.8% Fibonacci retracement.
The accuracy, completeness and timeliness of the information contained on this site cannot be guaranteed. IC Markets does not warranty, guarantee or make any representations, or assume any liability regarding financial results based on the use of the information in the site.
News, views, opinions, recommendations and other information obtained from sources outside of www.icmarkets.com, used in this site are believed to be reliable, but we cannot guarantee their accuracy or completeness. All such information is subject to change at any time without notice. IC Markets assumes no responsibility for the content of any linked site.
The fact that such links may exist does not indicate approval or endorsement of any material contained on any linked site. IC Markets is not liable for any harm caused by the transmission, through accessing the services or information on this site, of a computer virus, or other computer code or programming device that might be used to access, delete, damage, disable, disrupt or otherwise impede in any manner, the operation of the site or of any user’s software, hardware, data or property.


