A note on lower timeframe confirming price action…
Waiting for lower timeframe confirmation is our main tool to confirm strength within higher timeframe zones, and has really been the key to our trading success. It takes a little time to understand the subtle nuances, however, as each trade is never the same, but once you master the rhythm so to speak, you will be saved from countless unnecessary losing trades. The following is a list of what we look for:
- A break/retest of supply or demand dependent on which way you’re trading.
- A trendline break/retest.
- Buying/selling tails/wicks – essentially we look for a cluster of very obvious spikes off of lower timeframe support and resistance levels within the higher timeframe zone.
- Candlestick patterns. We tend to stick with pin bars and engulfing bars as these have proven to be the most effective.
We search for lower timeframe confirmation between the M15 and H1 timeframes, since most of our higher-timeframe areas begin with the H4. Stops are usually placed 5-10 pips beyond confirming structures.
EUR/USD:
Weekly gain/loss: + 157 pips
Weekly closing price: 1.1138
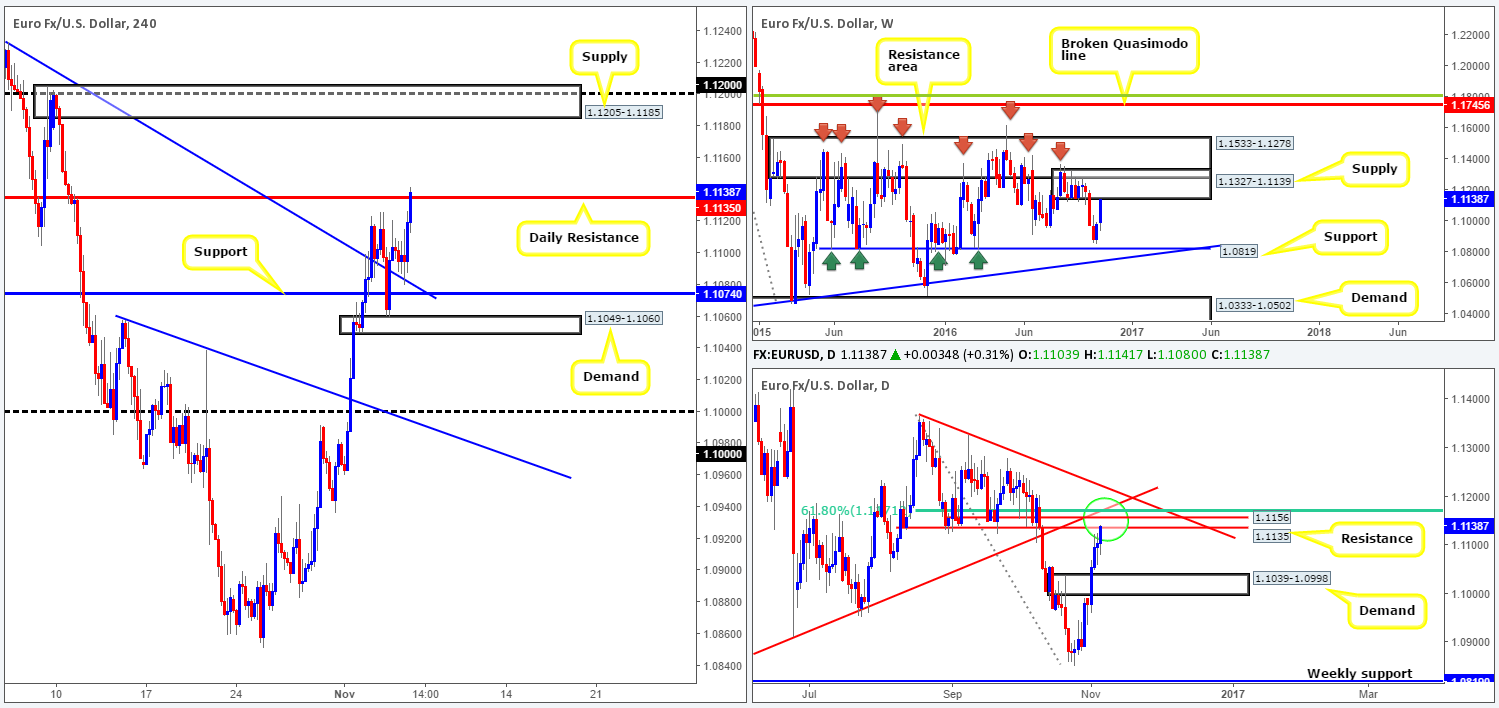
Weekly view: The US dollar continued to sag against the EUR last week, resulting in the pair connecting with the underside of a supply area seen at 1.1327-1.1139. Not only does this zone boast strong downside momentum, it also happens to be glued to the underside of a major resistance area drawn from 1.1533-1.1278 that has capped upside in this market since May 2015.
Daily view: Turning our attention to the daily chart, we can see that the pair recently touched base with a resistance level penciled in at 1.1135. Perhaps the most compelling factor here, however, is that just above this number, there’s a strong-looking collection of daily structural convergence made up of the following: a daily trendline resistance taken from the low 1.0516, a 61.8% FIB resistance at 1.1771 and also a quarterly open line extended from September at 1.1156 (green circle).
H4 view: A quick recap of Friday’s trade shows that there were no drastic moves seen following the US employment release. The non-farm employment change came in slightly lower than expected at 161k for the month of October. Be that as it may, August and September’s prints were upwardly revised by 44k. This – coupled with a tick higher seen in average hourly earnings at 0.4%, as well as the unemployment rate falling to 4.9%, as expected, could be enough juice to hike US rates in December.
The day ended closing marginally above the aforementioned daily resistance barrier at 1.1135, following a beautiful to-the-pip rebound off a trendline support drawn from the high 1.1279.
Direction for the week: Technically speaking, we feel the major is structurally overbought given both the weekly and daily timeframes (see above). Therefore, a selloff could potentially be seen down to daily demand coming in at 1.1039-1.0998 (the next downside target on the daily timeframe).
Direction for today: Today’s action will likely be slow for two reasons. Firstly, the economic calendar is reasonably light, and secondly, tomorrow is Election Day and is what the majority of the market has been waiting for. Technically, nonetheless, there’s a chance we may see price punch its way up to the underside of a H4 supply at 1.1205-1.1185. This zone is located around the top edge of the daily convergence zone mentioned above, along with being housed within the above said weekly supply. As such, it’s highly likely to produce a healthy reaction.
Our suggestions: Speaking as a technician, the only area we’d consider trading from is the above said H4 supply zone. Nevertheless, looking at this market from a fundamental standpoint, we’d only look to trade this H4 supply zone today, so as to give price a chance to move in our favor, prior to the elections.
Data points to consider: There are no high-impacting events due for release on Monday.
Levels to watch/live orders:
- Buys: Flat (stop loss: N/A).
- Sells: 1.1205-1.1185 (reasonably sized H4 bearish close required prior to entry – stop loss: ideally beyond the trigger candle or the supply zone itself).
GBP/USD:
Weekly gain/loss: +330 pips
Weekly closing price: 1.2515
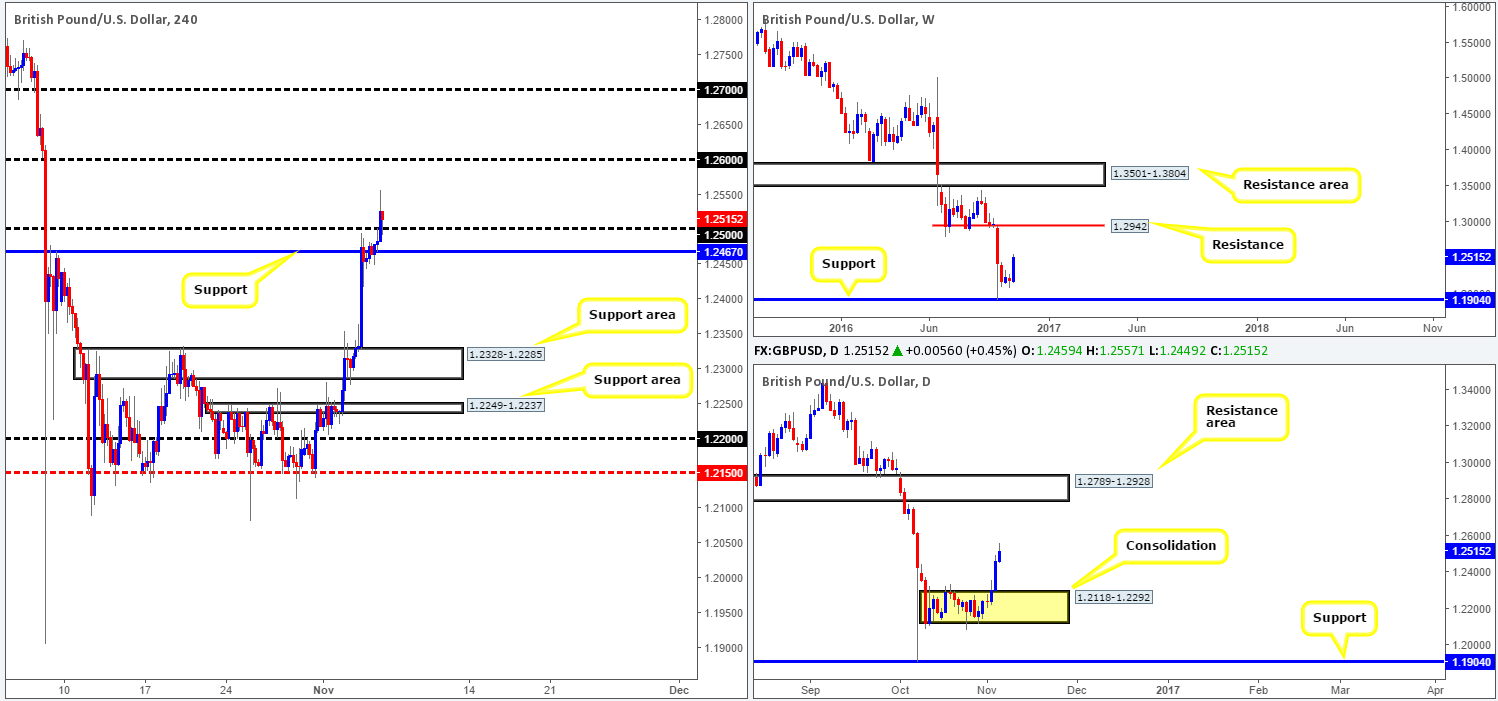
Weekly view: GBP bulls went on the offensive last week, bringing price to highs of 1.2557 into the close. Looking at this market from a monthly timeframe perspective, last week’s rally should not have raised too many eyebrows as technically, monthly price recently touched base with demand seen here:
From the weekly chart, nevertheless, the candles are now seen trading mid-way between the support at 1.1904 and resistance found at 1.2942.
Daily view: With the market seen breaking through the top edge of the consolidation zone at 1.2292 on Thursday, the instrument has opened itself up to the possibility of further buying this week toward the resistance area registered at 1.2789-1.2928 (sits directly below the aforementioned weekly resistance level).
H4 view: As can be seen from the H4 chart, the GBP/USD barely responded following the release of Friday’s US employment situation. What we did see, nonetheless, was price come within a cat’s whisker of retesting the recently broken resistance at 1.2467 as support, before rallying to a fresh weekly high of 1.2557. For those who read Friday’s report you may recall that our team highlighted this as a move to keep an eye open for. The reason for us not taking the long here was simply because our desk wanted to see more of a defined H4 bullish close off the top of 1.2467.
Direction for the week: Ultimately, we believe the unit is heading higher this week until we reach the above said daily resistance zone. This, of course, will likely be dependent on how Tuesday’s US presidential election plays out.
Direction for today: Given that price has now established a position above the 1.2467 H4 mark, and retested the 1.25 handle going into the week’s close, our team is now eyeing the 1.26 barrier as a possible target today.
Our suggestions: Between the 1.2467 level and 1.25, this area will, in our opinion, collectively bolster sterling today. With that said, our team will be looking for lower timeframe (confirmed) entries long from this area (see the top of this report for lower timeframe entry techniques), targeting 1.26. A push beyond 1.26 is, of course, possible as well, but with the US elections just around the corner, we don’t want to push it!
Data points to consider: There are no high-impacting events due for release on Monday.
Levels to watch/live orders:
- Buys: 1.2467/1.25 ([lower timeframe confirmation required prior to entry] stop loss: dependent on where one confirms this area).
- Sells: Flat (stop loss: N/A).
AUD/USD:
Weekly gain/loss: + 76 pips
Weekly closing price: 0.7670
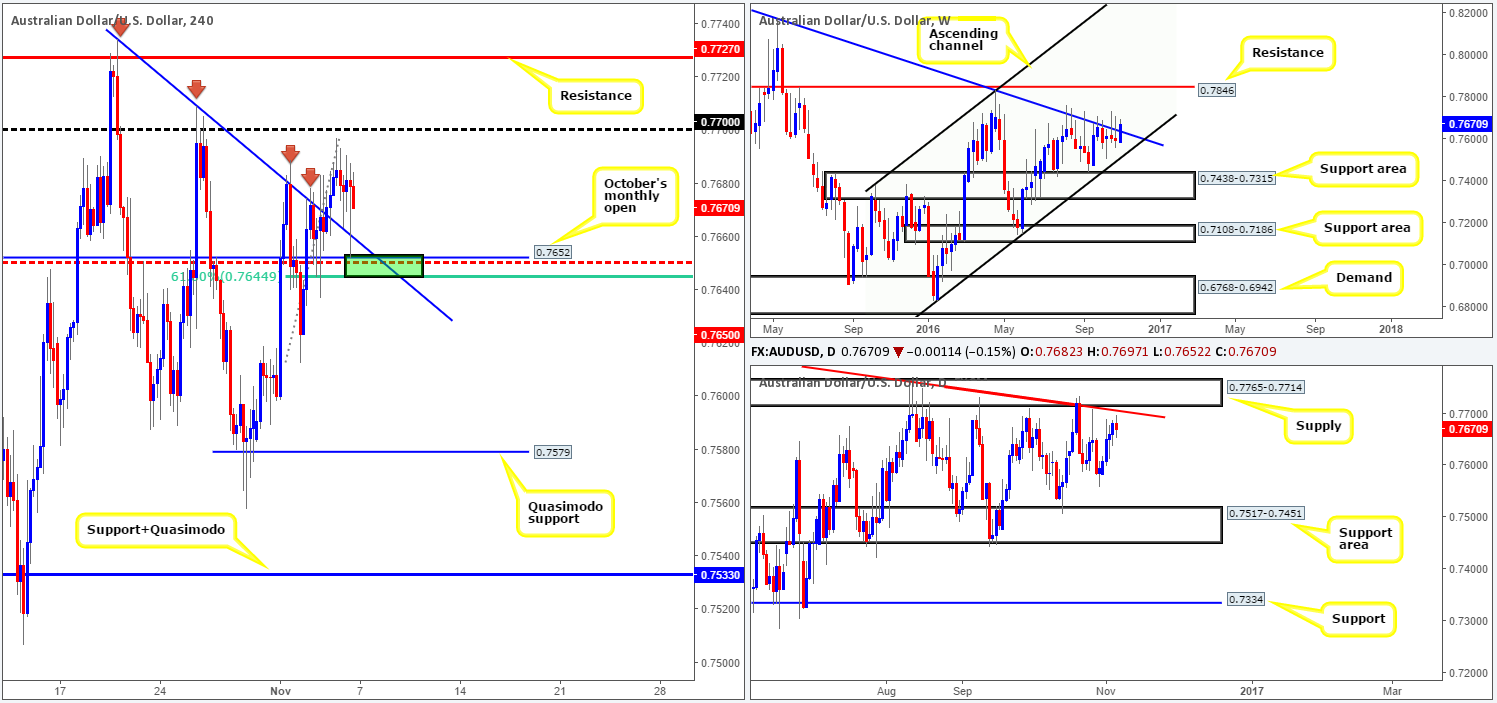
Weekly view: Following two bearish back-to-back selling wicks, the commodity currency changed course last week and rallied higher. This, as you can see, forced the market to close above a trendline resistance taken from the high 0.8295 (now acting support) which has potentially opened the trapdoor for a move north this week up to resistance chalked in at 0.7846.
Daily view: Despite the weekly chart indicating further buying may be on the cards this week, we cannot ignore the fact that the daily candles ended the week closing just ahead of both a trendline resistance taken from the high 0.7835 and a supply zone seen chiseled in at 0.7765-0.7714. Withstanding numerous bullish attacks, this area of resistance has managed to cap upside since May! Therefore, it deserves respect.
H4 view: The impact of Friday’s US job’s report was relatively minimal. What was interesting regarding Friday’s movements though was that we saw price whipsaw through trendline support extended from the high 0.7734 and touch ground with October’s monthly open level at 0.7652.
Direction for the week: In light of the current higher-timeframe structure, medium-term direction is tricky. Buyers face opposition from the aforementioned daily supply and its partnering trendline resistance, while sellers have to contend with the possibility of follow-through buying above the current weekly trendline. Hence, we do not currently have a preference on weekly direction.
Direction for today: Regardless of weekly direction, we feel a bounce could be seen from the 0.7644/0.7652 region today (green rectangle). Building a case for entry we have the following structures:
- The aforementioned H4 trendline support.
- October’s monthly open at 0.7652.
- H4 61.8% FIB support at 0.7644.
- H4 mid-way support at 0.7650.
Our suggestions: While a bounce from the above said H4 buy zone is likely, we have to keep in mind that the bigger picture is neutral for the time being, as in no definite direction is being seen as far as structure is concerned (see above). Furthermore, as October’s monthly open has already been tested, bids may have been weakened around this vicinity. As such, we would advise waiting for a lower timeframe confirming buy signal to form prior to pulling the trigger here (see the top of this report for ideas on how to accomplish this). Generally speaking, this enables traders to get in at a better price, it also lessen the risk of being taken out on a fakeout and improves overall risk/reward.
With the above points taken on board, keep in mind that investor focus is likely to be on Tuesday’s US elections and could cause unexpected moves in the financial markets.
Data points to consider: There are no high-impacting events due for release on Monday.
Levels to watch/live orders:
- Buys: 0.7644/0.7652 region ([lower timeframe confirmation required prior to entry] stop loss: dependent on where one confirms this area).
- Sells: Flat (stop loss: N/A).
USD/JPY:
Weekly gain/loss: – 157 pips
Weekly closing price: 103.09
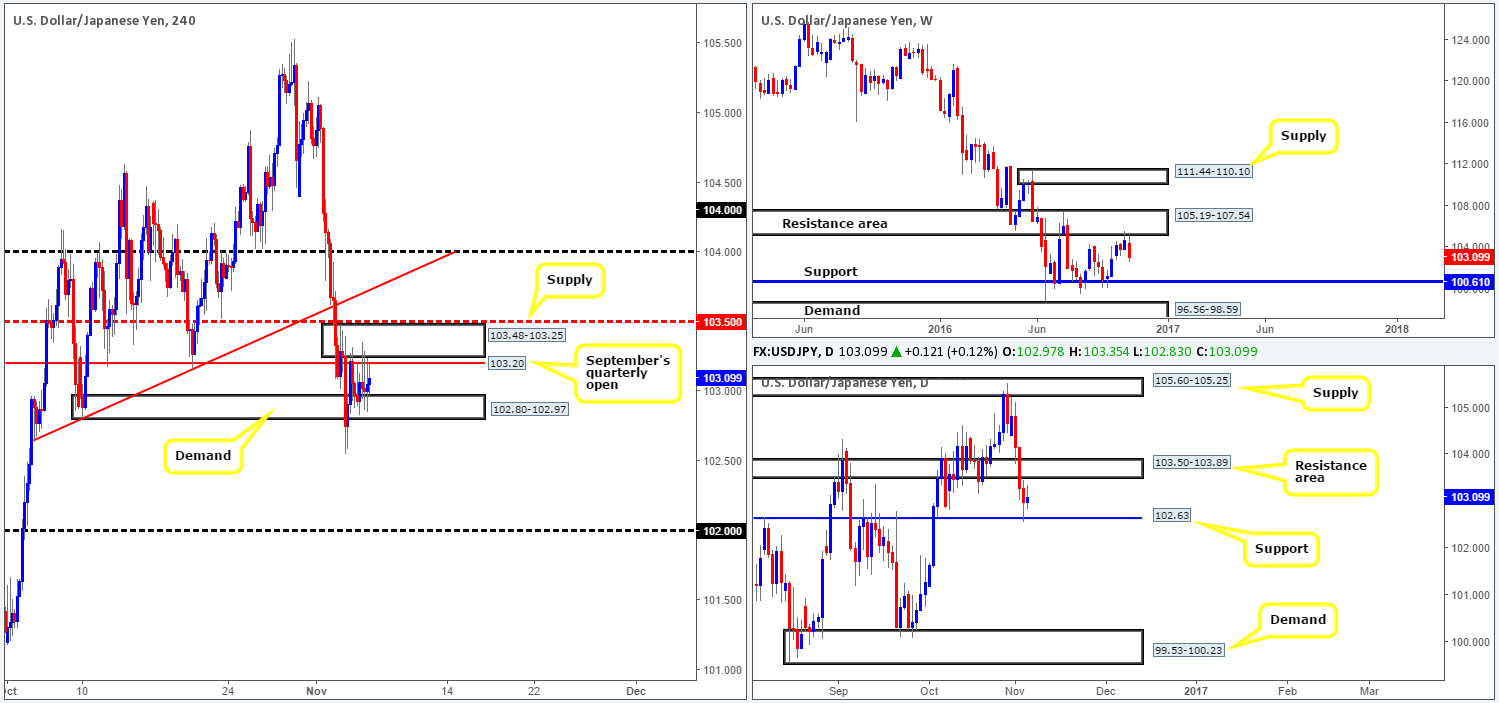
Weekly view: After connecting with the underside of a resistance area drawn from 105.19-107.54 two weeks ago, the buyers, as you can see, took a backseat. Engulfing three prior weekly candles, last week’s run to the downside has, in our estimation, possibly set the stage for a continuation move south to support coming in at 100.61.
Daily view: However, before one places a sell order in this market, you may be interested to know that daily price recently checked in at a support level drawn from 102.63, which held firm going into the weekly close. As a result, our desk would prefer the aforementioned support level to be taken out before looking to short this market in line with weekly flow. A close below this barrier would, as far as we can see, open up the floodgates for prices to challenge the demand zone seen at 99.53-100.23, which happens to be located directly below the above said weekly support.
H4 view: Friday’s US job’s report had little effect on the pair’s movements. In fact, the unit spent the entire day restrained by a supply zone at 103.48-103.25 (bolstered by September’s quarterly open at 103.20) and a demand registered at 102.80-102.97.
Direction for the week: Until the daily support level at 102.63 is taken out, our team remains neutral. Once/if a close is seen beyond this structure, the market will likely slip lower throughout the week.
Direction for today: In that there’s very little noteworthy economic data set to hit the wire today, it’s possible that the pair may remain range bound between the above said H4supply and demand. Ideally though, we’re looking for a decisive close beyond the H4 demand.
Our suggestions: A decisive close beyond the current H4 demand would likely indicate that daily support at 102.63 is the next line on the hit list to be taken out. Therefore, a close below the H4 demand followed up with a retest and a reasonably sized H4 bear candle would, in our book, be considered sufficient enough to condone a short entry in this market, with an ultimate target set at 100.61: the weekly support. However, considering that US elections are set to take the spotlight tomorrow, you may find that technicals take a back seat during this time, so do trade carefully!
Data points to consider: There are no high-impacting events due for release on Monday.
Levels to watch/live orders:
- Buys: Flat (stop loss: N/A).
- Sells: Watch for a close below the H4 demand at 102.80-102.97 and then look to trade any retest seen thereafter (H4 bearish close following the retest is required prior to entry – stop loss: ideally beyond the trigger candle).
USD/CAD:
Weekly gain/loss: + 8 pips
Weekly closing price: 1.3399
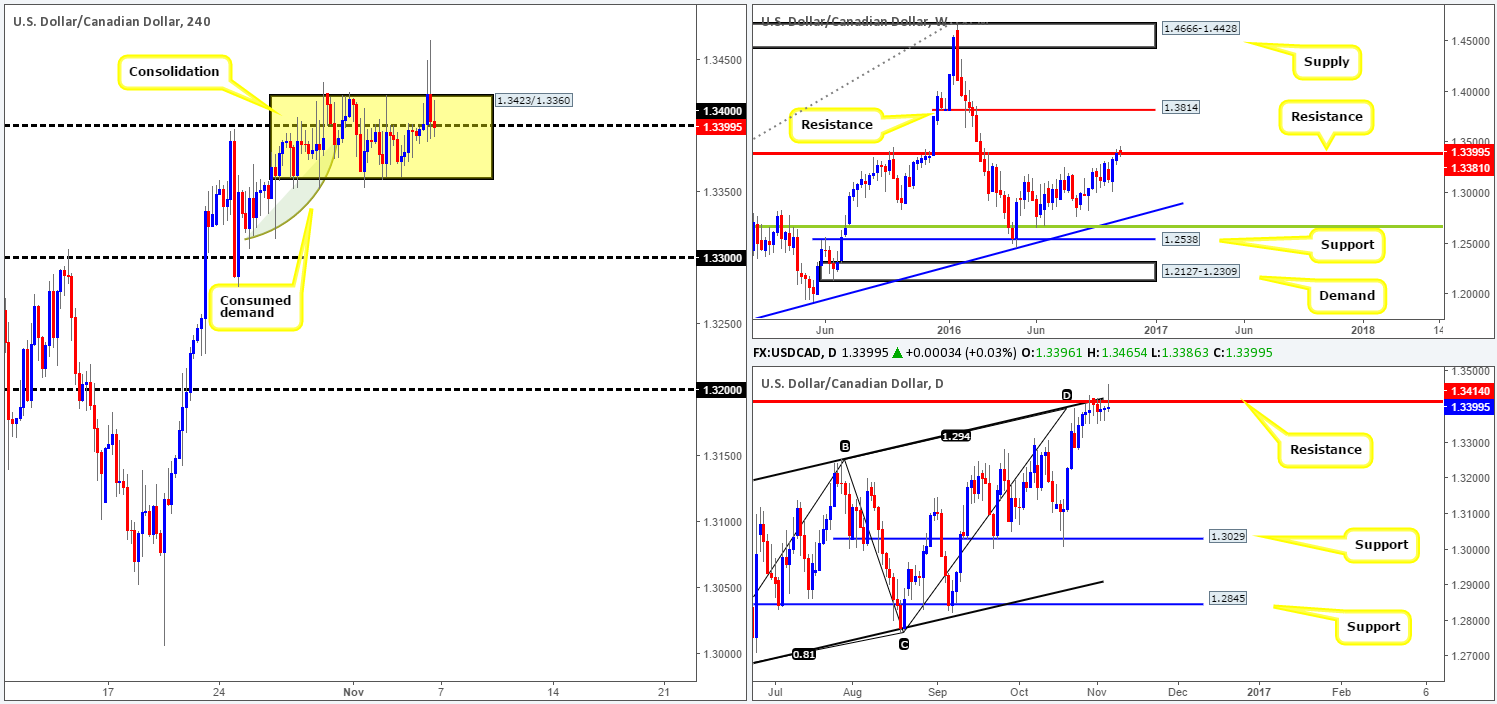
Weekly view: The USD/CAD pair, as you can see, remained relatively unchanged going into last week’s closing point. The unit did, however, continue to trade slightly above resistance penciled in at 1.3381. In the event that the bulls take their foot off the brake here, the next goal will likely be to achieve 1.3814: a resistance level.
Daily view: Before price can take off north, nevertheless, the resistance level at 1.3414 would need to be engulfed, along with its converging AB=CD completion point around the 1.3384ish range and a channel resistance taken from the high 1.3241. It may also be worth noting that Friday’s candle printed a beautiful-looking bearish selling wick that pierced through the above said resistance level. To candlestick traders this pattern, coupled with its location, is highly likely to be a sell signal.
H4 view: Shortly after the release of US and Canadian employment data, the pair climbed to fresh highs of 1.3465. Be that as it may, the rally was a short-lived one, as prices tumbled lower going into the US open and closed the week back within the current H4 range fixed between 1.3423/1.3360.
Direction for the week: Seeing as how the weekly candle made little attempt to trade north last week, and the fact that there’s a strong-looking daily selling tail seen around the collection of daily resistances noted above, our team feels lower prices are likely on the horizon this week.
Direction for today: With investors now eyeing the US elections tomorrow, price action may take on a more subdued stance today and continue to consolidate within the current H4 range. Ultimately though, we would like to witness a close below this formation as we’ll explain below.
Our suggestions: Ideally, a close beyond the current H4 consolidation would be fantastic, as not only would this likely confirm downside strength from the above said higher-timeframe structures, it would also set the stage for a possible downside move towards the 1.33 handle, since there’s little active demand seen to the left of current price.
Data points to consider: There are no high-impacting events due for release on Monday.
Levels to watch/live orders:
- Buys: Flat (stop loss: N/A).
- Sells: Watch for a close below the H4 lows 1.3360 and then look to trade any retest seen thereafter (H4 bearish close following the retest is required prior to entry – stop loss: ideally beyond the trigger candle).
USD/CHF:
Weekly gain/loss: – 195 pips
Weekly closing price: 0.9679
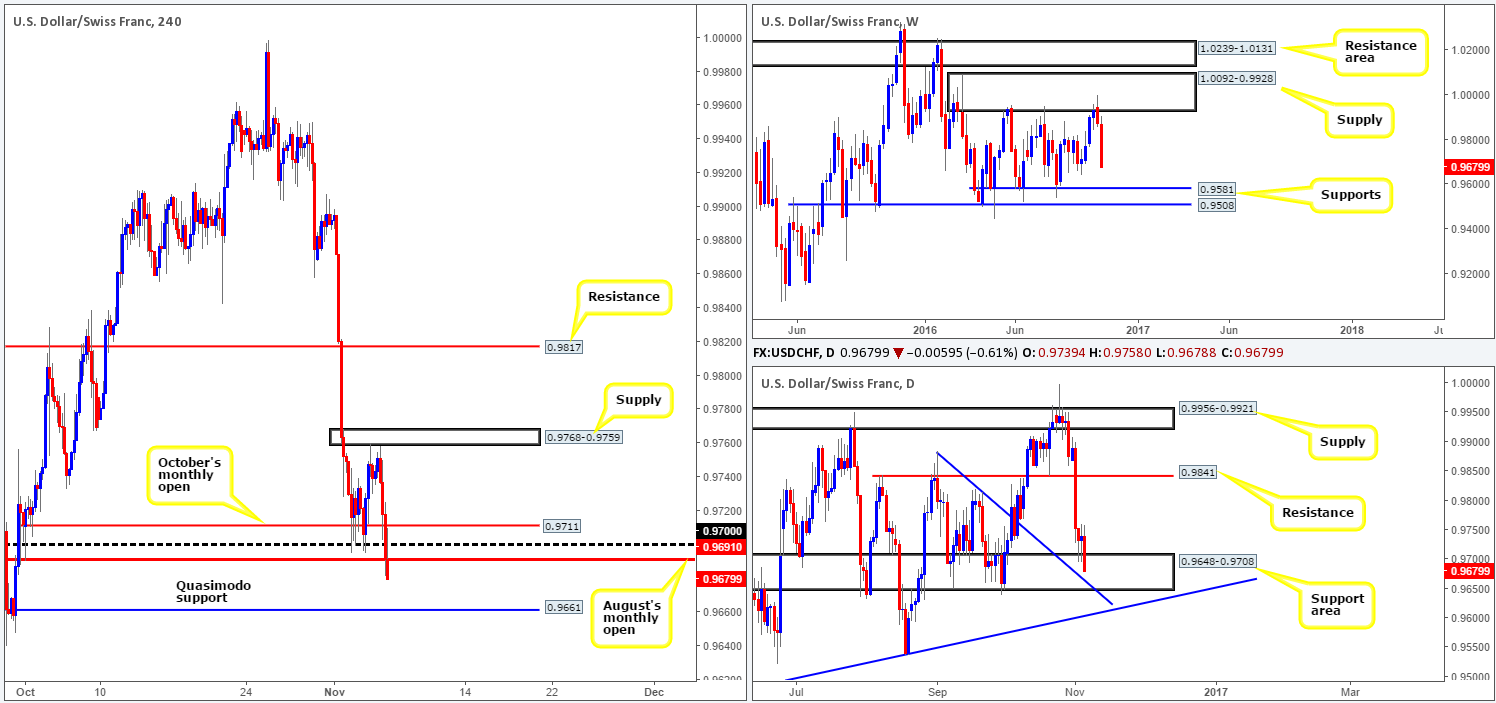
Weekly view: Recent action shows that the Swissy extended its bounce from the underside of the supply at 1.0092-0.9928 last week, chalking up an impressive full-bodied bearish candle into the close. To our way of seeing things, as long as the bears continue to dig lower here there’s a possibility that the pair will shake hands with support at 0.9581, which represents the lower edge of the current weekly range in play (1.0092-0.9928/0.9581).
Daily view: Zooming in and looking at the daily picture, the candles are currently testing a support area carved from 0.9648-0.9708. Of particular interest here is the trendline support taken from the high 0.9884, and also the trendline support seen lurking directly below the current support area extended from the low 0.9443.
H4 view: Reviewing Friday’s action on the H4 chart reveals that price drove through multiple support structures, in spite of the US jobs report coming in relatively positive. Going by the close, we see room for the market to extend lower this morning down to a H4 Quasimodo support at 0.9661.
Direction for the week: Direction for the week is unclear. Weekly action looks to be on course to push lower this week, while daily structure shows a support area and a combined daily trendline support potentially hindering downside.
Direction for today: The aforementioned H4 Quasimodo support is a key level for our desk today. The area itself is fresh, as well as it sitting within the above said daily support area and fusing nicely with the daily trendline support penciled in from the high 0.9884.
Our suggestions: Put simply, watch for price to connect with the H4 Quasimodo support and wait for a reasonably sized H4 bullish close to take shape. Should this come to fruition, our team would look to buy here, targeting 0.9711/0.9679, which is made up of the following structures: October/August monthly open levels and the psychological boundary 0.97.
Of course, if the H4 bull candle is too large, we will likely pass since risk/reward would not be in our favor at that point.
Data points to consider: There are no high-impacting events due for release on Monday.
Levels to watch/live orders:
- Buys: 0.9661 region ([reasonably sized H4 bullish close required prior to entry] stop loss: ideally beyond the trigger candle).
- Sells: Flat (stop loss: N/A).
DOW 30:
Weekly gain/loss: – 293 points
Weekly closing price: 17884
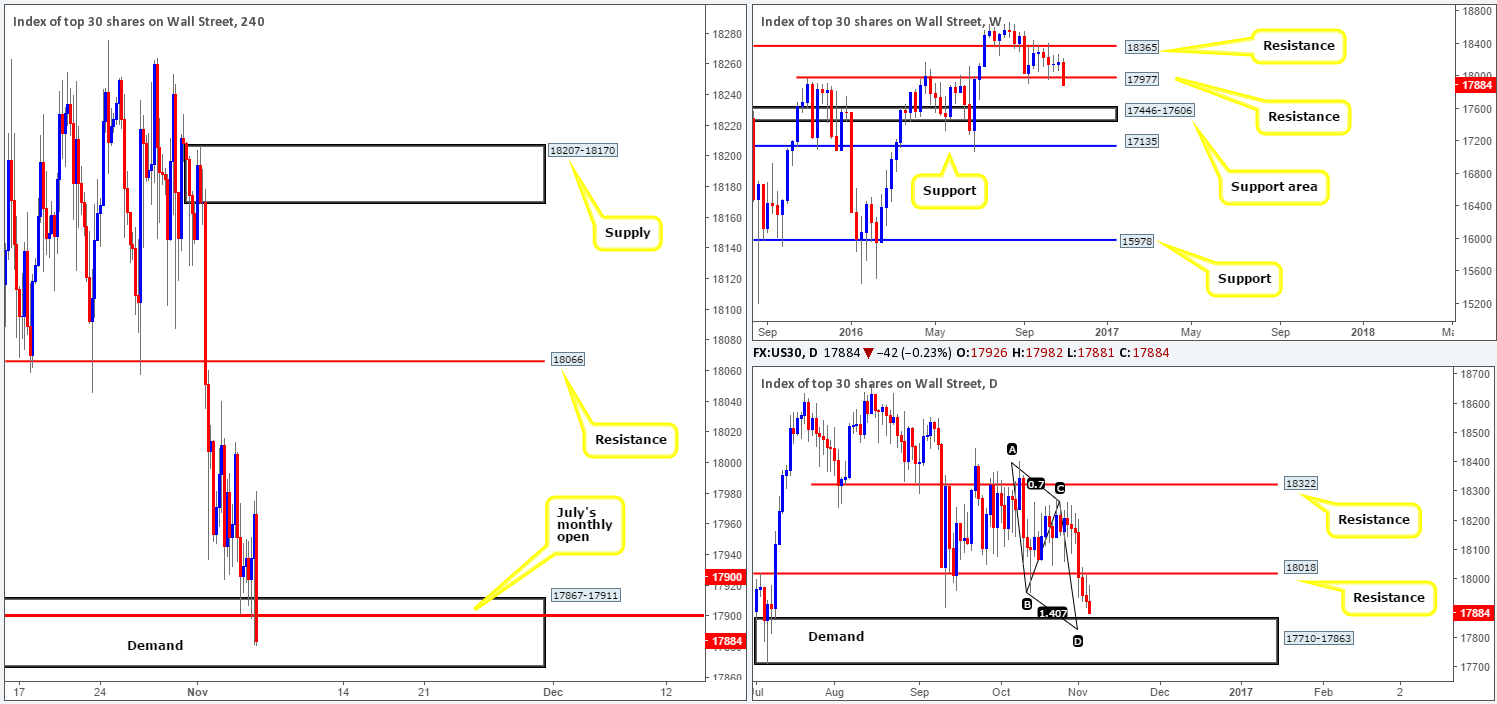
Weekly view: The recently closed weekly candle, as you can see, slipped below support at 17977 last week (now acting resistance) and has, to a large extent, increased the chances of a continuation move south this week down to a support area derived at 17446-17606.
Daily view: The story on the daily chart, however, is a little different. The equity market recorded its seventh consecutive daily loss on Friday, consequently placing the daily candles just ahead of a demand base coming in at 17710-17863.What’s also noteworthy here is that there’s also an AB=CD pattern completion point (taken from the high 18404) lodged within the said demand at 17827.
H4 view: The technical picture on the H4 chart reveals that price bounced from July’s monthly open 17900 (lodged within a demand base at 17867-17911) during Friday’s action, and managed to clock a high of 17881. Friday’s relatively strong job’s report supports the possibility that the Fed may hike rates before the year end. This – coupled with upcoming US elections tomorrow, likely triggered Friday’s late selloff into the close, consequently breaching July’s monthly open level.
Direction for the week: On the one hand, weekly action indicates that the sellers are in control, but on the other hand, daily action is trading nearby a demand area loaded with an AB=CD completion point (see above). If this was not conflicting enough, the US elections will likely cause technicals to take a backseat! Therefore, as of this point, we are hesitant to even guess how this week will end.
Direction for today: In spite of the above points, we still have interest in the H4 demand seen at 17710-17793 (not seen on the screen) for a possible long position. This zone sits within the extremes of the current daily demand, and is positioned just below the completion point (17827) of the daily AB=CD pattern as well as merging with July’s quarterly open level at 17788 . Granted, this would mean buying into potential weekly flow, but given the confluence seen around this area, we believe expecting a bounce from here, at least technically, is valid.
Our suggestions: Keep an eye on the H4 demand area mentioned above at 17710-17793 today. While this is a high-probability reversal area, we must reiterate the fact that tomorrow’s US elections could distort price action. Therefore, to be on the safe side guys, we would advise only trading this area following a reasonably sized H4 bull candle.
Levels to watch/live orders:
- Buys: 17710-17793 ([reasonably sized H4 bullish close required prior to entry] stop loss: ideally beyond the trigger candle).
- Sells: Flat (stop loss: N/A).
GOLD:
Weekly gain/loss: + $28.5
Weekly closing price: 1304.2
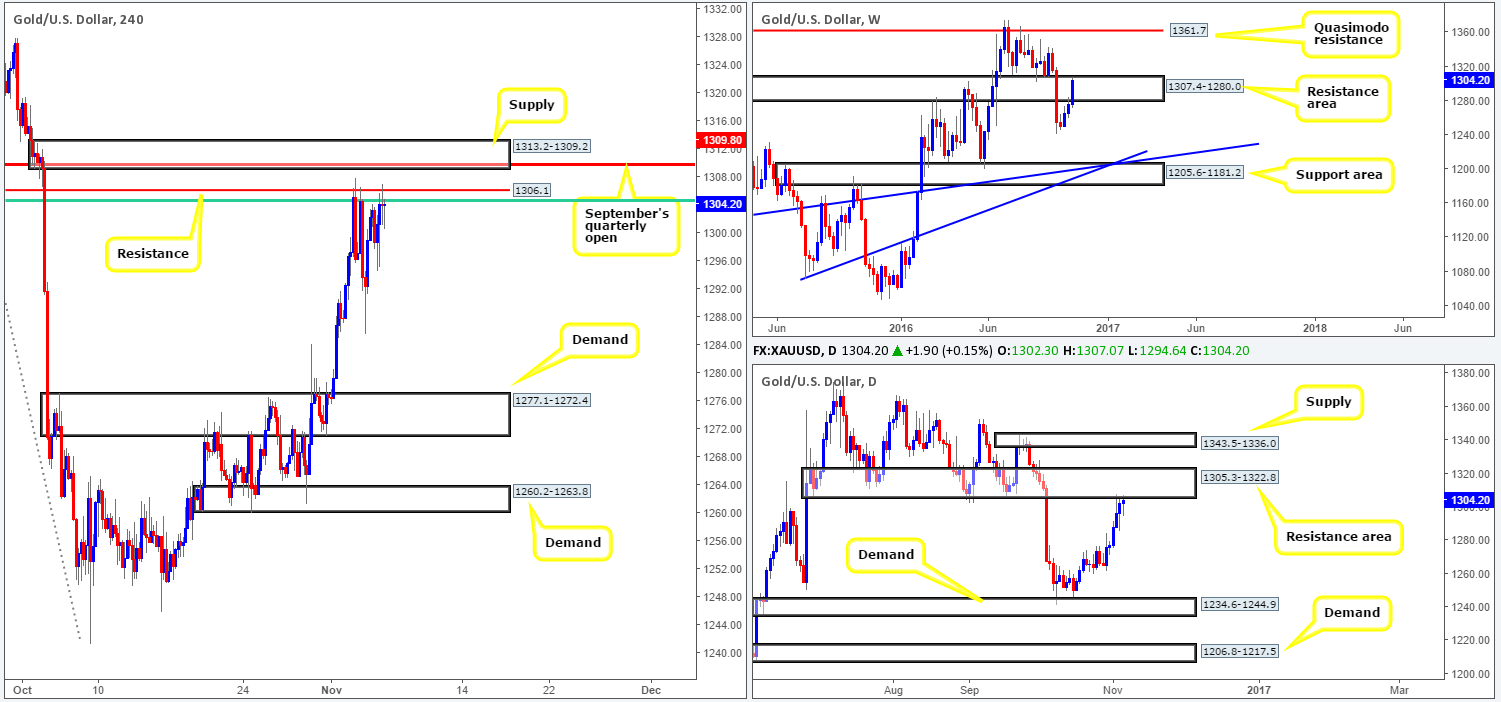
Weekly view: From the weekly viewpoint, we can see that bullion pressed higher into the resistance area coming in at 1307.4-1280.0 last week. This move marks the third consecutive weekly gain for this market since bottoming out at lows of 1241.2. A decisive close above the current barrier could bring about a rally up to the Quasimodo resistance drawn in at 1361.7.
Daily view: While the bears appear on the back foot on the weekly chart, daily bullish momentum looks to be diminishing since connecting with the resistance area coming in at 1305.3-1322.8. The next target to have an eye on beyond this area falls in at a supply area drawn from 1343.5-1336.0, while a downside move could see the yellow metal revisit demand at 1234.6-1244.9.
H4 view: Friday’s US job’s report saw the metal aggressively strike lows of 1295.2, before changing gear and heading north to highs of 1307.0. Overall, the impact was minimal though given resistance at 1306.1 held firm (bolstered by a 61.8% Fib resistance at 1304.5 [green line]).
Direction for the week: According to higher-timeframe structure (see above), there’s a good chance the gold market may reverse this week. Although we believe this to be valid from a technical standpoint, one has to keep the fundamentals in mind this week, specifically Tuesday’s US elections which could place technicals on the bench during this time!
Direction for today: We really like the H4 supply seen above the current H4 resistance at 1313.2-1309.2. The zone demonstrates strong downside momentum (always a good sign), sits just above the aforementioned weekly resistance area, and is lodged within the current daily resistance area as well as fusing nicely with September’s quarterly open at 1309.8.
Our suggestions: Though the above said H4 supply is attractive, we still advise caution here. Not because of the technicals mind you, more to do with the fundamentals this week. Should the zone see some action today, we would, if the H4 chalks up a lower timeframe sell signal (M15/H1), look to short from here, and attempt to protect our position prior to Election Day. As far as lower timeframe confirmation goes, we would like to see either an engulf of a demand followed up by a retest, a trendline break/retest or simply a collection of well-defined selling wicks seen within or around the H4 supply.
Levels to watch/live orders:
- Buys: Flat (stop loss: N/A).
- Sells: 1313.2-1309.2 ([lower timeframe confirmation required prior to entry] stop loss: dependent on where one confirms this area).
