Pivot point calculation can be tedious for some but there are traders that find this method very reliable when coming up with shorter-term trade setups. Trading the news or economic events can also be combined with intraday setups using pivot points.
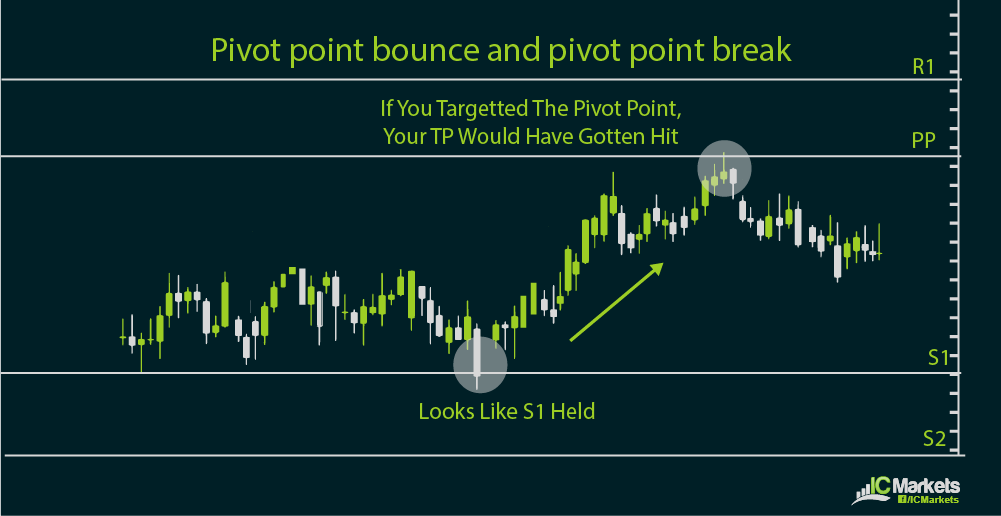
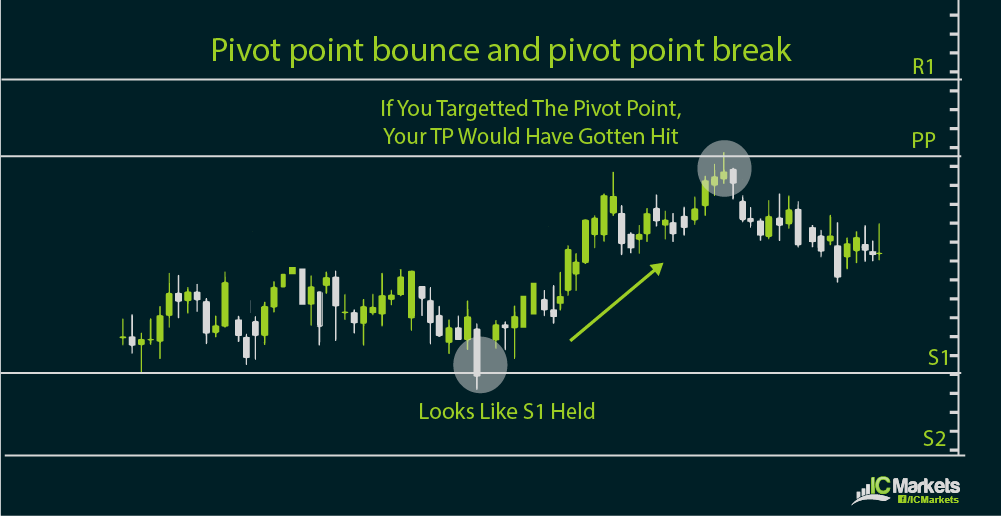
In particular, range traders look at pivot points for potential reversals in price action. Trend traders watch breakouts from pivot points to see if further gains or losses are about to take place.
Pivot point formulas generate support and resistance levels, along with the pivot point for the day. The basic formula derives the pivot point by getting the average of the previous high, low, and close.
From there, the first support level is calculated by multiplying the pivot point by two then subtracting the previous high. The first resistance level is calculated by multiplying the pivot point by two then subtracting the previous low.
The second support level is calculated by adding the pivot point to the difference of the previous high and low. The second resistance level is calculated by subtracting the difference of the previous high and low from the pivot point.
Charting software and most trading platforms usually have these pivot point calculators or tools that can automatically generate these inflection points so there is no need to memorize the formulas. However, it’s important to have an idea of how these levels are generated in order to better take advantage of the potential trading methods using these tools.
Other pivot point calculation methods exist and might be more effective means of determining inflection points, depending on your trading method. For instance, there’s the Woodie pivot point method which generates very different support and resistance levels from the basic one.
Another kind of pivot point calculation is the Camarilla equation, which can generate as much as four support and resistance levels. Fibonacci pivot point methods are also an option, possibly when a trader is looking to combine these levels with Fibonacci retracement or extension points during a market trend.
There is no saying which among these methods is the best one, as it varies depending on market conditions or how these inflection points are incorporated in one’s trading strategy. What is important is that the trader has a clear understanding of how the support and resistance levels are generated in order to figure out if it is an appropriate trading method.
The simplicity and objectivity of pivot points makes it one of the most watched levels among forex traders, giving the inflection points a self-fulfilling trait. Buy or sell orders could be located around pivot points, especially when these line up with major or minor psychological levels.
In addition, the flexibility of using pivot points as levels to watch for range and trend traders makes it more appealing to use. The convenience of having pivot point calculators also makes for an easy-to-use trading method.


