Key risk events today:
UK GDP m/m; UK Manufacturing Production m/m; China New Loans; BoE Gov. Carney Speaks; ECB Monetary Policy Meeting Accounts; US CPI m/m and Core CPI m/m.
EUR/USD:
Wednesday’s FOMC Meeting Minutes failed to generate much market movement – policymakers believed 25bp cut was needed, pointing to economic outlook, risk management and inflation objectives – as traders’ focus remains on US and China trade talks in Washington today.
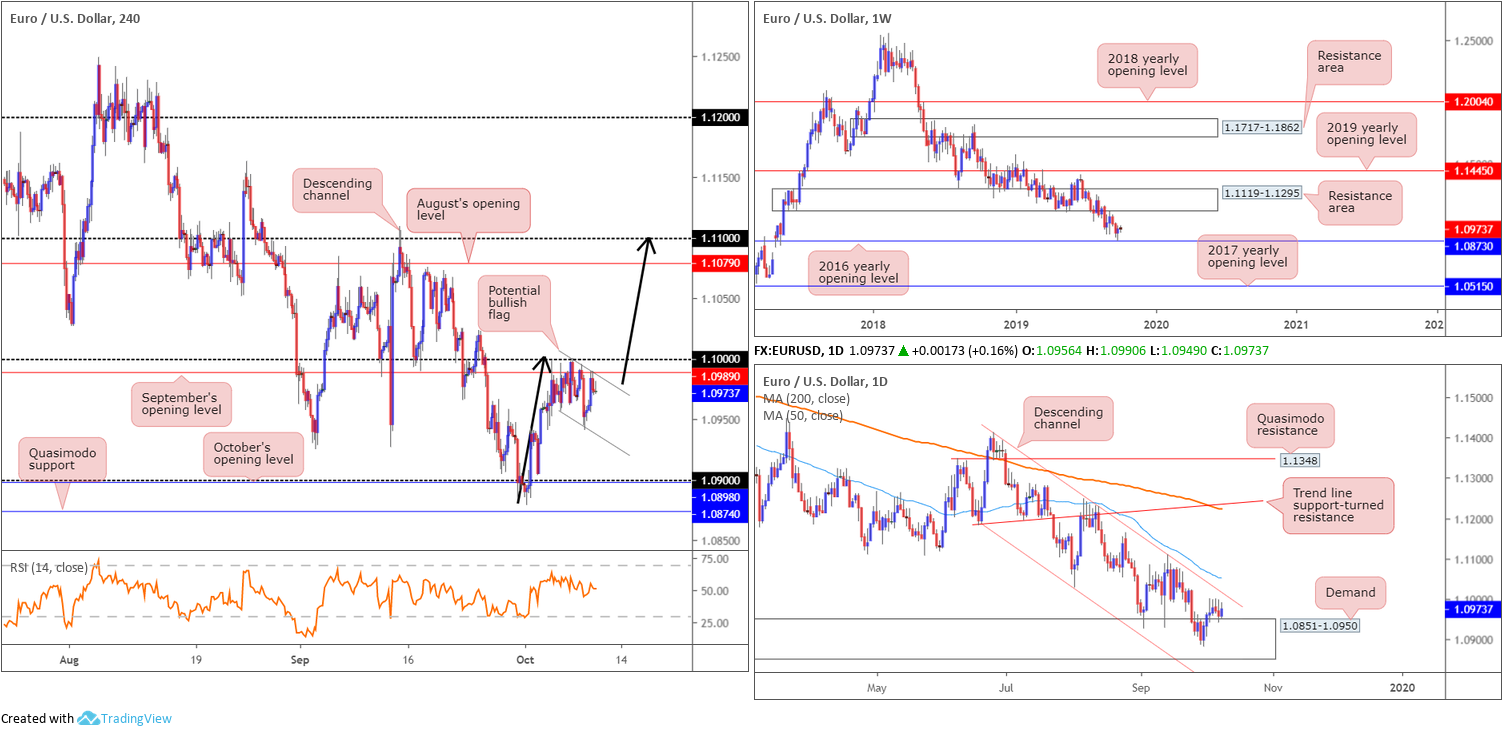
Since the opening of the week, H4 price has been chalking up a bullish flag scenario south of the key figure 1.10 and September’s opening level at 1.0989. A decisive breakout above the upper perimeter of the bullish flag has a measured take-profit target (the preceding move added to the breakout point – black arrows) at the 1.11 handle, sited a few points north of August’s opening level at 1.1079.
On more of a broader perspective, daily price is grappling with the top edge of a demand zone at 1.0851-1.0950 – formed April 2017. Upside objectives from this region are reasonably close by at channel resistance (extended from the high 1.1412), closely shadowed by the 50-day SMA (blue – 1.1051). Higher up on the curve we have weekly movement holding things higher ahead of the 2016 yearly opening level at 1.0873 – a notable weekly support/resistance line which happens to be housed within the lower limits of the said daily demand area.
Areas of consideration:
While a breakout of the upper boundary of the H4 bullish flag may be attractive for longs, traders may want to consider the possibility of sellers entering the fray off daily channel resistance (1.1412) which is positioned directly above the bullish flag. To circumvent this issue, consider waiting for a daily close to form above the daily channel before executing a long position (entry at the close is then an option with a protective stop-loss order beneath the daily breakout candle’s lower shadow) – consider it a filter. By clearing the daily channel, the only thing, technically that is, stopping price from reaching the bullish flag’s take-profit target is the 50-day SMA.
GBP/USD:
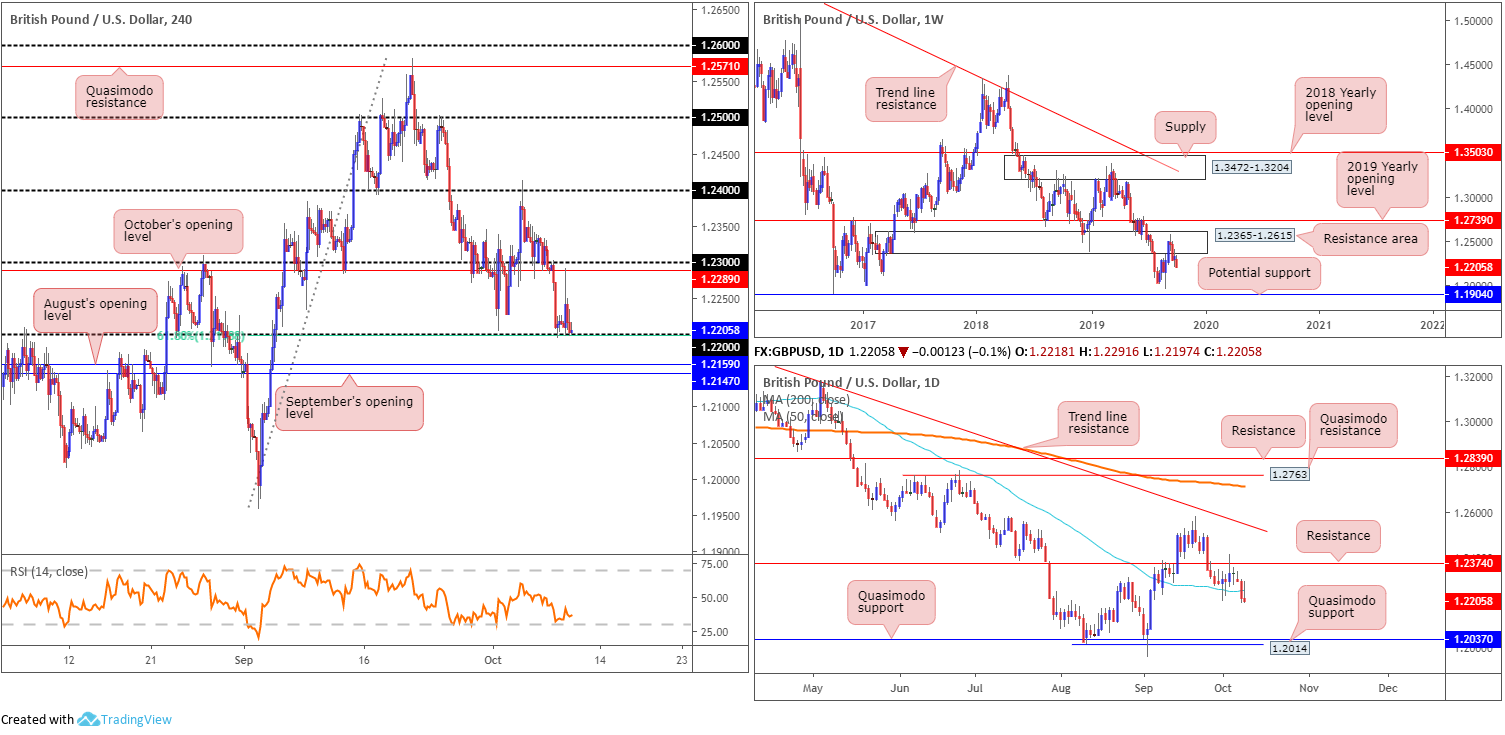
A spike in sterling to a session high of 1.2291 materialised amid London hours Wednesday, on the back of a time limited backstop rumour. The headline, however, was later denied by EU officials, also considered non-viable by DUP representatives. Following a test of October’s opening level at 1.2289 based on the H4 timeframe, the GBP/USD receded to the lower end of its current range, hovering a touch north of the 1.22 handle and a 61.8% Fibonacci ratio. Beneath 1.22, traders’ crosshairs are likely fixed on September and August’s opening levels at 1.2147 and 1.2159, respectively.
Technical research on the higher timeframes remains unchanged from yesterday’s technical briefing. Weekly price has a long-term resistance area at 1.2365-1.2615 posted as a dominant structure, currently plugging upside. Assuming further downside is seen, the 1.1958 September 2 low and 1.1904 – held price action strongly higher in October 2016 – are the next supports in the firing range. The immediate trend on this timeframe (1.4376) has faced a southerly trajectory since April 2018, with a break of 1.1904 confirming the larger downward trend that began mid-2014. A closer reading on the daily timeframe shows the 50-day SMA (blue – 1.2251) gave way Tuesday and held lower Wednesday, portending a possible shift towards two layers of Quasimodo support at 1.2014 and 1.2037.
Areas of consideration:
Outlook unchanged.
As stated in Wednesday’s report, any reaction observed off 1.22 was unlikely to deliver much more than the underside of the said 50-day SMA (1.2251), according to higher-timeframe structure. Price marginally exceeded this forecast and tested 1.2289. The report went on to state that a similar scenario exists for the two monthly levels seen at 1.2147/1.2159, though action will likely be capped by 1.22 as resistance.
On account of the above, a H4 close beneath 1.2147/1.2159 is still eyed, followed by a possible move to the daily Quasimodo supports at 1.2014 and 1.2037. Following a close lower, entry at the close of the breakout candle is an option, though others may prefer to wait and see if a retest of the violated supports occur before pulling the trigger. This adds confirmation to the mix and provides entry and risk levels to trade based off the rejection candle’s structure.
AUD/USD:
AUD/USD ended mostly unmoved Wednesday, though marginally penetrated the lower edge of Tuesday’s range. Latest movement, or lack of, is likely due to traders’ focus remaining on US and China trade talks. Senior US and Chinese officials square off today, with higher tariffs looming if negotiators fail to break a five-month stalemate.
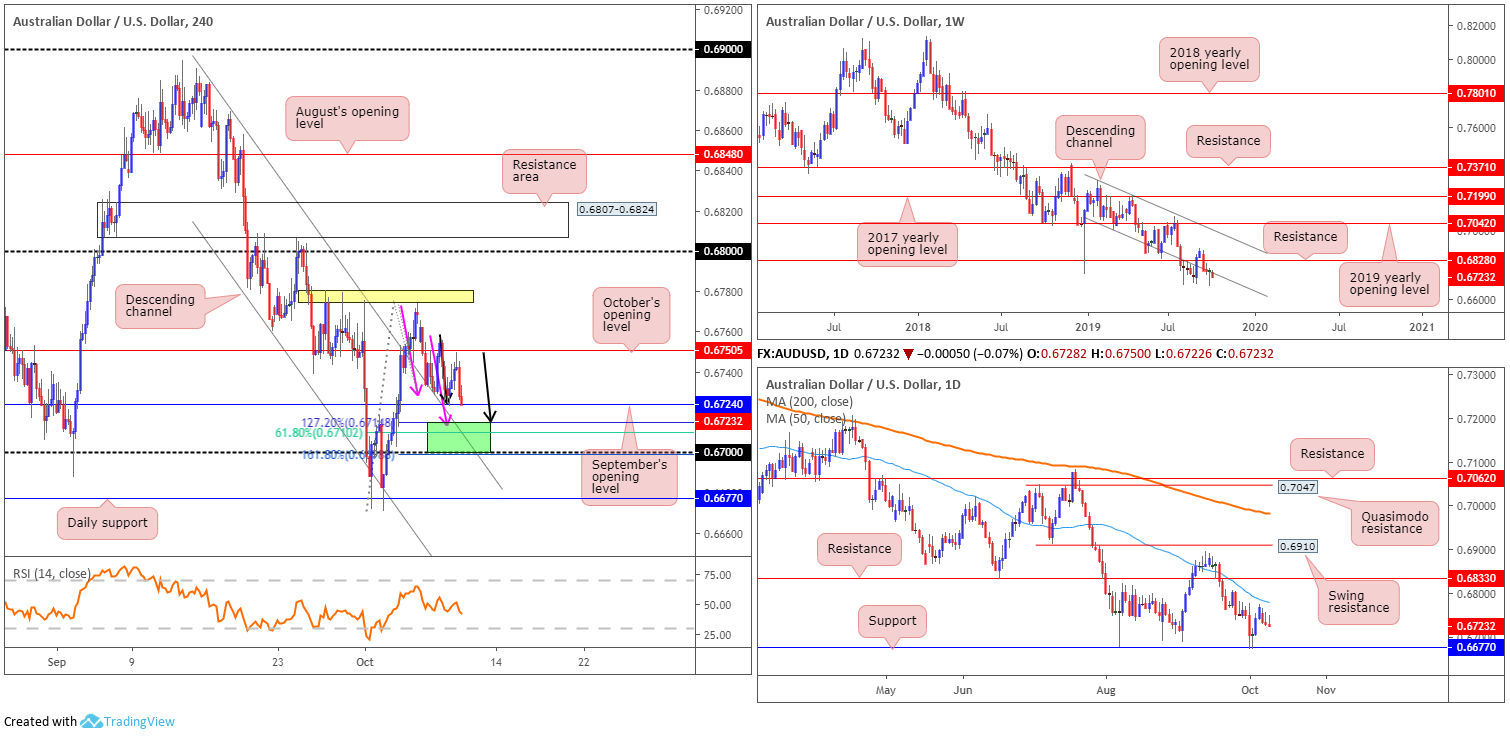
September’s opening level at 0.6724 remains in motion on the H4 timeframe after, once again, failing to overthrow October’s opening level at 0.6750. As underlined in Wednesday’s technical briefing, an appealing area of H4 support resides a touch beneath 0.6724 between 0.6699/0.6714 (green). Comprised of two potential AB=CD corrections (pink and black arrows), largely formed by the 127.2%/161.8% area at 0.6714/0.6699, a channel resistance-turned support (extended from the high 0.6883), the round number 0.67 and a 61.8% Fibonacci ratio at 0.6710, this area boasts sufficient confluence to hold price, at least for a bounce.
Against the backdrop of H4 flow, however, daily price continues to reflect a negative atmosphere, holding south of its 50-day SMA (blue – 0.6778) and portending a possible shift back to familiar support at 0.6677.
Technical action on the weekly timeframe had price attempt to take hold of its channel support (taken from the low 0.7003) last week, concluding in the shape of a hammer candlestick pattern (considered a bullish signal). Buyers, as of current price though, appear unenthusiastic. Driving lower from here and dethroning daily support highlighted above at 0.6677 could have dire consequence for the pair, with limited support not seen on the weekly timeframe until reaching 0.6359 (level not visible on the screen).
(Italics represent parts extracted from Wednesday’s analysis)
Areas of consideration:
Outlook unchanged.
Although the noted H4 support zone at 0.6699/0.6714 holds limited higher-timeframe convergence, local confluence on the H4 timeframe is likely enough to hold price action higher, with the possibility of a run back up to October’s opening level at 0.6750 (this also marks the 61.8% Fibonacci retracement of legs A-D – a common take-profit target for AB=CD patterns). Traders concerned by the threat of further selling on the higher timeframes may elect to wait and see if the H4 candles chalk up a bullish signal before committing funds. Entry and risk levels can then be determined according to the candle’s framework, with the added confidence buyers are likely present.
USD/JPY:
A reasonably buoyant dollar – dollar index holding north of 99.00 – coupled with US equities advancing amid upbeat sentiment, lifted the USD/JPY to fresh weekly peaks of 107.62 Wednesday.
Traders who read Wednesday’s technical research may recall the following pieces:
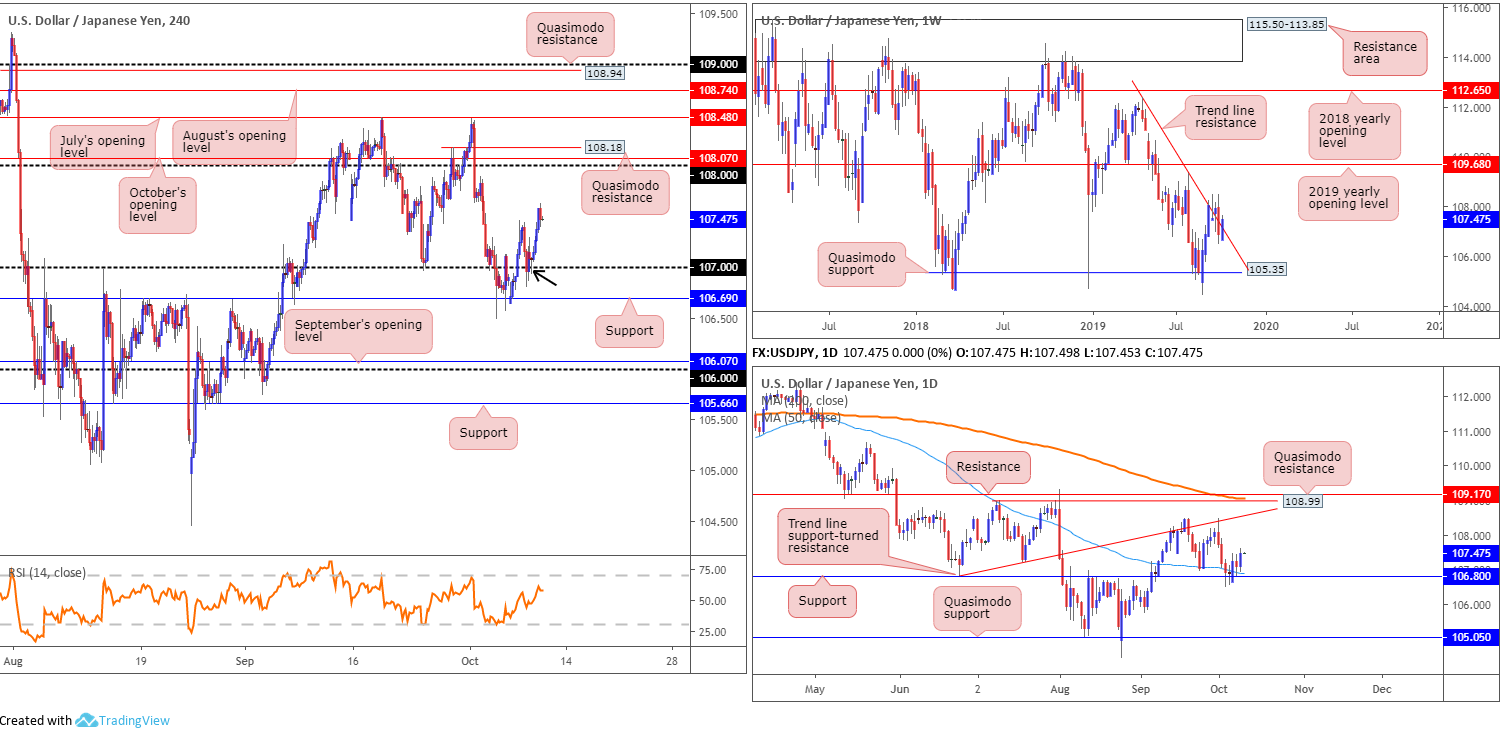
The holding at 107 on the H4 is likely interpreted as daily buyers strengthening their grip on support at 106.80/the 50-day SMA (blue – 106.89), which could encourage a run to 108 on the H4. As underscored in Tuesday’s technical briefing, the round number merges closely with October’s opening level at 108.07 and a Quasimodo resistance at 108.18. With respect to the next upside target on the daily timeframe, the trend line support-turned resistance (taken from the low 106.78) is in the firing range, shouldered closely together with Quasimodo resistance at 108.99, the 200-day SMA (orange – 109.06) and resistance coming in at 109.17.
Longer term, weekly action recently crossed back above a familiar trend line resistance extended from the high 112.40. As the low of last week’s bearish outside pattern (106.48) has yet to be tested, a short based on this formation has not been triggered. Quasimodo support at 105.35 is eyed as the next downside target on this scale, while to the upside, the 2019 yearly opening level falls in as the next resistance point at 109.68.
It was also noted that longs were a possibility off 107, though waiting for additional candlestick confirmation to form before pulling the trigger was recommended. As evident from the H4 timeframe this morning, price action pencilled in a H4 hammer candlestick formation off 107 – considered a bullish signal (black arrow) – before the day’s advance.
Areas of consideration:
Traders long 107 have likely reduced risk to breakeven, with some locking in partial profits. In terms of take-profit targets, the 108 handle is a logical starting point, with extreme levels plotted at daily resistance drawn from 109.17.
USD/CAD:
FOMC minutes failed to deliver any surprises Wednesday; the US dollar index remained afloat north of 99.00 and WTI prices continue to range a few points north of daily support priced in at $50.78.
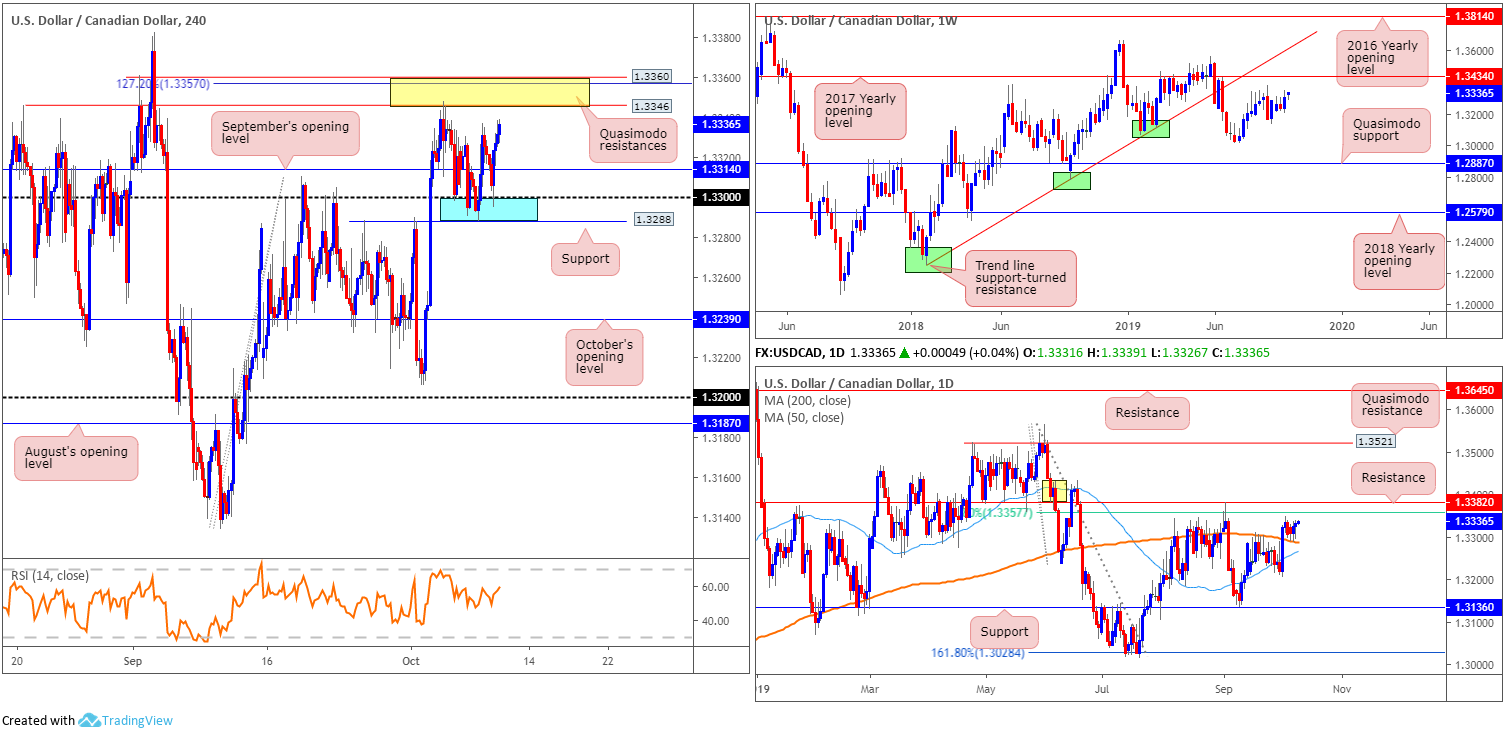
Research based on the weekly timeframe of USD/CAD has the current candle threatening further upside as it approaches the top edge of last week’s action (1.3347), a bullish outside formation. The next upside hurdle can be seen around 1.3434: the 2017 yearly opening level.
In conjunction with weekly structure, daily price holds ground above the 200-day SMA (1.3287), with nearby resistance eyed at 1.3382/the 61.8% Fibonacci ratio at 1.3357. Also of interest is the 50-day SMA (1.3266) threatening a possible crossover (also known as a ‘Golden Cross’) as it angles towards the underside of the 200 SMA.
Closer analysis on the H4 timeframe reveals the support (blue) between 1.3288/1.33 has thus far done a superb job in holding price action higher. 1.3360/1.3346, two H4 Quasimodo resistances marked yellow, remains fixed as the next upside target. Note within the upper boundary of this range we also have a 127.2% Fibonacci ext. point at 1.3357 along with the 61.8% Fibonacci ratio on the daily timeframe priced at the same value.
Areas of consideration:
Sellers may find interest in the upper range of the H4 zone 1.3360/1.3346 today, specifically off the 127.2% Fibonacci ext. point at 1.3357. A tight stop-loss order could be placed above daily resistance at 1.3382, with an initial downside target plotted at September’s opening level at 1.3314. Strict trade management is recommended as traders are urged to remain cognisant of the weekly timeframe’s position in terms of room to advance north.
USD/CHF:
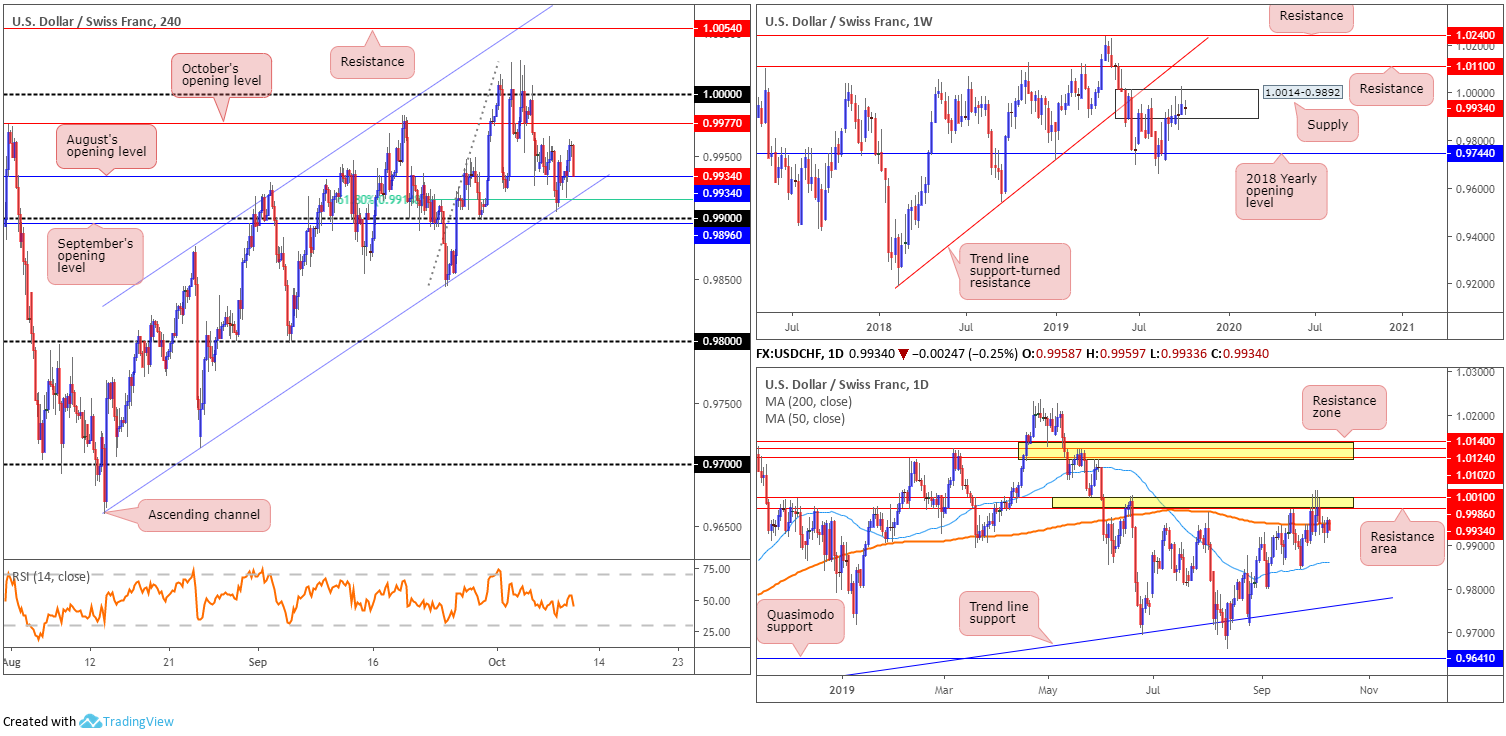
Recent hours witnessed increased demand for the safe-haven Swiss franc, guiding the USD/CHF from peaks of 0.9963 to August’s opening level at 0.9934 on the H4 timeframe. The catalyst behind the move stems from reports that US and China are making limited progress on key trade issues in two days of deputy-level talks, as well as reports the China trade team are now planning to leave Washington on Thursday, a day earlier than scheduled (SCMP).
Technically, market action remains unmoved this week on the weekly timeframe, confined within the walls of supply at 1.0014-0.9892. While last week’s move to multi-month peaks at 1.0027 possibly tripped some buy stops, interest from the sell side of the market clearly remains. In the event of a push higher, nonetheless, traders are urged to note resistance coming in at 1.0110, with a break of this barrier exposing trend line support-turned resistance (etched from the low 0.9187). If downside persists, the 2018 yearly opening level at 0.9744 is marked as the next support base.
Lower on the curve, daily price is engaging with its 200-day SMA (0.9951 – orange), after recently defending a resistance area (lower yellow) at 1.0010/0.9986. Nudging beneath the 200-day SMA may lead to the 50-day SMA entering the fold (blue – 0.9861).
With September’s opening level active on the H4 timeframe at 0.9934, a retest of the channel support (extended from the low 0.9659) may be in order, which converges with a 61.8% Fibonacci ratio at 0.9915. It might also be worth noting the round number located nearby at 0.99 that aligns closely with September’s opening level at 0.9896.
Areas of consideration:
Outlook unchanged.
Having noted weekly price establishing some ground within the parapets of supply, and daily price trading beneath its 200-day SMA, as of current price, sellers appear to have the upper hand at the moment.
Should a break beneath 0.99 take hold, therefore, a short could be something to consider. The move lower perhaps clears the pathway to the 0.9843 September 24 low and 0.98 handle. Remember, though, we also have the 50-day SMA at 0.9859 to contend with.
Dow Jones Industrial Average:
US equities rose Wednesday amid hopes of a trade deal from US/China trade talks beginning today. The Dow Jones Industrial Average added 181.97 points, or 1.19%; the S&P 500 also added 26.34 points, or 0.91%, and the tech-heavy Nasdaq 100 gained 86.26 points, or 1.13%.
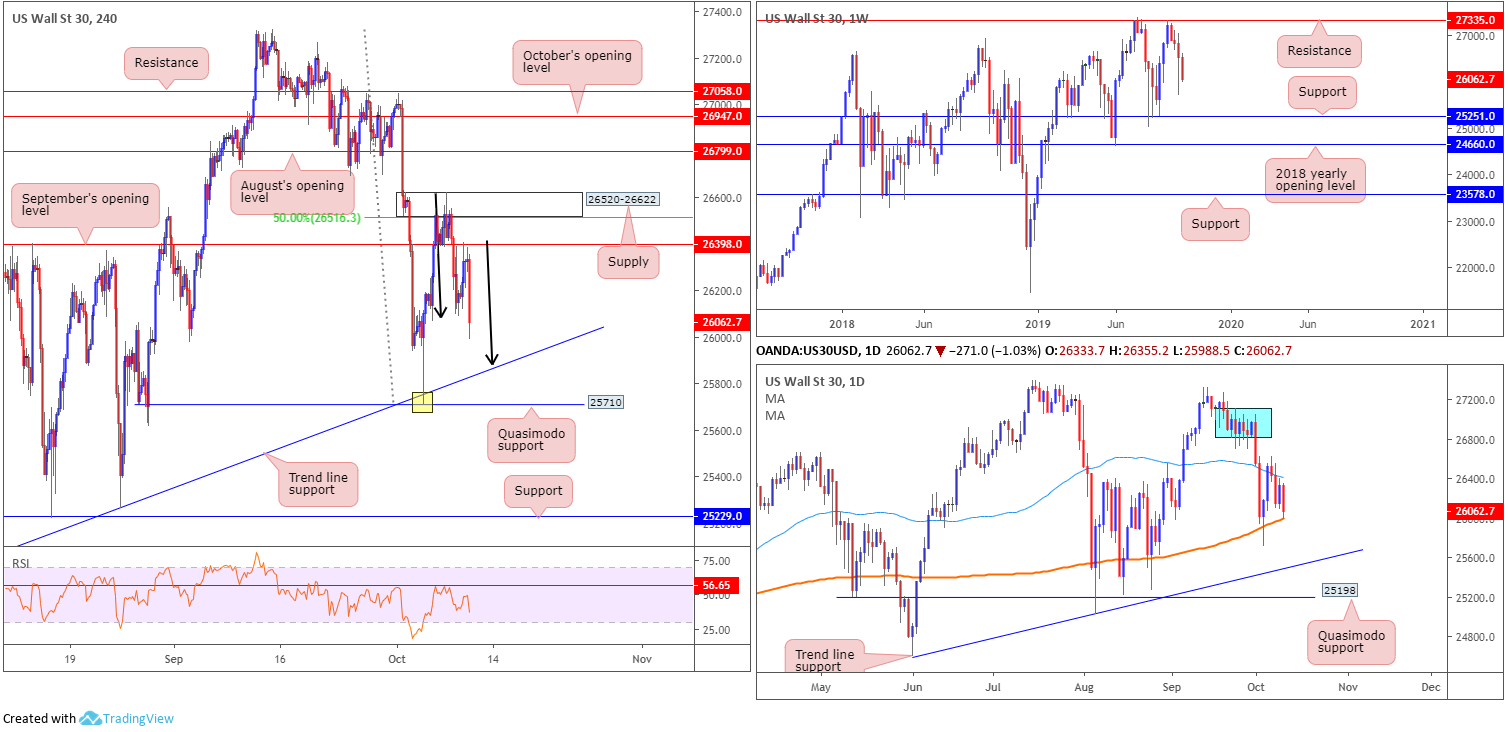
Recent hours, however, saw equities tumble south on the back of reports that US and China are making limited progress on key trade issues in two days of deputy-level talks, as well as reports the China trade team are now planning to leave Washington on Thursday, a day earlier than scheduled (SCMP). This sent the Dow lower from September’s opening level at 26398, poised to potentially approach trend line support etched from the low 25466 in the shape of an AB=CD correction (black arrows).
Longer-term analysis, as underscored in Wednesday’s briefing, has weekly price steamrolling southbound, ahead of support coming in at 25251, closely followed by the 2018 yearly opening level at 24660. Elsewhere, daily candles are seen compressing between the 200-day SMA (orange – 25978) and the 50-day SMA (blue – 26420), though due to recent downside, the 200-day SMA is now in motion. Overhead, supply is evident between 27110-26813 (blue – positioned just south of weekly resistance at 27335), while to the downside we have trend line support etched from the low 24604 in sight.
Areas of consideration:
For traders who read Wednesday’s report you may recall the following piece:
All three timeframes display scope to extend losses today; the closest support target resides in the shape of a trend line support on the H4 timeframe, and the 200-day SMA. Shorting at current price positions traders at an adverse risk/reward given stop-loss placement would, technically speaking, need to be beyond September’s opening level at 26398. An alternative is to simply wait and see if H4 price pulls back and retests 26398. Selling from here allows traders the option of locating protective stop-loss orders above H4 supply at 26520-26622, giving the trade room to breathe and also allowing for a reasonably attractive risk/reward scenario.
Well done to any readers who managed to take advantage of recent selling.
Going forward, traders may be watching the said H4 trend line support for a bounce today, knowing it aligns with an AB=CD correction. This may even be enough to force a revisit of 26398 and the 50-day SMA. Possible Stop-loss placement for longs can be found beyond H4 Quasimodo support at 25710.
XAU/USD (GOLD):
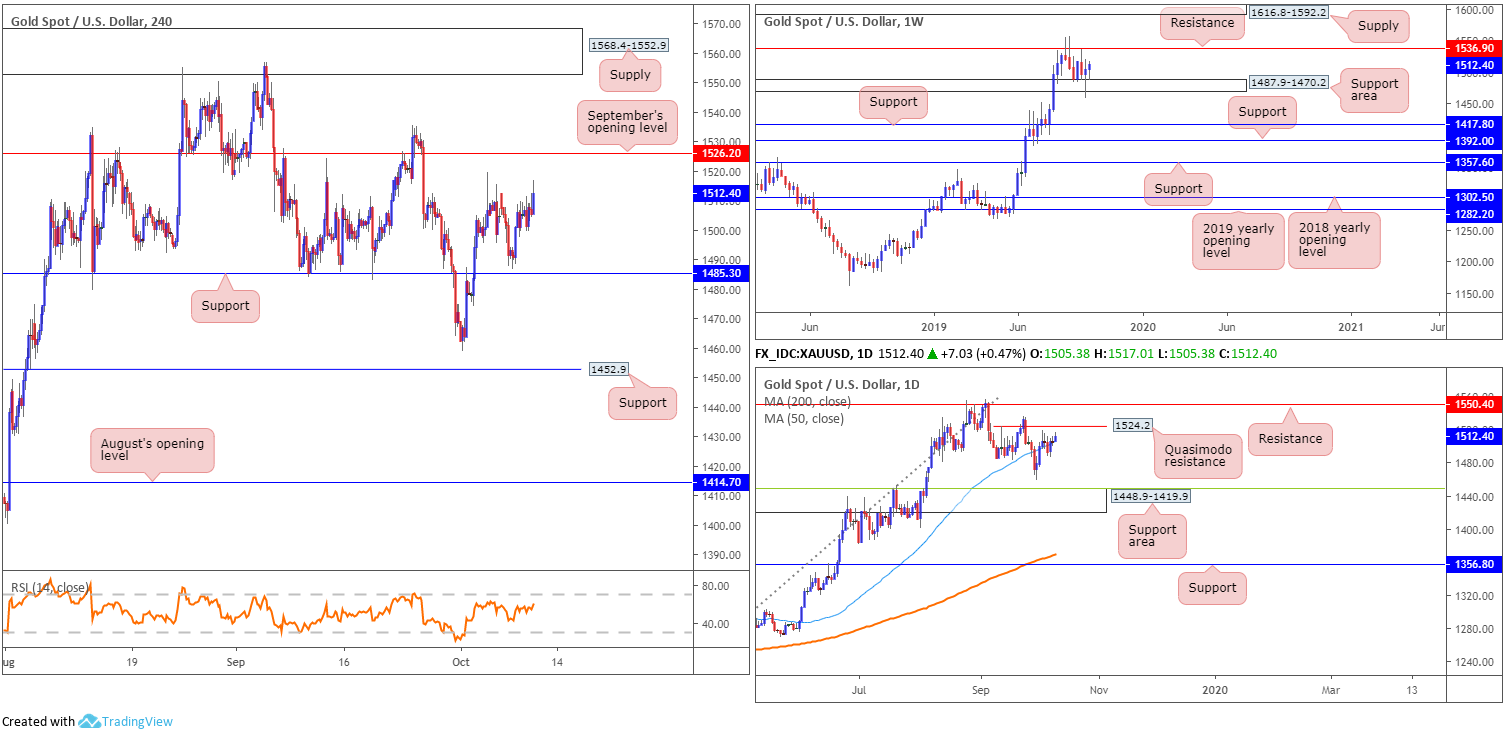
Broad risk aversion gripped markets in early Asia today, consequently ramping up demand for safe-haven assets. Bullion, in $ terms, is seen shaking hands with highs of 1517.0, with last Thursday’s high at 1519.7 to target, followed closely by September’s opening level at 1526.2 on the H4 timeframe. Beyond this point, limited structure is seen until reaching supply coming in at 1568.4-1552.9.
Elsewhere, weekly price is seen defending 1487.9-1470.2, despite having its lower edge taken last week. Resistance on this scale is close by at 1536.9. Supply at 1616.8-1592.2 is the next area of interest to the upside beyond here, whereas below the current support area, two layers of support reside at 1392.0 and 1417.8.
Coinciding close by with September’s opening level at 1526.2, we also have a local daily Quasimodo resistance at 1524.2 and another layer of resistance sited just north of it at 1550.4.
Areas of consideration:
The primary trend, clearly visible on the weekly timeframe, appears in good shape, with room to advance as far north as 1536.9. However, unless a pullback to H4 support materialises, entering long so close to H4 and daily resistance is chancy. Even with a break of 1526.2 forming, weekly sellers are likely to get involved off resistance at 1536.9, leaving little to no room to manoeuvre.
Therefore, a pullback to 1485.3 is still eyed, preferably taking shape before price reaches the said resistances. For conservative buyers, waiting for additional candlestick confirmation to form might be an option worth exploring before executing a trade. This helps recognise commitment from the buy side of this market and will, if traders understand the candlestick’s entry and exit points, provide levels to trade from.
The accuracy, completeness and timeliness of the information contained on this site cannot be guaranteed. IC Markets does not warranty, guarantee or make any representations, or assume any liability regarding financial results based on the use of the information in the site.
News, views, opinions, recommendations and other information obtained from sources outside of www.icmarkets.com.au, used in this site are believed to be reliable, but we cannot guarantee their accuracy or completeness. All such information is subject to change at any time without notice. IC Markets assumes no responsibility for the content of any linked site.
The fact that such links may exist does not indicate approval or endorsement of any material contained on any linked site. IC Markets is not liable for any harm caused by the transmission, through accessing the services or information on this site, of a computer virus, or other computer code or programming device that might be used to access, delete, damage, disable, disrupt or otherwise impede in any manner, the operation of the site or of any user’s software, hardware, data or property.


