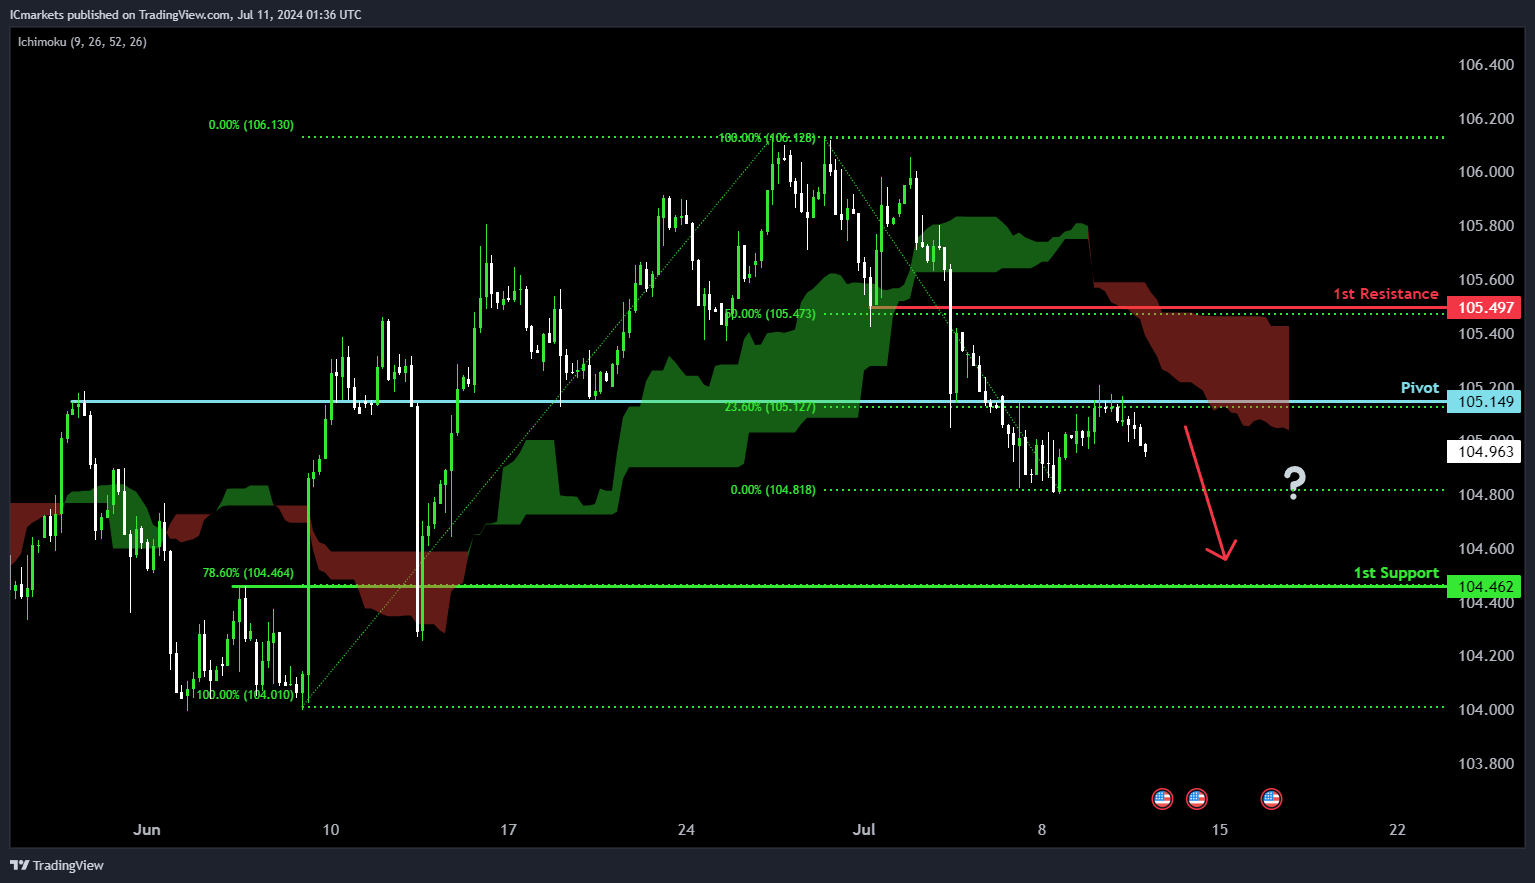
DXY (US Dollar Index):
Potential Direction: Bearish
Overall momentum of the chart: Bearish
Factors contributing to the momentum: Price is below the bearish Ichimoku cloud
Price could potentially make a bearish continuation towards 1st support
Pivot: 105.15
Supporting reasons: Identified as an overlap resistance level, specifically at the 23.60% Fibonacci Retracement, indicating a potential area where sellers could enter the market after a retracement.
1st support: 104.46
Supporting reasons: Identified as a pullback support level, specifically at the 78.60% Fibonacci Retracement, suggesting a significant area where previous declines have found support.
1st resistance: 105.49
Supporting reasons: Identified as a pullback resistance level, specifically at the 50% Fibonacci Retracement, indicating a historical point where previous rallies have faced selling pressure or reversed.
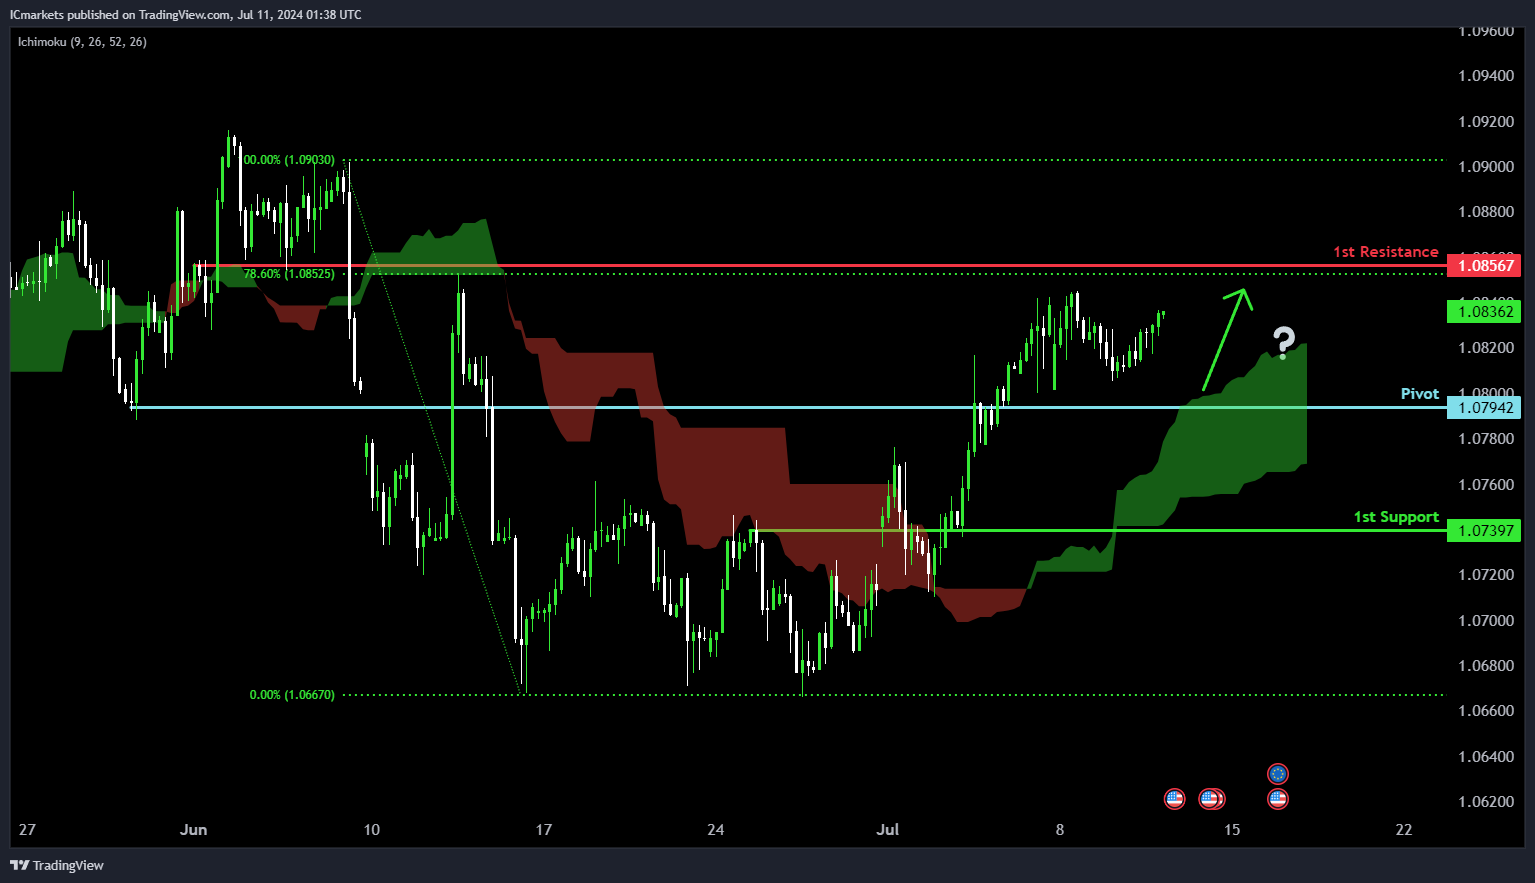
EUR/USD:
Potential Direction: Bullish
Overall momentum of the chart: Bullish
Factors contributing to the momentum: Price is above the bullish Ichimoku cloud
Price could potentially make a bullish bounce off pivot and head towards 1st resistance.
Pivot: 1.0794
Supporting reasons: Identified as an overlap support level, indicating a significant area where previous declines have found support.
1st support: 1.0723
Supporting reasons: Identified as an overlap support level, suggesting a significant area where previous declines have found support.
1st resistance: 1.0862
Supporting reasons: Identified as a pullback resistance level, indicating a historical point where previous rallies have faced selling pressure or reversed.
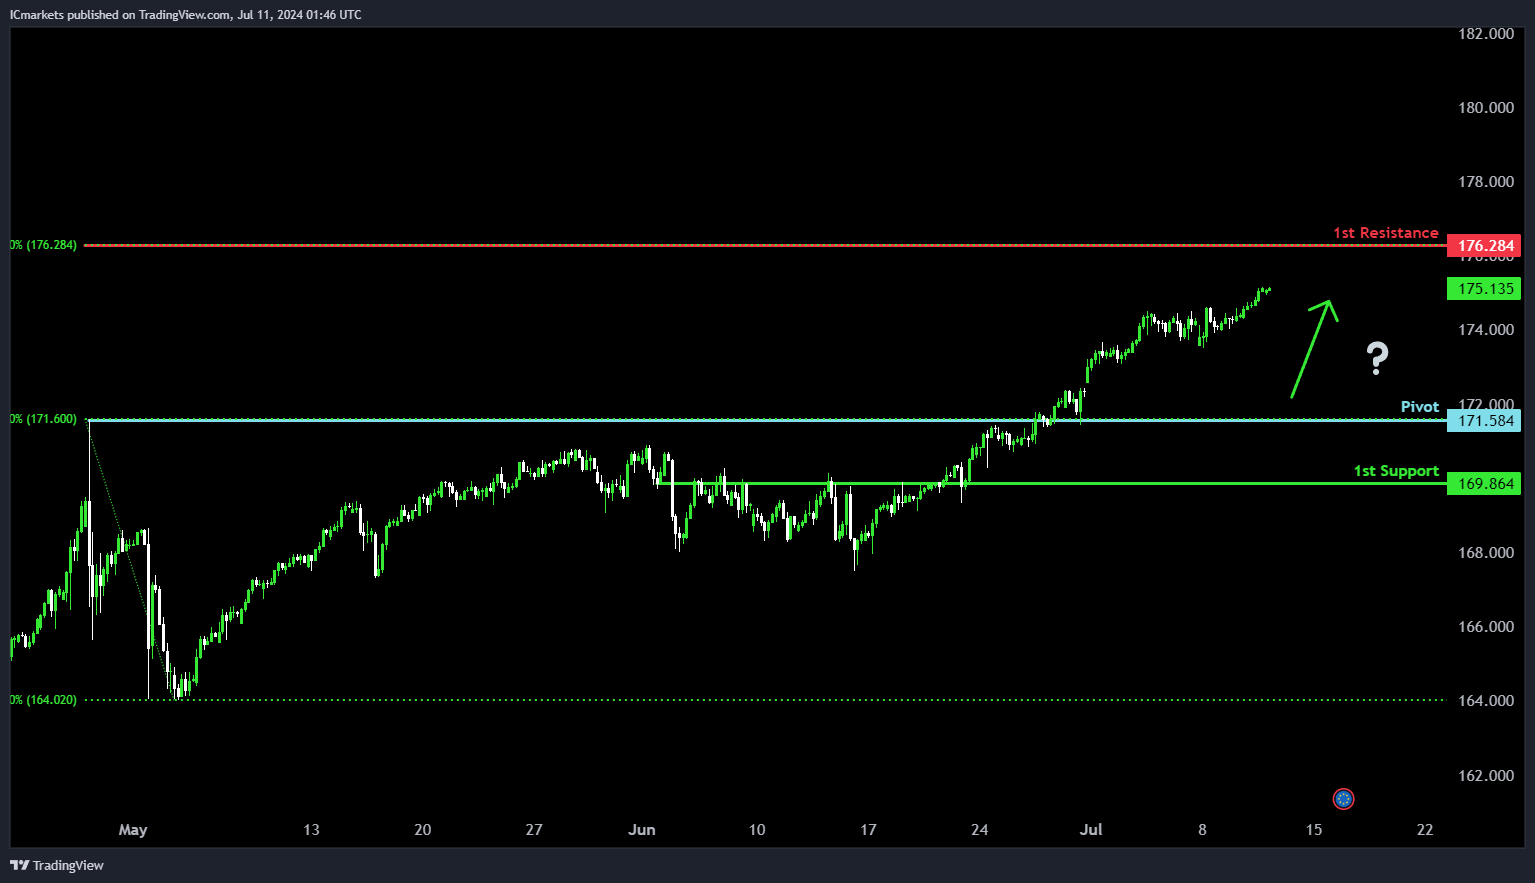
EUR/JPY:
Potential Direction: Bullish
Overall momentum of the chart: Bullish
Price could potentially make a bullish bounce off pivot and head towards 1st resistance.
Pivot: 171.58
Supporting reasons: Identified as an overlap support level, indicating a significant area where previous declines have found support.
1st support: 169.86
Supporting reasons: Identified as an overlap support level, suggesting a potential area where buyers could enter the market after a retracement.
1st resistance: 176.28
Supporting reasons: Identified as a resistance level, specifically at the 161.80% Fibonacci Extension, indicating a historical point where previous rallies have faced selling pressure or reversed.
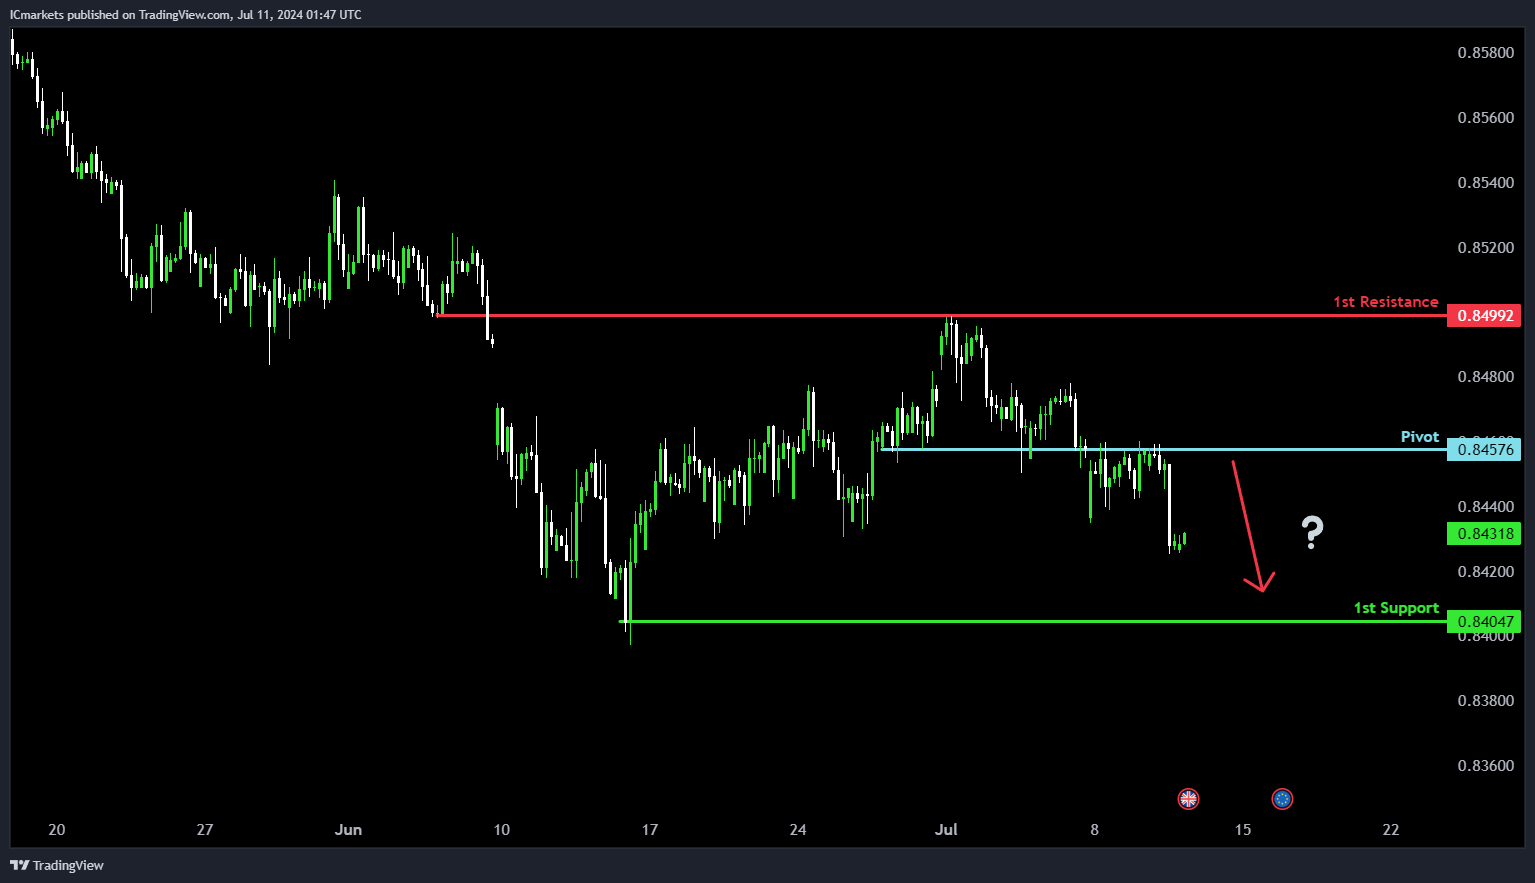
EUR/GBP:
Potential Direction: Bearish
Overall momentum of the chart: Bearish
Price could potentially make a bearish continuation towards 1st support
Pivot: 0.8457
Supporting reasons: Identified as an overlap resistance level, indicating a potential area where sellers could enter the market after a retracement.
1st support: 0.8404
Supporting reasons: Identified as a swing low support level, suggesting a significant area where previous declines have found support.
1st resistance: 0.8499
Supporting reasons: Identified as an overlap resistance level, indicating a historical point where previous rallies have faced selling pressure or reversed.
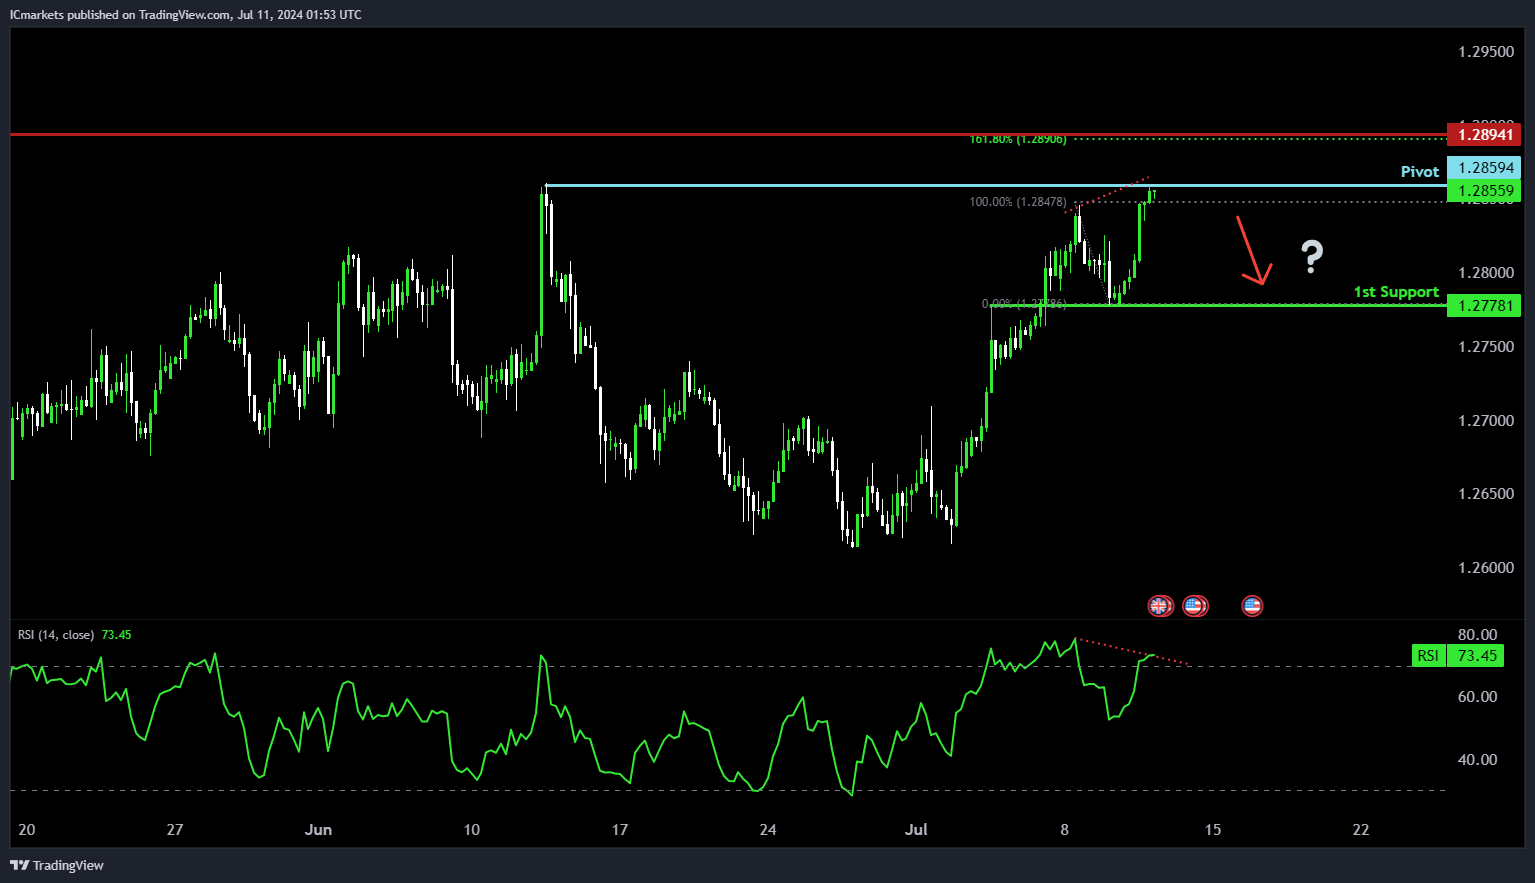
GBP/USD:
Potential Direction: Bearish
Overall momentum of the chart: Bullish
Price could potentially make a bearish reaction off pivot and drop to 1st support.
Pivot: 1.2859
Supporting reasons: Identified as a swing high resistance level, indicating a potential area where sellers could enter the market after a retracement.
1st support: 1.2778
Supporting reasons: Identified as an overlap support level, suggesting a significant area where previous declines have found support.
1st resistance: 1.2894
Supporting reasons: Identified as a swing high resistance level, specifically at the 161.80% Fibonacci Extension, indicating a historical point where previous rallies have faced selling pressure or reversed.
RSI: Also displaying bearish divergence versus price, suggesting that a reversal might occur soon.
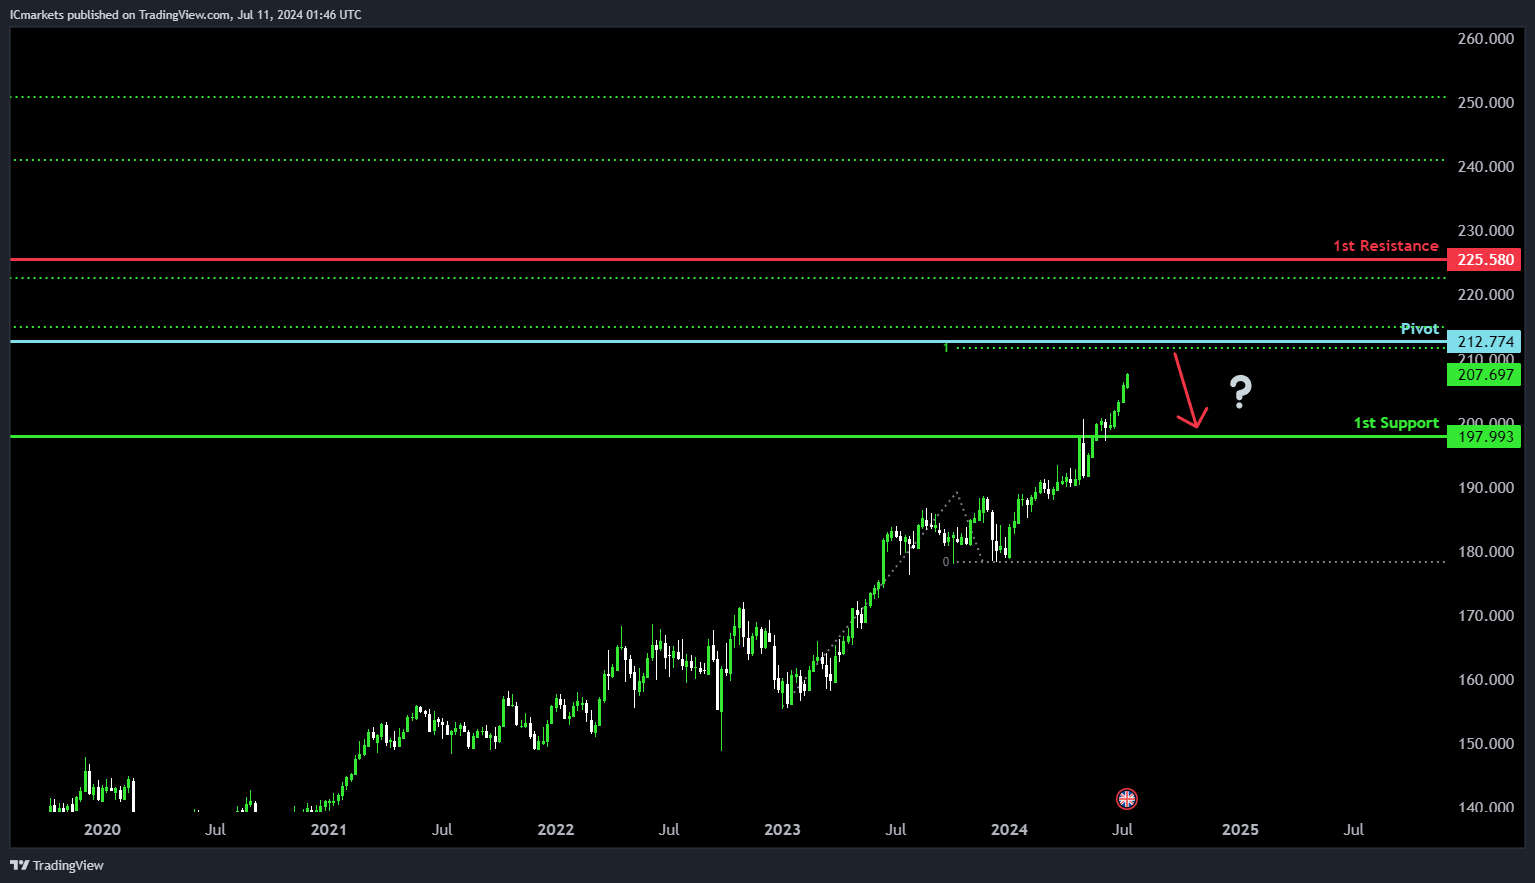
GBP/JPY:
Potential Direction: Bearish
Overall momentum of the chart: Bullish
Price could potentially make a bearish reaction off pivot and drop to 1st support.
Pivot: 212.77
Supporting reasons: Identified as an overlap resistance level, specifically at the 100% Fibonacci Projection, indicating a potential area where sellers could enter the market after a retracement.
1st support: 197.99
Supporting reasons: Identified as an overlap support level, suggesting a significant area where previous declines have found support.
1st resistance: 225.58
Supporting reasons: Identified as an overlap resistance level, indicating a historical point where previous rallies have faced selling pressure or reversed.
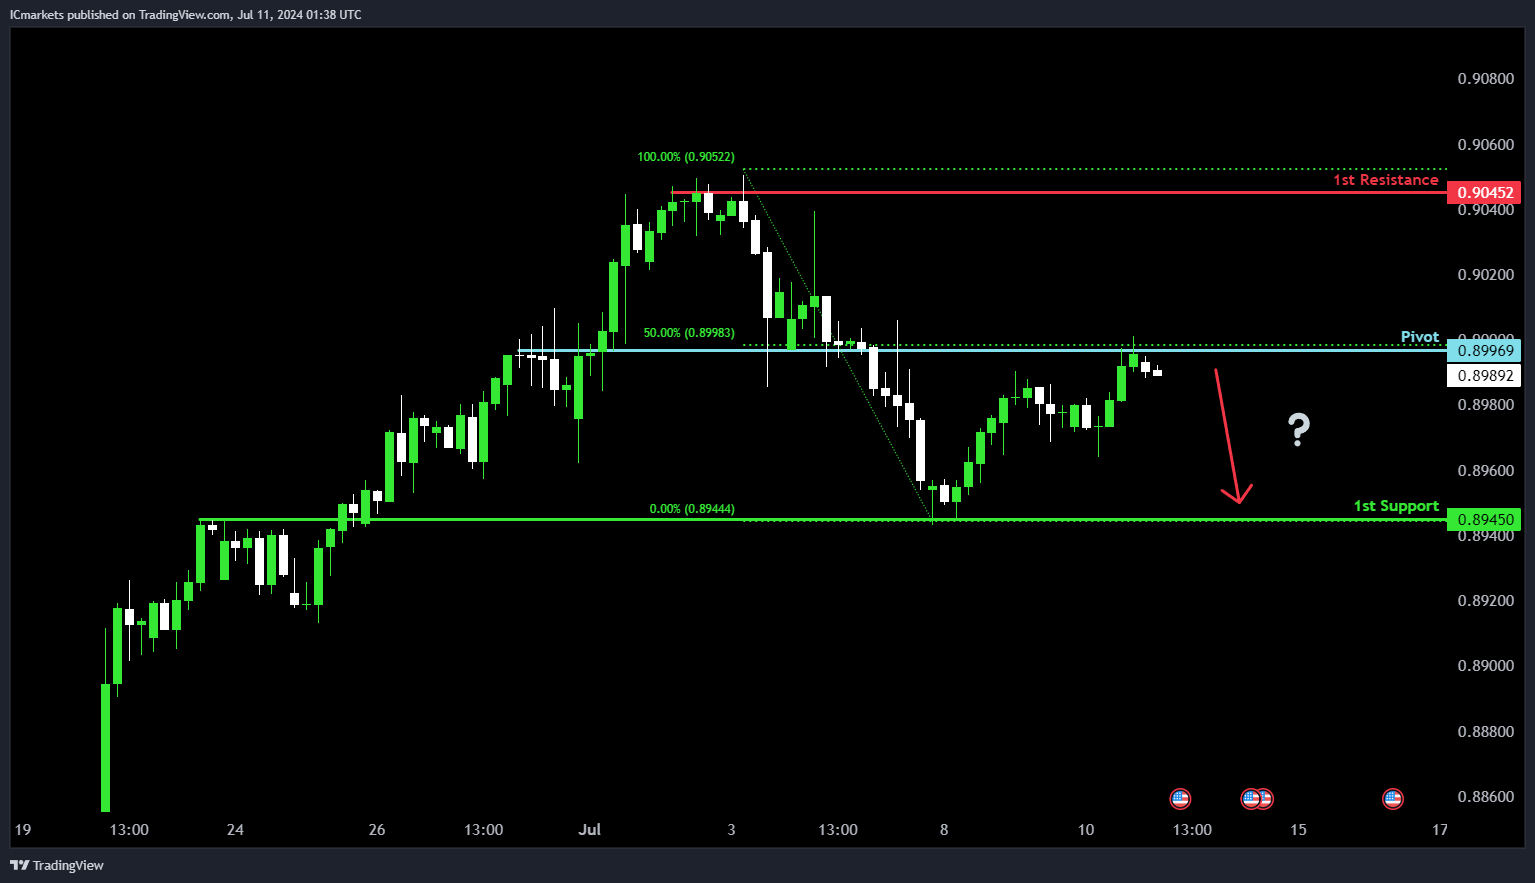
USD/CHF:
Potential Direction: Bearish
Overall momentum of the chart: Bearish
Price could potentially make a bearish reaction off pivot and drop to 1st support.
Pivot: 0.8996
Supporting reasons: Identified as an overlap resistance level, specifically at the 50% Fibonacci Retracement, indicating a potential area where sellers could enter the market after a retracement.
1st support: 0.8945
Supporting reasons: Identified as an overlap support level, suggesting a significant area where previous declines have found support.
1st resistance: 0.9045
Supporting reasons: Identified as a multi-swing high resistance level, indicating a historical point where previous rallies have faced selling pressure or reversed.
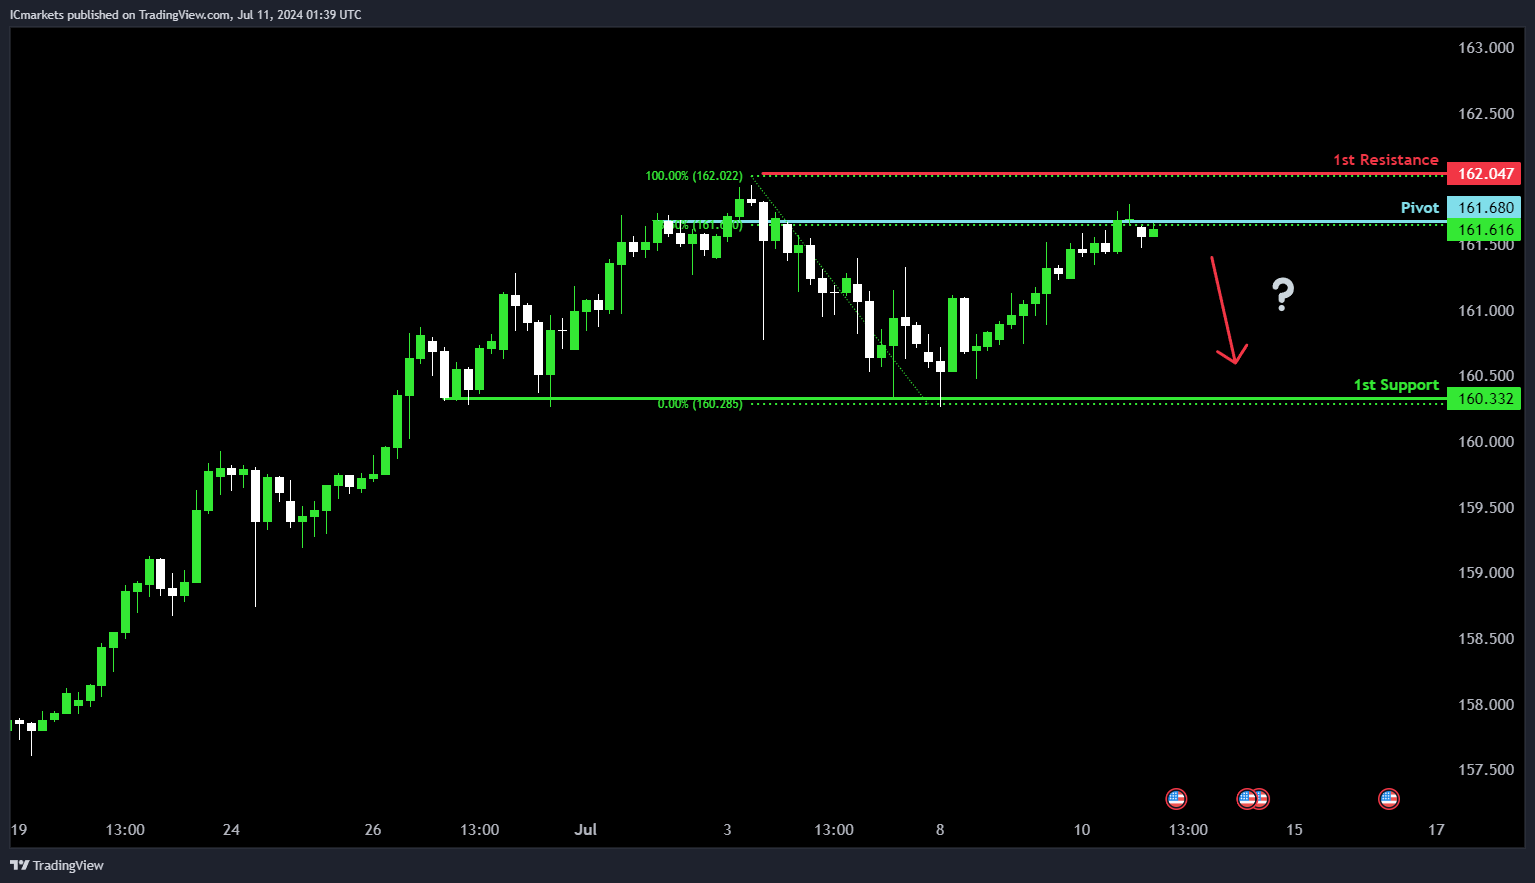
USD/JPY:
Potential Direction: Bearish
Overall momentum of the chart: Bullish
Price could potentially make a bearish reaction off pivot and drop to 1st support.
Pivot: 161.68
Supporting reasons: Identified as a pullback resistance level, specifically at the 78.60% Fibonacci Retracement, indicating a potential area where sellers could enter the market after a retracement.
1st support: 160.33
Supporting reasons: Identified as a multi-swing low support level, suggesting a significant area where previous declines have found support.
1st resistance: 162.04
Supporting reasons: Identified as a swing high resistance level, indicating a historical point where previous rallies have faced selling pressure or reversed.
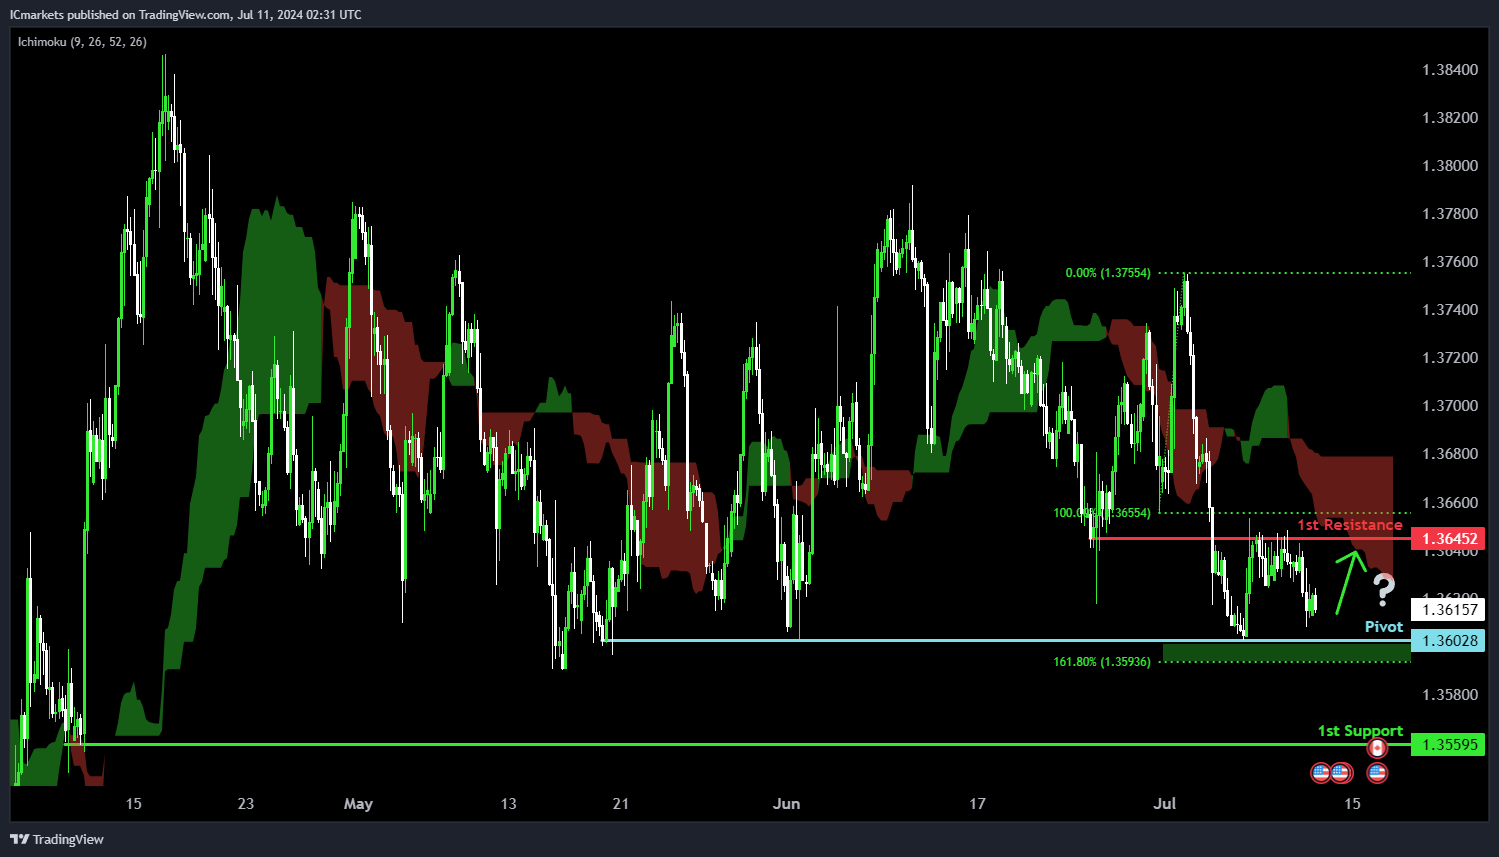
USD/CAD:
Potential Direction: Bullish
Overall momentum of the chart: Bearish
Price is falling towards the pivot and could potentially make a bullish bounce off this level to rise towards the 1st resistance.
Pivot:1.3602
Supporting reasons: Identified as a multi-swing-low support that aligns close to a 161.8% Fibonacci extension level, suggesting a potential area where price could stage a minor rebound.
1st support: 1.3559
Supporting reasons: Identified as a pullback support, suggesting a potential area that could halt further downward movement.
1st resistance: 1.3645
Supporting reasons: Identified as an overlap resistance, indicating a potential area where selling pressures could intensify to resume the downtrend. The presence of the bearish Ichimoku cloud adds further significance to the bearish momentum.
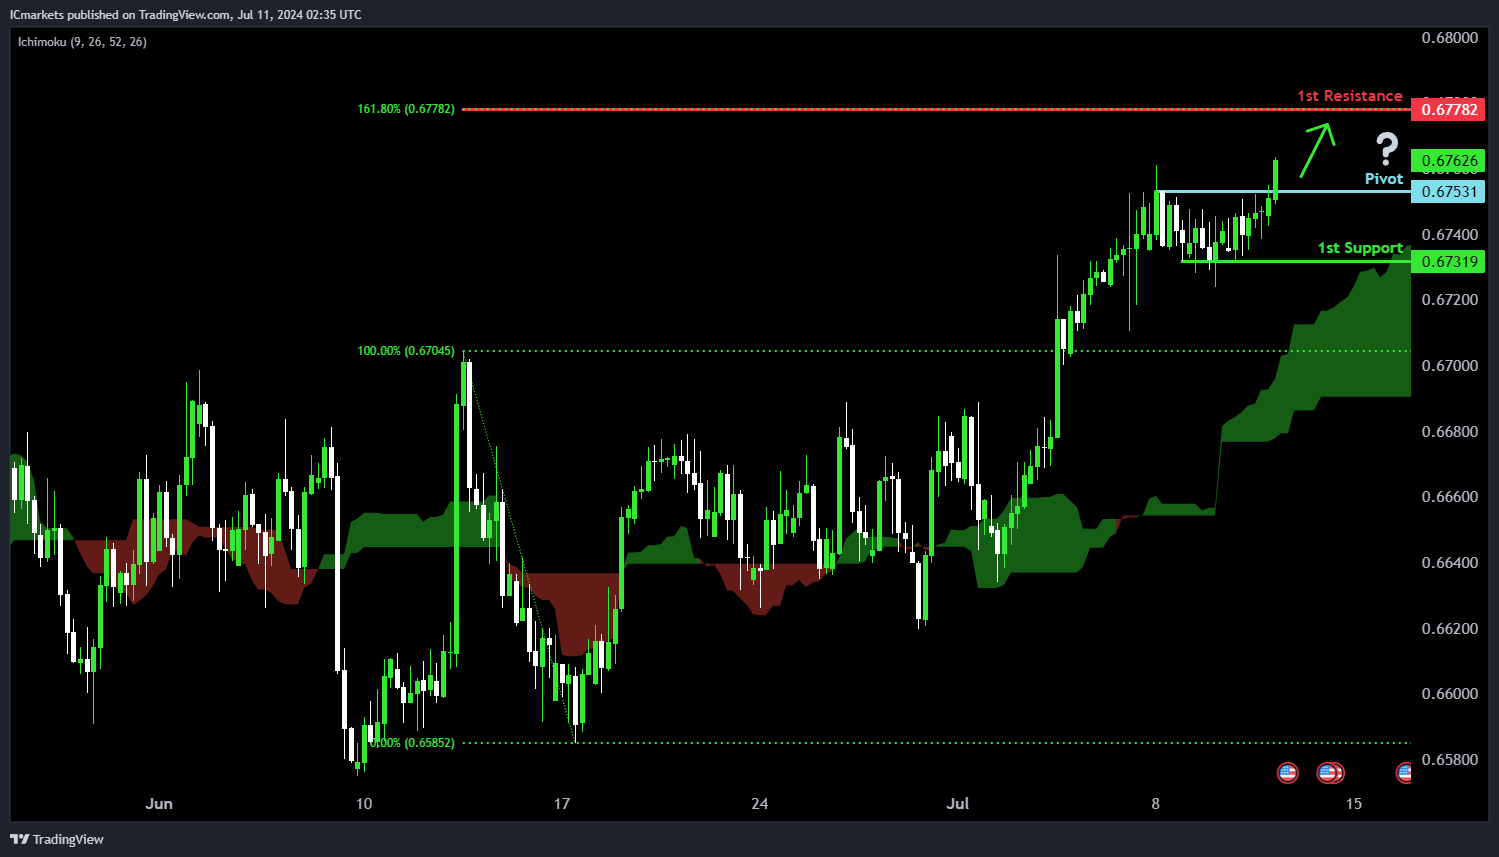
AUD/USD:
Potential Direction: Bullish
Overall momentum of the chart: Bullish
Price has made a bullish break above the pivot and could potentially rise towards the 1st resistance.
Pivot: 0.6753
Supporting reasons: Identified as a potential breakout level where the bullish momentum could carry price higher. The presence of the bullish Ichimoku cloud adds further significance to the bullish momentum.
1st support: 0.6731
Supporting reasons: Identified as a pullback support, suggesting a potential area where price could find strong support.
1st resistance: 0.6778
Supporting reasons: Identified as a resistance that aligns with a 161.8% Fibonacci extension level, indicating a significant area that could halt further upward movement.
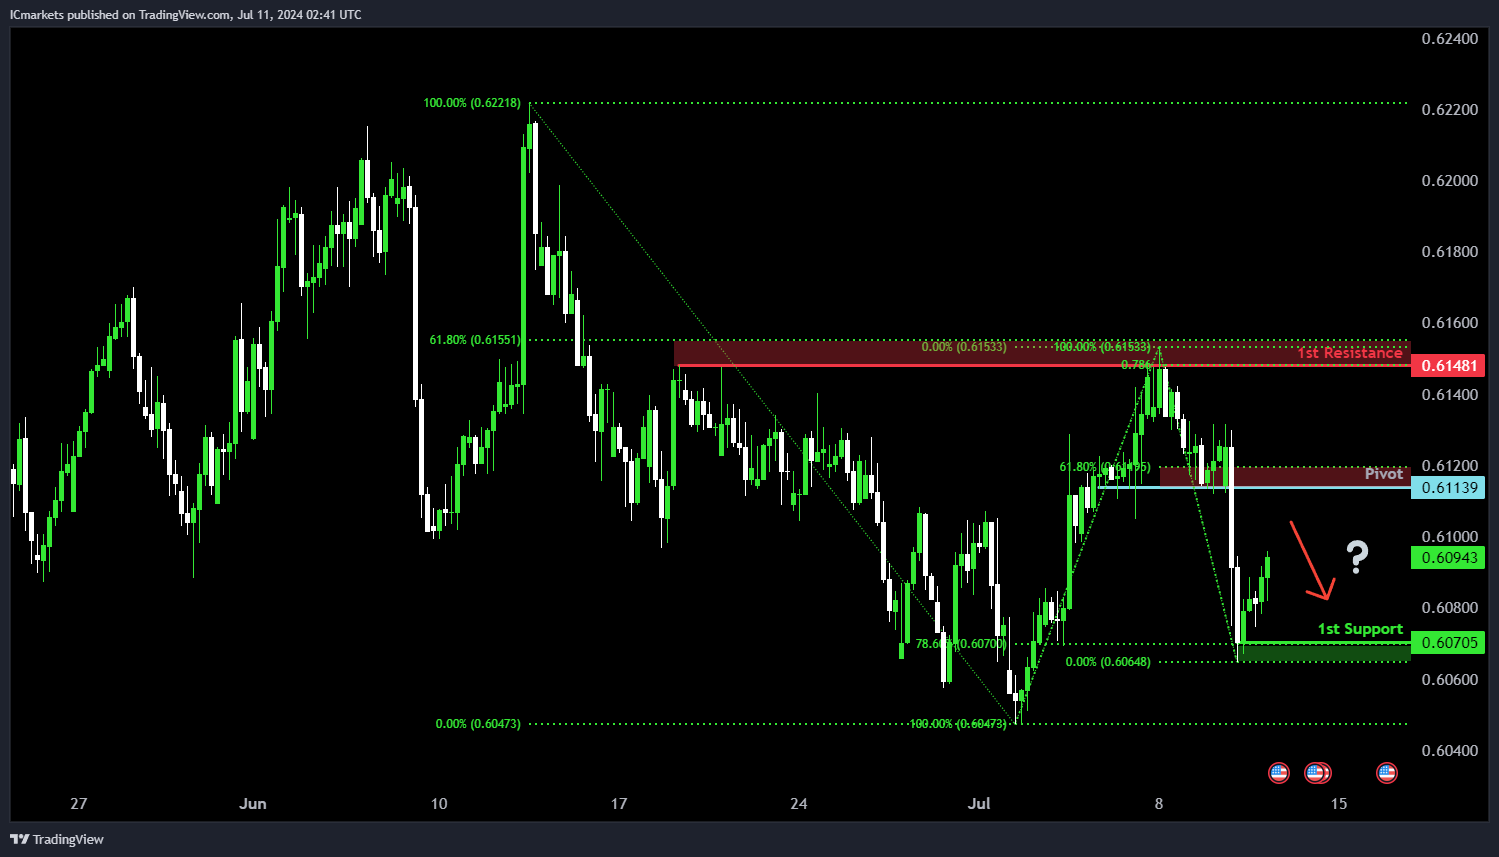
NZD/USD
Potential Direction: Bearish
Overall momentum of the chart: Neutral
Price is rising towards the pivot and could potentially make a bearish reversal off this level to drop lower towards the 1st support.
Pivot: 0.6113
Supporting reasons: Identified as a pullback resistance that aligns close to the 61.8% Fibonacci retracement level, indicating a potential area where selling pressures could intensify.
1st support: 0.6070
Supporting reasons: Identified as a pullback support that aligns with a 78.6% Fibonacci retracement level, suggesting a significant area that could halt further downward momentum.
1st resistance: 0.6148
Supporting reasons: Identified as a pullback resistance that aligns with a confluence of Fibonacci levels i.e. the 61.8% retracement and the 78.6% projection levels, indicating a significant area that could halt further upward movement.
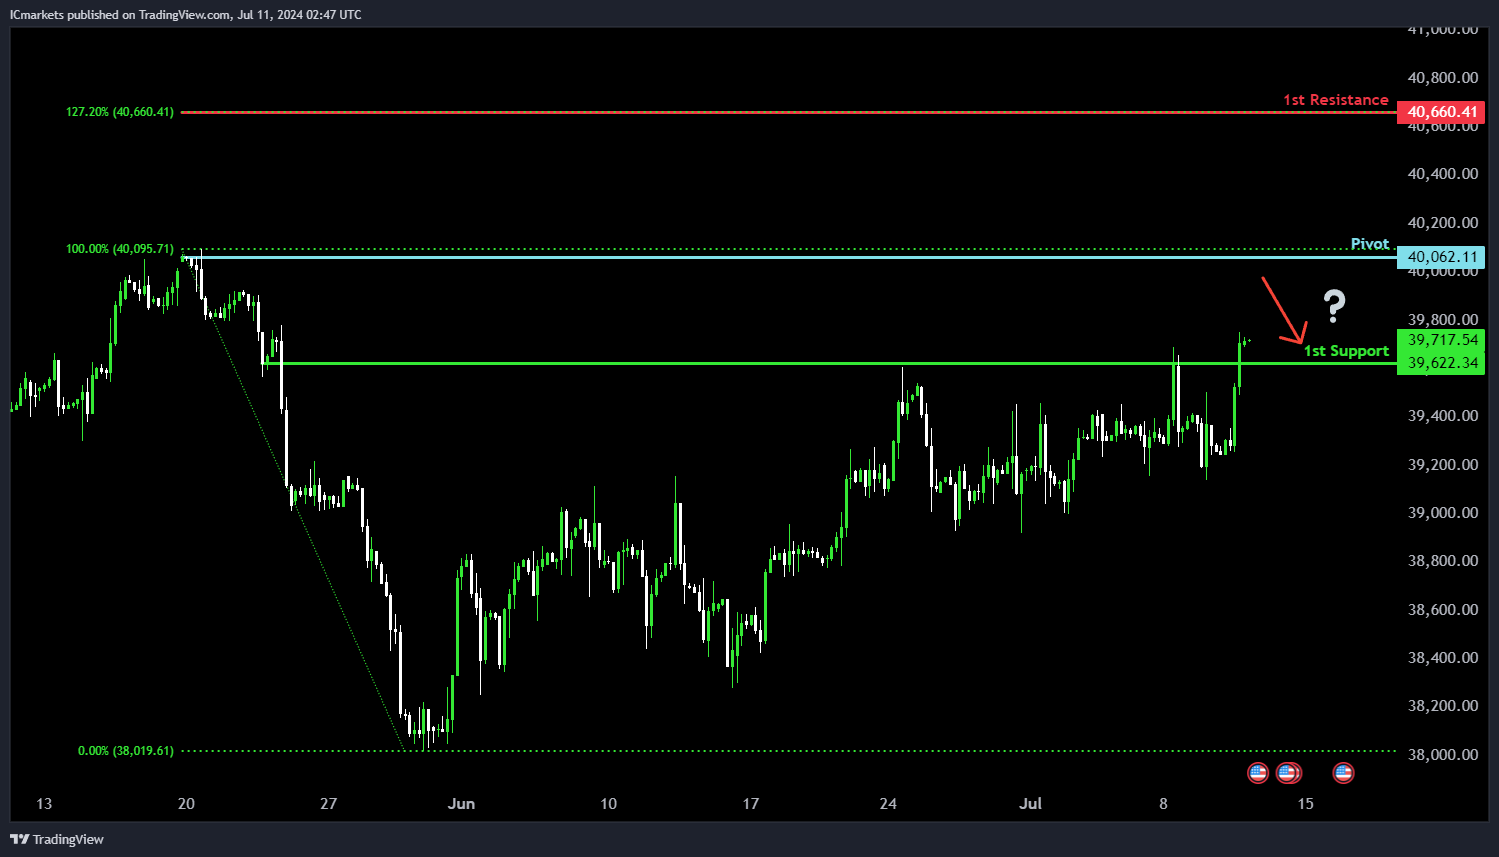
US30 (DJIA):
Potential Direction: Bullish
Overall Momentum of the Chart: Bullish
Price is rising towards the pivot and could potentially make a bearish reversal off this level to pull back towards the 1st support.
Pivot: 40,062.11
Supporting reasons: Identified as a swing-high resistance that aligns close to the all-time high, indicating a potential area where selling pressures could intensify.
1st Support: 39,622.34
Supporting Reasons: Identified as an overlap support, suggesting a significant area where price could find strong support.
1st Resistance: 40,660.41
Supporting Reasons: Identified as a resistance that aligns with a 127.2% Fibonacci extension level, indicating a significant area that could halt further upward movement.
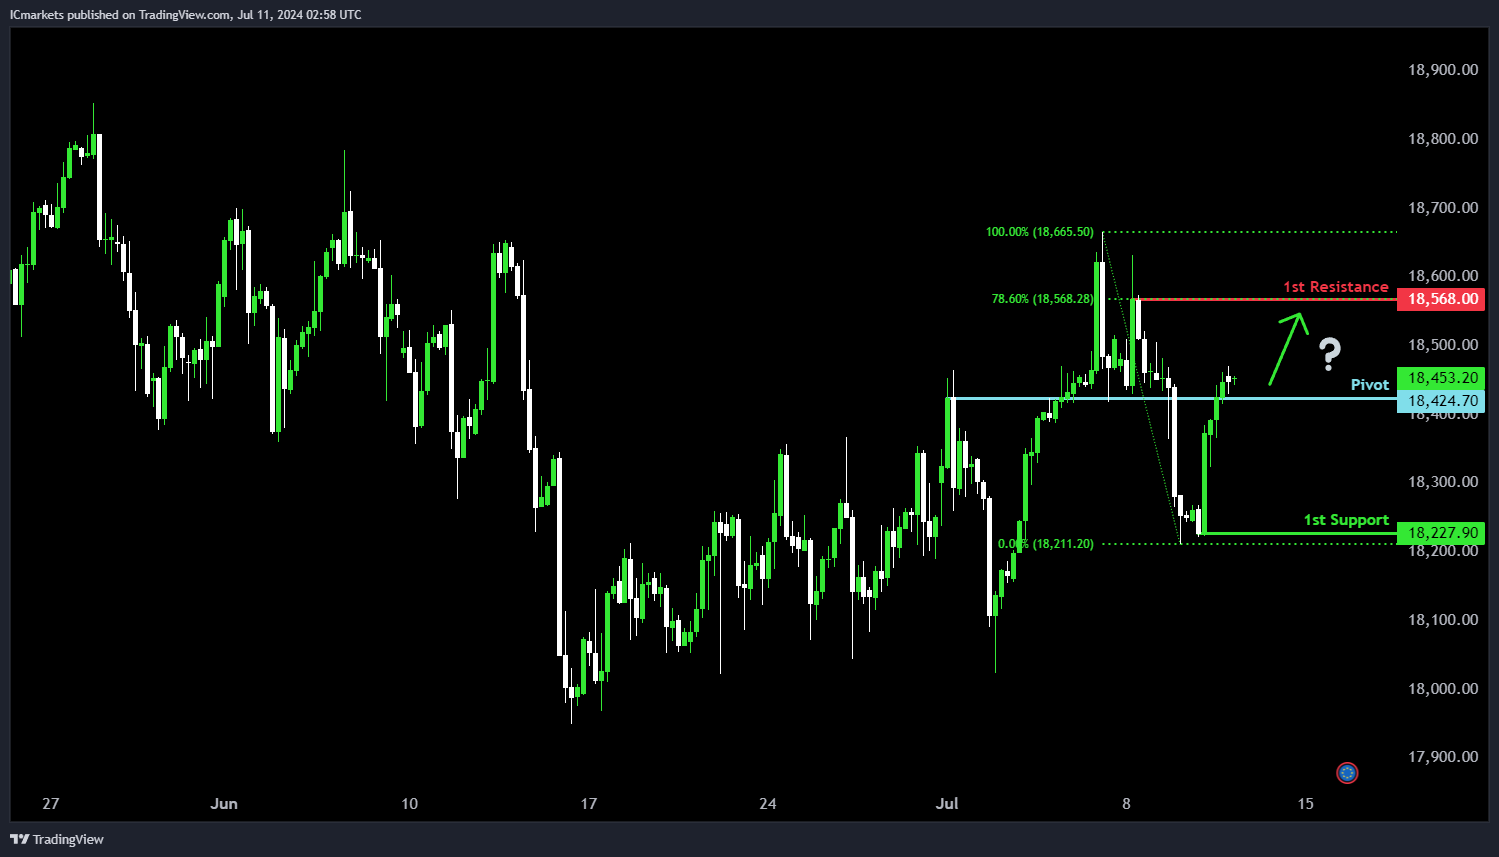
DE40 (DAX):
Potential Direction: Bullish
Overall Momentum of the Chart: Neutral
Price could fall towards the pivot and potentially make a bullish bounce off this level to rise towards the 1st resistance.
Pivot: 18,424.70
Supporting reasons: Identified as an overlap support, indicating a potential area where buying interests could pick up to stage a rebound.
1st Support: 18,227.90
Supporting Reasons: Identified as a swing-low support, indicating a significant area where price could find strong support.
1st Resistance: 18,568.00
Supporting Reasons: Identified as a pullback resistance that aligns with a 78.6% Fibonacci retracement level, indicating a significant area that could halt further upward movement.
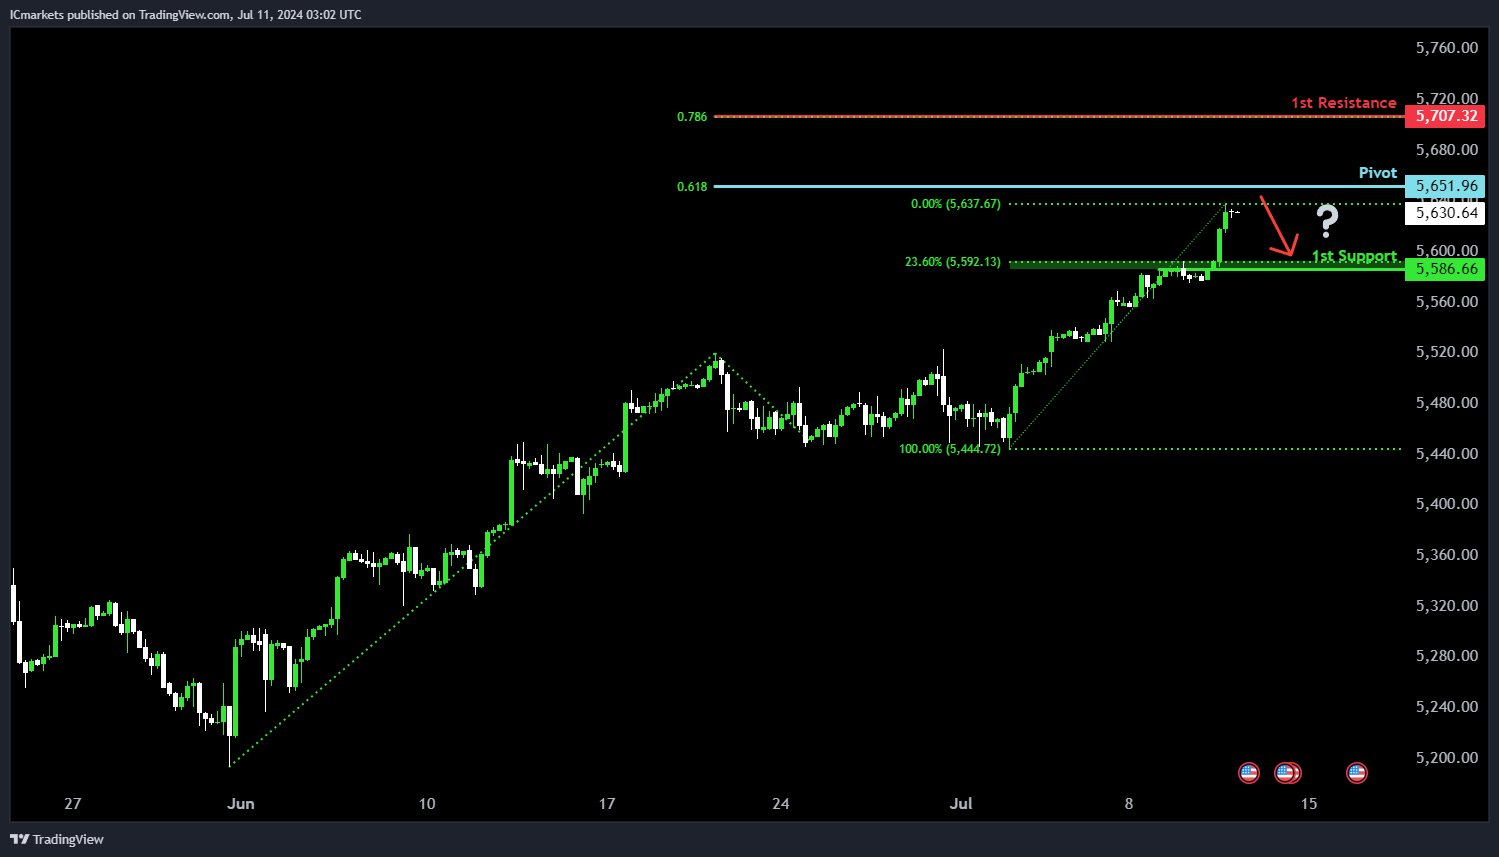
US500 (S&P 500):
Potential Direction: Bearish
Overall momentum of the chart: Bullish
Price is trading close to the pivot and could potentially make a bearish reversal off this level to pull back towards the 1st support.
Pivot: 5,651.96
Supporting reasons: Identified as a resistance that aligns with a 61.8% Fibonacci projection level, indicating a potential area where selling pressures could intensify.
1st support: 5,586.66
Supporting reasons: Identified as a pullback support that aligns close to a 23.6% Fibonacci retracement level, indicating a potential area where price could find strong support.
1st resistance: 5,707.32
Supporting reasons: Identified as a resistance that aligns with a 78.6% Fibonacci projection level, suggesting a critical area where selling pressures may intensify and potentially halt further upward movement.
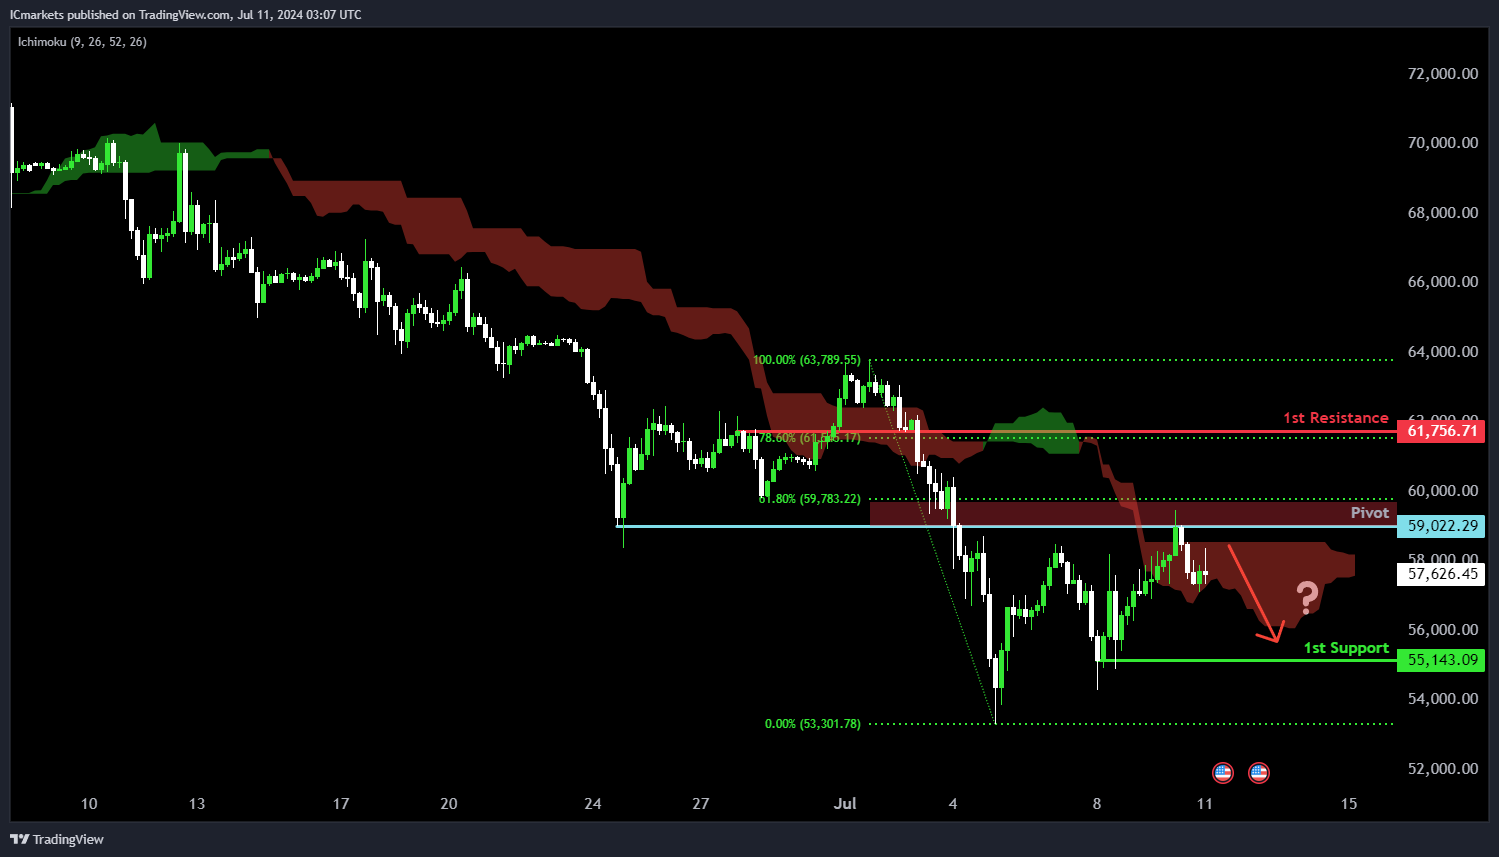
BTC/USD (Bitcoin):
Potential Direction: Bearish
Overall momentum of the chart: Bearish
Price has made a bearish reversal off the pivot and could potentially drop towards the 1st support.
Pivot: 59,022.29
Supporting reasons: Identified as an overlap resistance that aligns close to a 61.8% Fibonacci retracement level, indicating a potential area where selling pressures could intensify to resume the downtrend. The presence of the bearish Ichimoku cloud adds further significance to the bearish momentum.
1st support: 55,143.09
Supporting reasons: Identified as a pullback support, indicating a significant area that could halt further downward movement.
1st resistance: 61,756.71
Supporting reasons: Identified as an overlap resistance that aligns close to a 78.6% Fibonacci retracement level, indicating a potential barrier that could halt further upward movement.
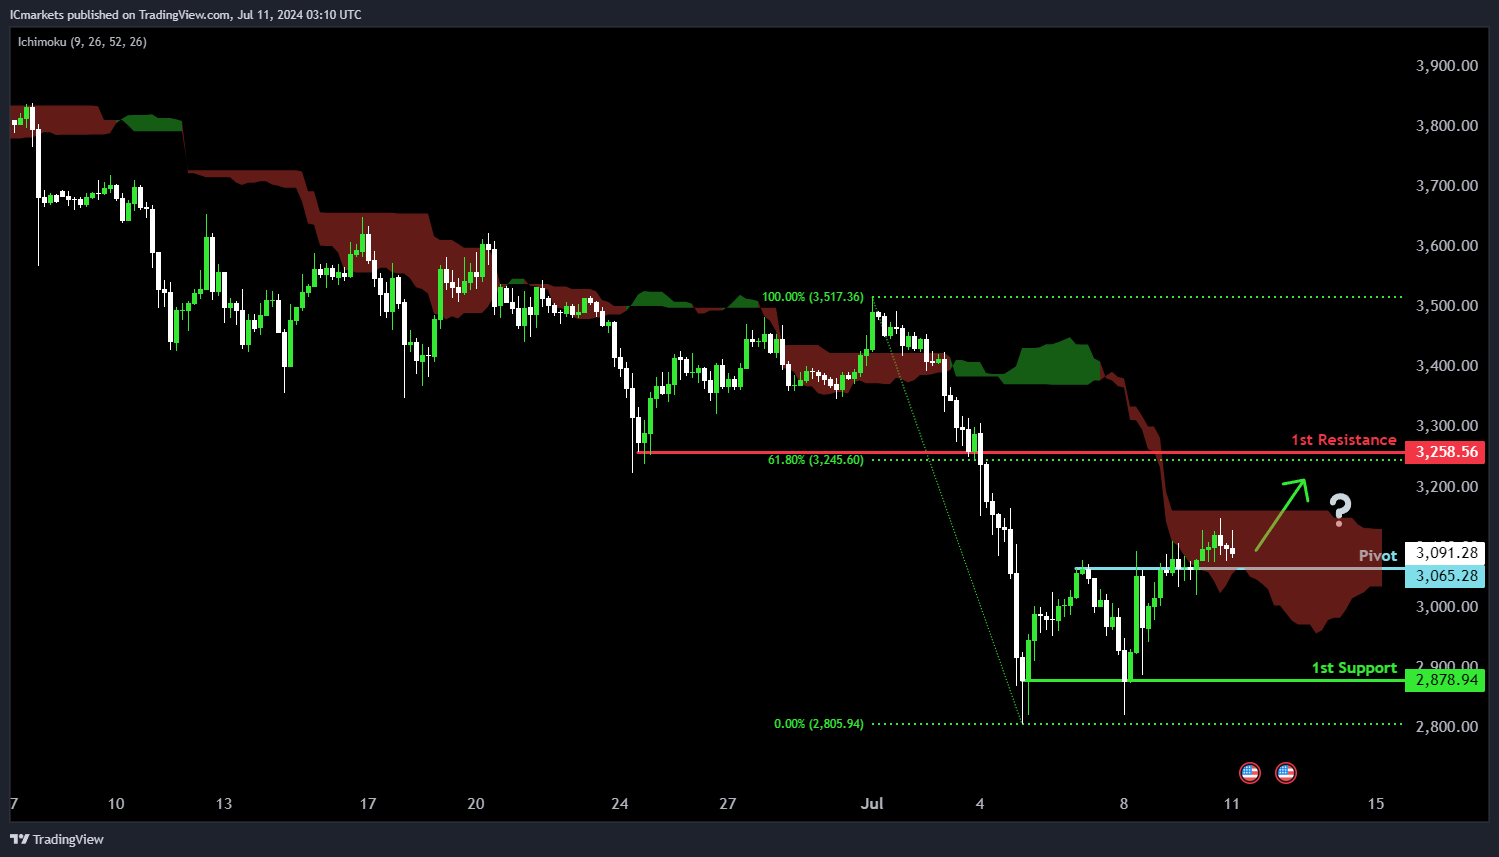
ETH/USD (Ethereum):
Potential Direction: Bullish
Overall momentum of the chart: Neutral
Price is trading close to the pivot and could potentially make a bullish bounce off this level to rise towards the 1st resistance.
Pivot: 3,065.28
Supporting reasons: Identified as an overlap support, indicating a potential area where buying interests could pick up to stage a minor rebound.
1st Support: 2,878.94
Supporting Reasons: Identified as a pullback support, indicating a significant area that could halt further downward movement.
1st Resistance: 3,258.56
Supporting Reasons: Identified as a pullback resistance that aligns close to a 61.8% Fibonacci retracement level, indicating a historical barrier where selling pressures could intensify.
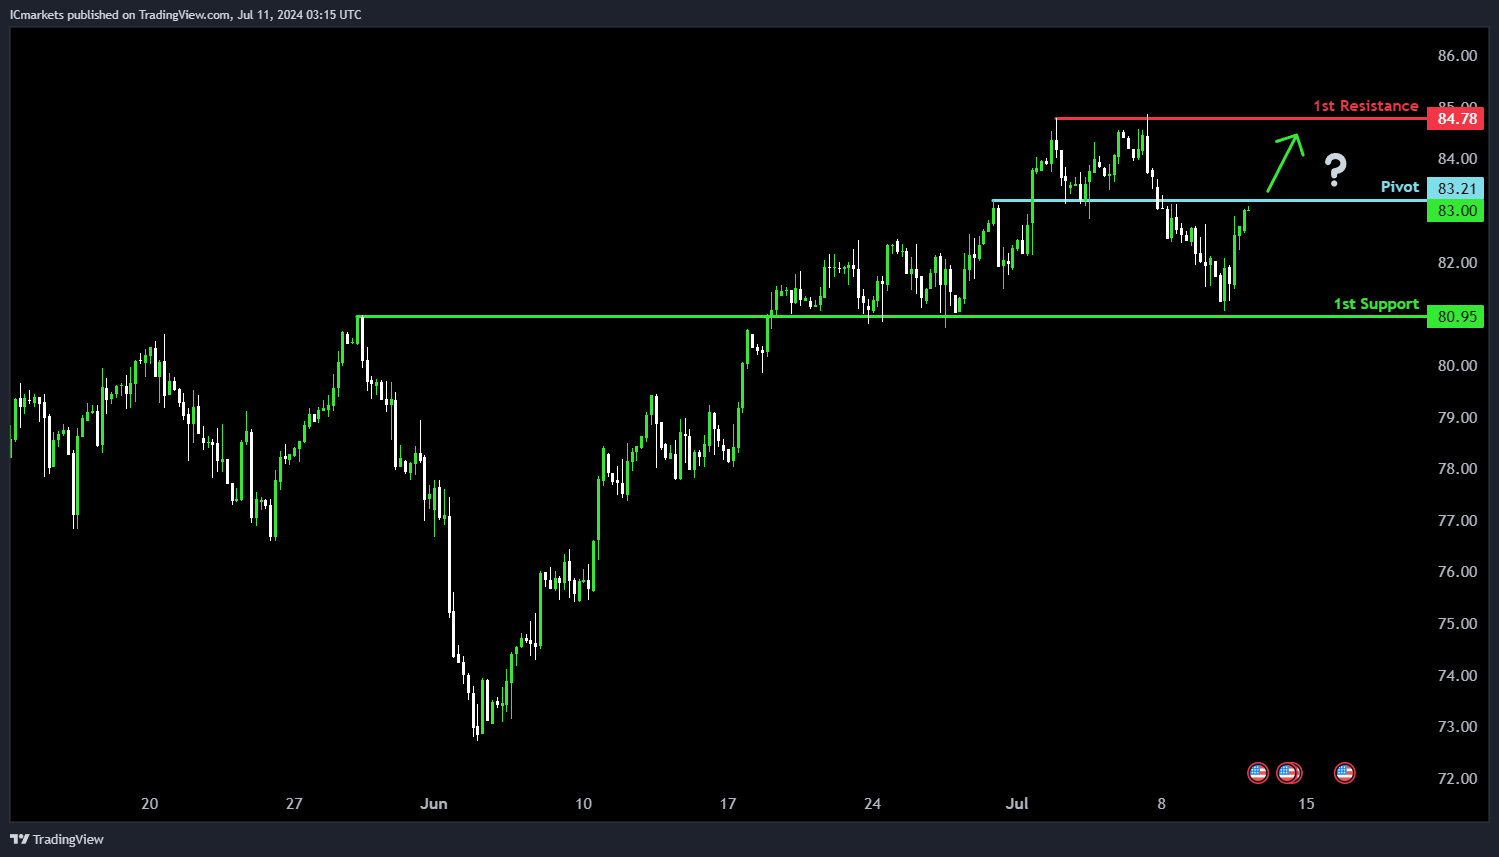
WTI/USD (Oil):
Potential Direction: Bullish
Overall Momentum of the Chart: Neutral
Price is rising towards the pivot and could potentially make a bullish break above this level to rise towards the 1st resistance.
Pivot: 83.21
Supporting Reasons: Identified as a potential breakout level where the bullish momentum could drive price higher.
1st Support: 80.95
Supporting Reasons: Identified as an overlap support, indicating a significant area where price could find strong support.
1st Resistance: 84.78
Supporting Reasons: Identified as a pullback resistance, indicating a potential barrier that could halt further upward movement.
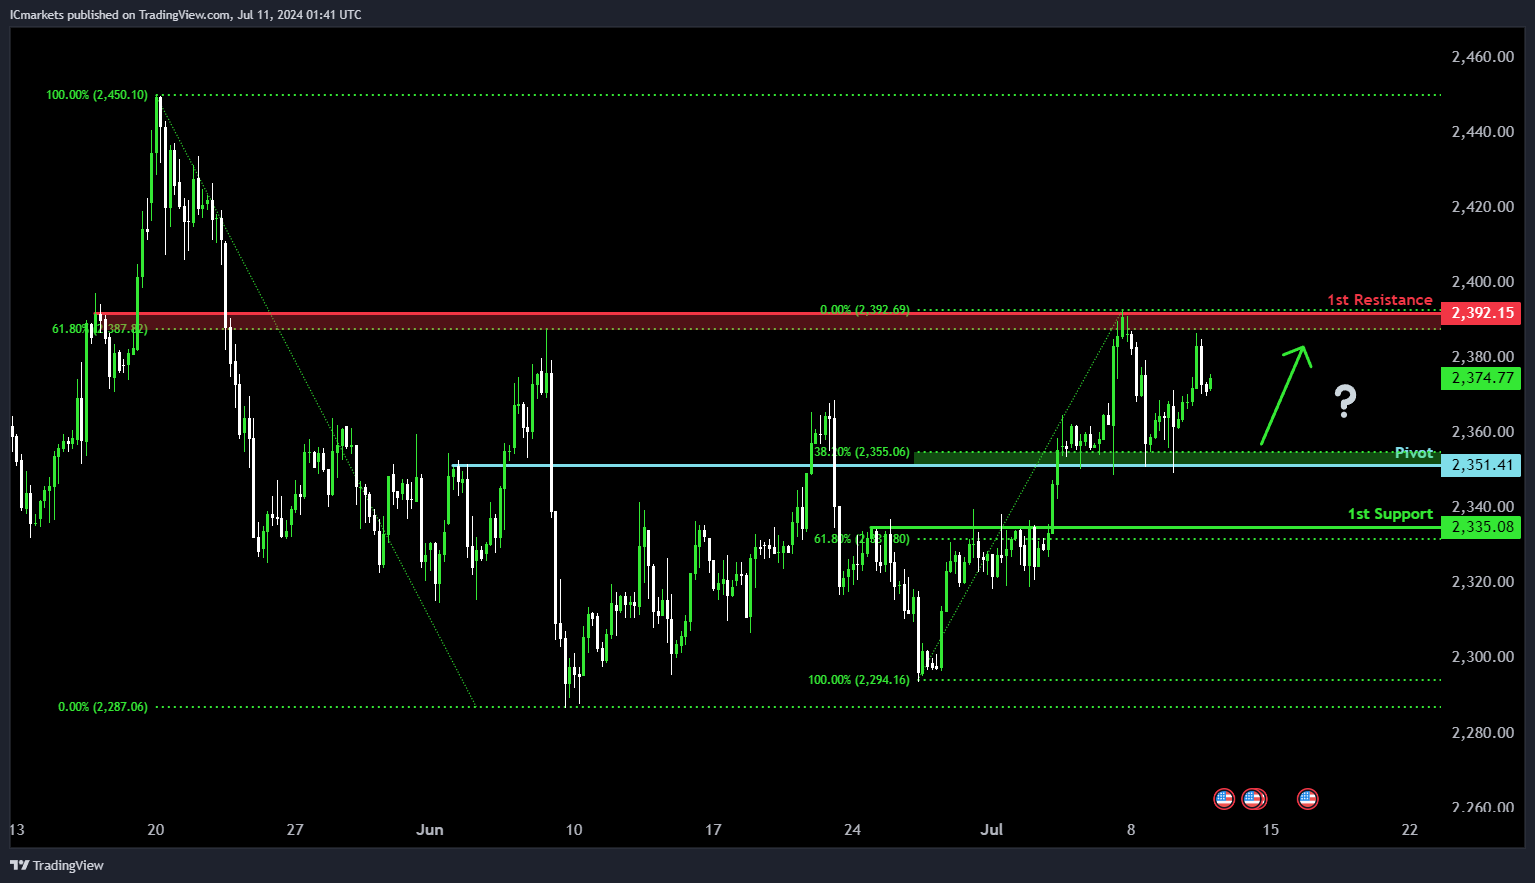
XAU/USD (GOLD):
Potential Direction: Bullish
Overall momentum of the chart: Bullish
Price could potentially make a bullish continuation towards 1st resistance.
Pivot: 2351.41
Supporting reasons: Identified as an overlap support level, specifically at the 38.20% Fibonacci Retracement, indicating a potential area where buyers could enter the market after a retracement.
1st support: 2335.08
Supporting reasons: Identified as a pullback support level, specifically at the 61.80% Fibonacci Retracement, suggesting a significant area where previous declines have found support.
1st resistance: 2392.15
Supporting reasons: Identified as an overlap resistance level, indicating a historical point where previous rallies have faced selling pressure or reversed.
The accuracy, completeness and timeliness of the information contained on this site cannot be guaranteed. IC Markets does not warranty, guarantee or make any representations, or assume any liability regarding financial results based on the use of the information in the site.
News, views, opinions, recommendations and other information obtained from sources outside of www.icmarkets.com, used in this site are believed to be reliable, but we cannot guarantee their accuracy or completeness. All such information is subject to change at any time without notice. IC Markets assumes no responsibility for the content of any linked site.
The fact that such links may exist does not indicate approval or endorsement of any material contained on any linked site. IC Markets is not liable for any harm caused by the transmission, through accessing the services or information on this site, of a computer virus, or other computer code or programming device that might be used to access, delete, damage, disable, disrupt or otherwise impede in any manner, the operation of the site or of any user’s software, hardware, data or property.